
Sample Category Title
BoE Inflation Forecasts Could Signal Earlier Rate Hike
- June election makes rate hike even less likely today;
- Higher inflation forecasts and consumer expectations could tempt hawks to favour hike;
- Oil climbing again after inventory data but gains may be limited.
It's been a relatively calm start to trading on Thursday, as we await the latest monetary policy decision, inflation report and press conference from the Bank of England in what has become known as "Super Thursday".
The monetary policy decision itself is unlikely to offer up any surprises, especially given its proximity to the UK election next month with the central bank not wanting to have any influence on the result. Of course, even in the absence of this, it's unlikely that policy makers would have voted to reverse any of the measures taken after the EU referendum last June. There was one vote for a rate hike from Kristin Forbes last month but the market clearly doesn't anticipate that support for this will gather much momentum.
That said, should the BoE upgrade its inflation forecasts in its inflation report today then it may tempt some of the more hawkish policy makers at the central bank to lean towards voting for a hike. The BoE previously claimed that inflation would peak at 2.8% in the first half of 2018 before falling gradually to 2.4% in three years but with the CPI measure rising quickly and already reaching 2.3%, it may be forced to upgrade these. What could be key is what impact the surge in inflation has had on consumer inflation expectations, which is likely a greater concern for policy makers. Any inclination that this is also rising could tempt one or two policy makers to vote for a hike.
As far as today is concerned, traders appear more focused on the possible path of interest rates going forward, rather than the prospect of one today or even in the near future. There is a belief among many that the BoE will refrain if possible from raising interest rates prior to the end of the two years of Brexit negotiations in an effort to avoid rocking the boat when the economy is already very vulnerable, regardless of what the data since June would suggest.
While many markets appear to be in wait and see mode today, oil is rising once again, up more than 1.5% in response to Wednesday's inventory data. The decline in inventories was much larger than had been anticipated, even if the warning signs were there on Tuesday when API released its own figures. Still, it's early to say whether this move has lifted oil from a lower range that it appeared to have entered into or provided the opportunity for temporary reprieve. Brent and WTI are both finding some resistance around $51 and $48, respectively, and a move above here could signal a sharper move to the upside. If it holds, it may suggest that momentum remains to the downside.
Technical Outlook: AUDUSD – Consolidation Above Weekly Cloud Base Remains Limited
The Aussie extends consolidation above fresh low at 0.7329, where weekly cloud base offered solid support and so far contained steep descend of past three weeks.
Upside attempts were limited under 0.7400 barrier for now, with Wednesday's daily candle with long upper wick weighing on near-term action.
Extended consolidation could be expected while pivots at 0.7413/23 (Fibo 38.2% of 0.7554/0.7327 downleg/falling 10SMA) stay intact. Slow stochastic is attempting to break out of oversold zone which may signal stronger correction.
Break above 0.7413/23 pivots is needed for bullish extension towards to open falling 20SMA barrier at 0.7477.
Strong bearish setup of daily studies suggests limited upside before larger bears resume, Firm break below weekly cloud will be seen as strong bearish signal.
Res: 0.7392, 0.7413, 0.7423, 0.7477
Sup: 0.7329, 0.7298, 0.7250, 0.7200
Technical Outlook: USDJPY – Bulls Keep 114.62 Fibo Barrier In Focus, Stops Raised To 113.60
The pair posted marginally higher high at 114.36 on Wednesday with early Thursday's narrow consolidation being capped here. Bulls remain firmly in play and focus target at 114.62 (Fibo 61.8% of 118.65/108.11 descend).
Overbought daily RSI and slow stochastic so far did not impact bulls, however, further easing cannot be ruled out.
Yesterday's correction low at 113.60 marks strong support and lower pivot, break of which would complete hourly double top and risk deeper pullback.
Plethora of strong supports consisting of 100SMA/rising 10SMA and daily cloud top, lies at 113.06/112.79 zone and should contain stronger dips.
Res: 114.36, 114.62, 114.87, 115.18
Sup: 114.05, 113.60, 113.48, 113.06
Downside Risks To China – And What It Means For Markets
Since January, we have highlighted that a China slowdown was brewing in 2017 (see Why China's Growth is Strong Now – and Why it Will Slow in 2017, 5 January). We are now seeing increasing evidence of this taking place: PMI decreased sharply in April, commodity prices for oil and metals have lost momentum and the Chinese stock market has fallen over the past month to the lowest level in four months
As we have argued for some time, Chinese tightening measures to reign in soaring house prices are set to slow growth in 2017. A 'normalisation' of infrastructure investments after the big boost in 2016 is also set to drive lower activity this year.
While we have been looking for the slowdown to be moderate, an increase in financial stress lately poses a clear downside risk to China's growth this year (see Research China: Financial stress on the rise again, 4 May). In China Daily on 5 May, an editorial started out 'China is in the midst of what proponents are heralding as its harshest crackdown on financial risks in history: a campaign that is by no means a fleeting gesture'. China Daily is state media and tends to represent the views of the leadership. While tackling financial risks in China is important, there is a clear danger that this is taking place when China was already set to slow down and that it is exacerbating the downturn. It comes on top of the risk of protective trade measures from US President Donald Trump in H2, once his trade investigation and steel probe are finished around mid-year. This could hurt Chinese exports.
Boost to global reflation reverses – rising risk for global markets
So, how should a weaker Chinese economy affect the global economy and markets?
1. Lift to global growth reverses: China is by far the biggest contributor to the global economy, driving one-third of global growth. The country was a major driver behind the global recovery in 2016. Commodity exporting emerging markets benefited strongly from both higher volumes and prices and developed markets saw a lift to exports to China and other emerging markets countries. With China slowing in 2017, the lift to the global economy reverses and this is a big reason why we look for a peak in the PMI cycle in H1.
2. From reflationary to disinflationary force: The sharp rise in commodity prices seen in 2016 was pulled largely by higher Chinese activity. With Chinese companies consuming 50% of global metals, China is a major driver of commodity prices. In the past few months, both metal prices and oil prices have declined, which in our view is linked partly to the softer Chinese economy. With the commodity price boost turning into a drag on global inflation, we believe global central banks will lose an important pillar in their mission to push inflation higher on a sustained basis; not least in the euro area, where slack is still ample and wage pressures low (see Research: Euro area wage growth should stay subdued, not supporting core inflation significantly, 5 May).
3. Less support to risk sentiment: A softer global cycle and rising downside risks from China have already had an impact on Chinese stocks, commodity prices and inflation markets, where euro area 5Y5Y breakeven inflation is back at 1.6% – the level reached when the ECB initiated its asset purchase programme in January 2015. So far, though, risk sentiment in the US, Europe and emerging markets has stayed upbeat on the back of strong profit growth and relief that political uncertainty is reduced following the election of Emmanuel Macron as the new French President. We recently turned neutral on equities on a short- to medium-term horizon.
4. Downside pressure on long bond yields: While Fed hikes and a possible change of forward guidance from the ECB are putting upward pressure on bond yields, the disinflationary force from China will put a downward pressure on yields. We believe these two forces will even each other out and expect range-trading markets for some time. Hence, we recommend investors take a tactical approach to acting in the bond market, trading the range rather than having a clear directional bias
5. Headwind for emerging markets assets: So far, there has been very little impact on emerging markets outside of China. Emerging market equities have continued higher despite lower commodity prices and rising stress in China. However, if we are right that the China slowdown will continue this year, emerging market assets will start to face some headwind from this angle. Emerging markets are still a popular carry game among investors, though. Therefore, we stick to our overweight on emerging markets versus developed markets for now, as the carry from higher yields and lower valuation in stocks is attractive and drives flows into emerging markets. However, any sign of spillover from China to other emerging markets should be on the radar screen.
Can the euro area decouple? We don't think so
So far, we have yet to see the same signs of a peak in euro business cycle indicators that we are witnessing in the US and China. Euro PMI has continued to move higher and points to robust growth. The economic surprise index in the euro area is also still high. This stands in sharp contrast to the steep fall that has taken place in the US. This raises the question whether the euro area PMI can continue to decouple.
We doubt this is the case. Part of the impetus for euro area manufacturing is currently coming from the export sector. This factor is likely to fade, with China slowing down. Euro area private consumption has also faced headwinds from a decline in real wage growth moving into negative territory (due to the rise in inflation) after a period of a decent increases in purchasing power when inflation was 1.5 percentage points lower than wage growth. Overall, we look for euro PMI to peak soon and follow the US and China lower. We do not expect a big setback or the recovery to derail but simply believe that the pace will slow a bit. However, in combination with a weaker global backdrop, this means the current very positive picture of the euro area will be less upbeat when we get to the end of the year. With inflation set to decline to around 1.0-1.5% in early 2018, we still believe the ECB will extend asset purchases into the new year but reduce our estimate of the pace to EUR40bn per month
Trade Idea: GBP/USD – Hold short entered at 1.2955
GBP/USD – 1.2915
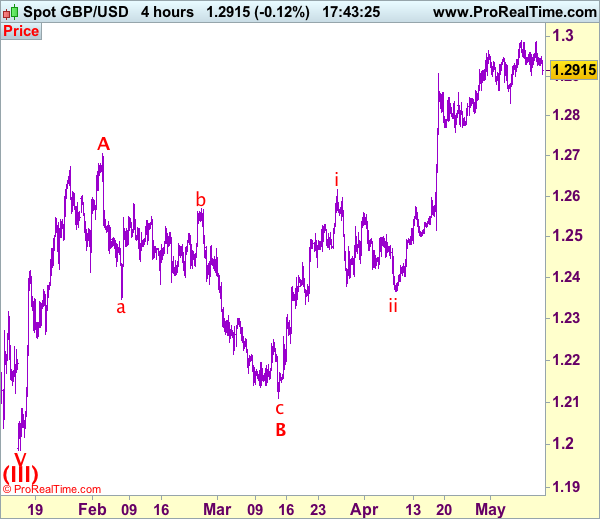
Recent wave: Wave V of larger degree wave (III) has ended at 1.1986 and major correction has commenced from there for gain to 1.3000 and 1.3140-50
Trend: Near term up
Original strategy :
Sold at 1.2955, Target: 1.2775, Stop: 1.3000
Position: - Short at 1.2955
Target: - 1.2775
Stop: - 1.3000
New strategy :
Hold short entered at 1.2955, Target: 1.2775, Stop: 1.3000
Position: - Short at 1.2955
Target: - 1.2775
Stop:- 1.3000
As cable has retreated after faltering below indicated resistance at 1.2991-00, retaining our view that further consolidation would be seen with mild downside bias for another test of 1.2900-03 support, break there would suggest a temporary top is possibly formed, bring weakness to 1.2831 support, however, a break below this level is needed to add credence to this view, bring retracement of recent rise to 1.2770-75 but previous support at 1.2757 should hold from here. We are keeping our view that the wave c as well as larger degree wave B has ended at 1.2109, hence impulsive wave C has commenced from there with wave i of C ended at 1.2616, follow by a correction to 1.2365 (end of wave ii) and wave iii rally is unfolding.
Our preferred count on the daily chart is that cable's rebound from 1.3500 (wave (A) trough) is unfolding as a wave (B) with A ended at 1.7043, followed by triangle wave B and wave C as well as wave (B) has ended at 1.7192, the subsequent selloff is the larger degree wave (C) which is still unfolding with minor wave (III) of larger degree wave 3 ended at 1.1986, hence wave (IV) correction is in progress which could either be a triangle wave (IV) of a complex formation but upside should be limited to 1.3500 and price should falter well below 1.4000, bring another decline in wave (V) of 3 for weakness to 1.1500, then 1.1200.
On the upside, expect recovery to be limited to 1.2950 and bring another retreat later. Above said resistance at 1.2995 would extend recent upmove to 1.3040-50 but overbought condition should limit upside to 1.3075-80 and price should falter below 1.3100.
Trade Idea: GBP/JPY – Buy at 145.75
GBP/JPY - 147.45
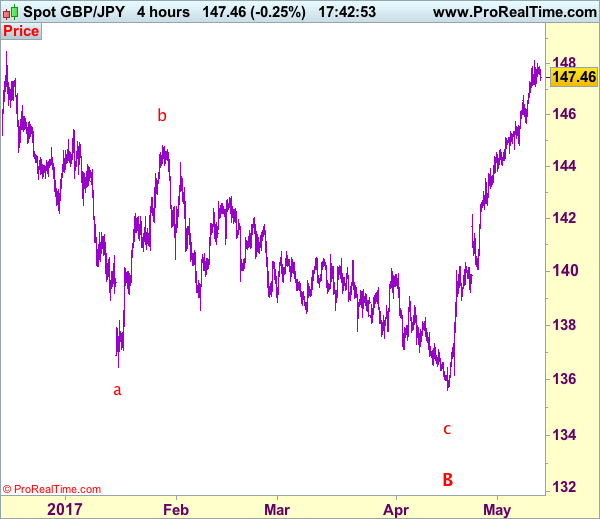
Recent wave: Medium term low formed at 120.50 and (A)-(B)-(C) major correction has commenced with (A) leg ended at 148.45, hence wave (B) is unfolding for retreat to 131.00-10.
Trend: Near term up
Original strategy:
Buy at 145.75, Target: 148.75, Stop: 145.15
Position: -
Target: -
Stop: -
New strategy :
Buy at 145.75, Target: 148.75, Stop: 145.15
Position: -
Target: -
Stop:-
Sterling’s near term sideways trading below resistance at 148.10 is expected to continue and pullback to 146.50-60 cannot be ruled out, however, reckon downside would be limited to 145.70-75 and bring another upmove later, above said resistance at 148.10 would extend recent upmove from 135.60 to previous chart resistance at 148.45, then towards 148.90-00 but near term overbought condition should prevent sharp move beyond 149.50, bring retreat later.
In view of this, would not chase this rise here and would be prudent to buy sterling on subsequent pullback as 145.65-70 should limit downside, bring another rise later. Below said support at 145.15-20 would defer and suggest a temporary top is possibly formed, bring correction to 144.80-85 but only break there would provide confirmation, bring correction to 144.50 first.
Our preferred count is that larger degree wave V with circle is unfolding from 251.12 with wave (I) 219.34, (II): 241.38 and wave (III) is subdivided into 1: 192.60, 2: 215.89 (23 Jul 2008) and wave 3 ended at 118.87 earlier in 2009. The correction from there to 162.60 is wave 4 which itself is a double three and is labeled as first a-b-c ended at 151.53, followed by wave x at 139.03, 2nd a ended at 162.60, 2nd b at 146.75 and 2nd c leg of wave 4 ended at 163.00. Therefore, the decline from 163.00 to 116.85 is now treated as wave 5 which also marked the end of larger degree wave (III), hence wave (IV) major correction has commenced for retracement of the wave (III) from 241.38 and upside target at 183.95-00 (50% Fibonacci retracement of the wave (II) from 241.38) had been met, a drop below 160.00 would suggest wave (IV) has ended at 195.85, bring decline in wave (V) for initial weakness to 130 (already met) and 120.
EUR/GBP Elliott Wave Analysis
EUR/GBP – 0.8422
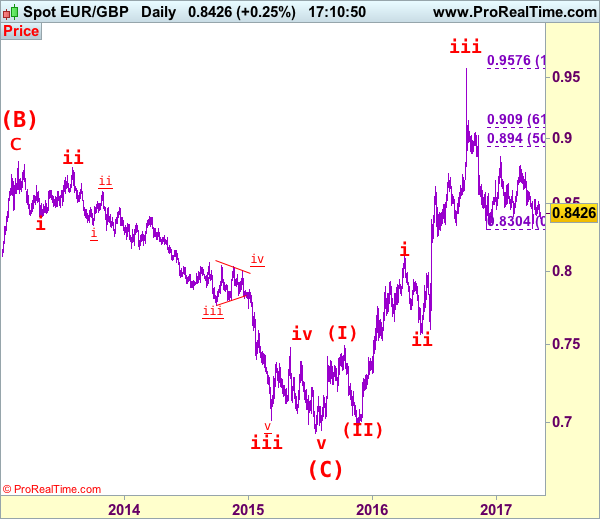
EUR/GBP – The major (A)(B)(C)-(X)-(A)(B)(C) correction from 0.9805 is unfolding and 2nd (A) has possibly ended at 0.6936.
As the single currency retreated after meeting resistance at 0.8531 late last month, suggesting consolidation with mild downside bias would be seen and initial weakness to 0.8360-65 cannot be ruled out, however, as long as support at 0.8312 holds, prospect of another rebound remains, above 0.8509 (last week’s high) would bring test of 0.8531 but break there is needed to retain bullishness and signal low is formed at 0.8312, bring a stronger rebound to 0.8592, break there would signal the fall from 0.8857 has ended instead, bring further subsequent gain to 0.8650-60 and possibly towards resistance at 0.8735 but price should falter well below resistance at 0.8788.
Our latest preferred count is that the wave V of a 5-wave series from 0.5682 ended at 0.9805 earlier and major from there has possibly ended at 0.8067 as A-B-C-X-A-B-C. We are keeping our view that the entire correction from 0.9805 has possibly ended at 0.7756 and as labeled as the attached daily chart and impulsive move from 0.9084 has ended at 0.7756 as a 5-waver which marked either the (C) wave or the A leg of (C), a daily close above resistance at 0.8831 would suggest (C) leg has ended and headway towards 0.9084.
On the downside, whilst the pullback from 0.8531 may bring initial weakness to 0.8360-65, reckon downside would be limited and said support at 0.8312 should hold, bring another rebound later. A drop below 0.8351 support would signal the rebound from 0.8312 has ended but only break of said support at 0.8304 would revive bearishness and indicate early decline from 0.9576 top (2016 high) has resumed for weakness to 0.8251 support, then 0.8200.
Recommendation: Stand aside for this week.
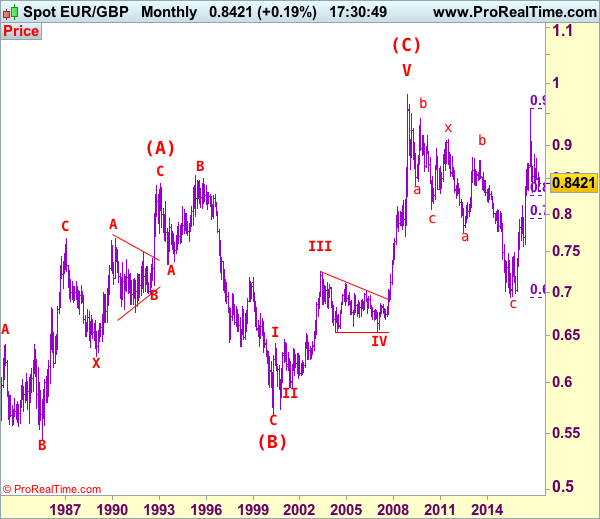
Euro's long term uptrend started in Feb 1981 at 0.5039 and is unfolding as a (A)-(B)-(C) move with (A): 0.8433 (Feb 1993), (B): 0.5682 (May 2000) and impulsive wave (C) should have ended at 0.9805 with wave III ended at 0.7254 (May 2003), triangle wave IV at 0.6536 (23 Jan 2007) and wave V as well as wave (C) has ended at 0.9805.
We are keeping an alternate count that only wave III ended at 0.9805 and the correction from there is the wave IV and may extend weakness to 0.7700, however, it is necessary to see a daily close above resistance at 0.9143 would change this to be the preferred count.
NZD Falls To 11-Month Low, BoE In Focus
NZD tumbles amid dovish RBNZ
The New Zealand dollar tumbled 1.20% during the Asian session after the RBNZ surprised the market with a dovish statement. The Kiwi slid to 0.6718 against the greenback, its lowest level since June 3rd last year. The central bank held the Official Cash Rate (OCR) at record low 1.75%, as broadly expected by market participants. The disappointment stems from the fact that Governor Wheeler failed to acknowledge the recent positive developments in both inflation levels and the Kiwi trade-weighted value (-5% since the February meeting).
Inflation forecast was revised to the upside with the headline measure expected to hit 2.1%y/y in the third quarter before easing toward 1.1% in the first quarter of 2018. The RBNZ justified its decision by stating that the recent pick-up in consumer prices “was mainly due to higher tradable inflation, particularly petrol and food prices” and added that “the level of core inflation has generally remained low”. Those elements suggest that the RBNZ is in no hurry to increase borrowing cost.
In our view, the central bank is simply playing for time, waiting for the Fed to tighten further its monetary policy before making a move. Historically, as a commodity producer country, New Zealand is used to deal with stronger inflationary pressure - remember the RBNZ has a target band of 2% +/-1%. Looking at the current inflation picture, it is obvious that the RBNZ as time to see it coming. Meanwhile, it will continue to emphasize the strength of the Kiwi, which is weighting on tradable inflation.
NZD/USD is currently testing the key support area at around 0.6800-80 (previous lows). A clear break of this area is needed to trigger a sell-off in the Kiwi. We do not rule further NZD weakness, especially given the recent pick-up in US treasury yields, while Kiwi’s ones have been moving lower consistently since the beginning of the year.
HKD weakens further
The long USD short HKD trade continues uninterrupted, clearly having no fears of preemptive official intervention at this point. USDHKD increased to 7.7891 in Asian trading well below the Hong Kong Monetary Authority’s 7.85 upper band (7.75 to 7.85 convertibility range). HKMA has expressed commitment to the USD linked exchange rate (expected to intervene at 7.8), yet the rapid HKD deprecations spawn questions about the sustainability of the peg. The widening US-HK interest rate differential makes borrowing cheap in HK and buying in US a tempting candidate for carry traders. Concerns over Hong Kong’s attempt to slow house price appreciations on tighter lending practices and increase in purchase tax has pushed Hibor (1-month Hibor 0.38 from 0.75 in Jan) below the US equivalent while high levels of interbank liquidy lower demand for HKD.
In addition, China’s is also in the process of tightening of financial conditions and expectations of gradual Fed interest rate increases and reduction in balance sheet are all generating excessive outflows. However, the hazard of waiting is that speculative short selling of HKD could complicate the HKMA objective and even threaten the stability of the banking system. Waiting could force the HKMA to intervene but possibly raise interest rates. Given the high level of leverage in Hong Kong house holds a sharp rate increase would pressure debt holder and constrict consumptions, a dangerous spiral. Currently give the manageable fundamental backdrop and the HKMA massive $3.5 trillion reserves we see no threat to the USD peg.
BoE to keep rates unchanged today
Today the Bank of England will decide about its interest rate that should likely remain around 0.25% against the backdrop of political uncertainties. Indeed, the 8th of June New General Election will take place, after Theresa May asked the Queen Elizabeth to dissolve the parliament. UK Prime Minister is attempting to gain a stronger majority before negotiation on the article 50 with the EU.
This is why the British central bank should favour today the wait-and-see mode. Political uncertainties regarding the 2-year negotiation period prevail. Anyway, the BoE has gained some time since last year as the UK economy had clearly benefited from pound devaluation after the Brexit vote. The inflation is now standing at 2.3% y/y. Yet the growth seems still a bit slow (0.3% for Q1 GDP). The unemployment rate keeps declining and is now standing at a 12-year low.
However, there is one important thing to be said, the UK trade deficit is still very large despite the weak pound. The trend is clearly negative and amounts for £3.6 billion. We believe that, even though the weak pound is helping the economy, it also means that the overseas demand is falling for UK goods certainly on fears that the trade relations with the UK are unclear at the moment.
USD/CAD Elliott Wave Analysis
USD/CAD – 1.3709
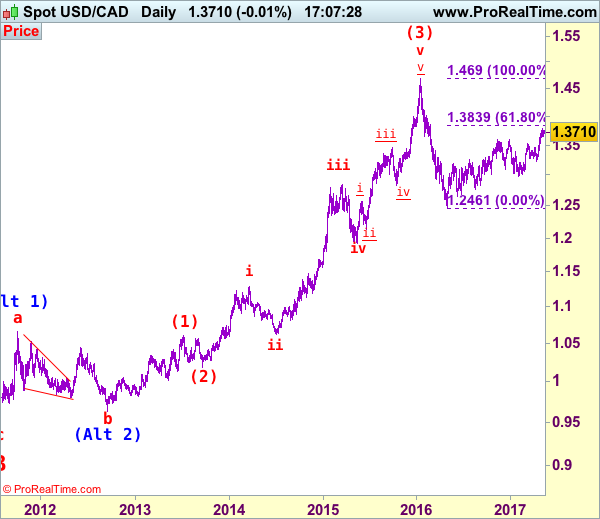
USD/CAD – Wave v ended at 0.9407 and a-b-c correction may extend gain to 1.4700
As the greenback has maintained a firm undertone after recent rally, suggesting the erratic rise from 1.2461 low is still in progress and bullishness remains for this move to bring at least a strong correction of the fall from 1.4690 (2016 high) to 1.3800 and later 1.3835-40 (61.8% Fibonacci retracement of 1.4690-1.2461), however, near term overbought condition would limit upside to 1.3890-00 and reckon upside would be limited and price should falter well below psychological resistance at 1.4000, bring retreat later.
We are keeping our view that the wave b from 1.0657 (a leg top) has possibly ended at 0.9633 with (a): 0.9800, wave (b): 1.0447 and wave c at 0.9633, the subsequent rise from there is now treated as wave c exceeded indicated upside target at 1.3770-80 and 1.4000 and wave (3) has possibly ended at 1.4690 and wave (4) correction has commenced for retracement back to 1.2832 support, then 1.2410-20.
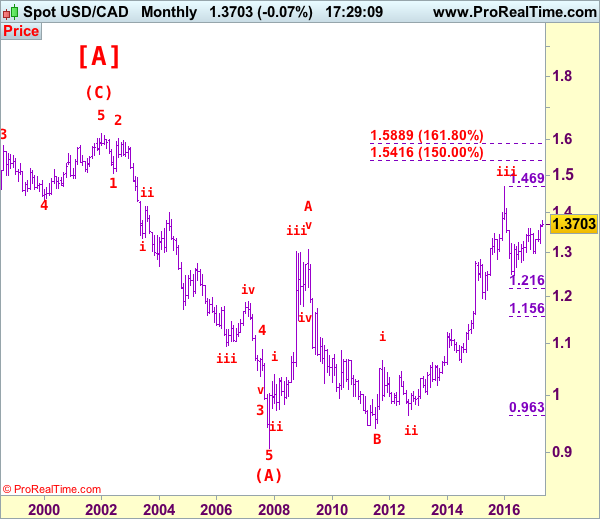
On the daily chart, our latest preferred count remains that the A of (B) rally from 0.9059 low (7 Nov 2007) unfolded into an impulsive wave with i: 0.9059-1.0380, ii ended at 0.9819, iii at 1.3019 followed by triangle wave iv at 1.2026 , then wave v formed a top at 1.3066 and also ended the wave A. The wave B is unfolding as an double three a-b-c-x-a-b-c and is sub-divided as a: 1.2192, b: 1.2716 and wave c at 1.0784, followed by wave x at 1.1725, another set of a-b-c unfolded with 2nd a at 0.9931, 2nd b at 1.0674. the 2nd c has possibly ended at 0.9407, therefore, consolidation with upside bias is seen for major correction, indicated target at 1.3900 had been met and gain to 1.4700 would follow.
On the downside, whilst pullback to 1.3650 cannot be ruled out, reckon downside would be limited and support at 1.3530 should remain intact, bring another rise later. A daily close below 1.3530 would defer and suggest top is possibly formed, risk weakness to 1.3450-60 but break of indicated support at 1.3411 is needed to add credence to this view, bring further fall to 1.3380-85, then 1.3335-40.
Recommendation: Buy at 1.3650 for 1.3850 with stop below 1.3550.
Longer term - The selloff from 1.6194 (21 Jan 2002) to 0.9059 (07 Nov 2007) is viewed as (A) wave which is a 5-waver as labeled on the monthly chart as below, the subsequently rally is labeled as (B) with impulsive A leg of (B) ended at 1.3066, wave B of (B) is unfolding which has either ended at 0.9407 or would extend one more fall but downside should be limited to 0.9200 and 0.9000 should hold.
Euro Subdued, German Inflation Beats Estimate
The euro is quiet in the Thursday session, as EUR/USD trades at 1.0880. On the release front, German WPI posted a gain of 0.3%, beating the estimate of 0.1%. The EU released its Spring 2017 Economic Forecast, which presented a generally optimistic picture of the economies of EU members. In the US, PPI is expected to show a slight gain of 0.2%, and unemployment claims is forecast to climb to 245 thousand. On Friday, Germany releases Preliminary GDP. It will be a busy day in the US, which will publish retail sales, CPI and consumer confidence.
The eurozone received its semi-annual report card on Thursday, as the European Commission released its Spring 2017 Economic Forecast. The report noted that the European economy is in its fifth year of recovery, and forecast eurozone GDP growth of 1.7% in 2017 and 1.8% in 2018. On the inflation front, the report stated that inflation had risen in recent months, but this was mainly due to an increase in oil prices. Still, inflation was expected to reach 1.6% in 2017 and 1.3% in 2018, compared to just 0.2% in 2016. Stronger growth has led to lower unemployment, and the report projected that eurozone unemployment rate would drop to 9.4% in 2017 and 8.9% in 2018. The report reiterated what ECB president Mario Draghi has long been saying, namely, that risks to the eurozone economy remain tilted to the downside. These risks include US economic and trade policy under President Trump, the banking sector in Europe and the UK’s exit from the EU. This forecast is considerably more optimistic than the Winter 2017 forecast, as is apparent from the captions in the press releases for these two reports: The Winter forecast was entitled “Navigating through choppy waters”, while the caption for the Spring forecast reads “Steady growth ahead”.
Donald Trump has been embroiled in a number of controversies in his short presidency, but the political earthquake he has now stirred could become political quicksand for the new president. Trump abruptly fired FBI director James Comey on Tuesday, stunning lawmakers on both sides of the aisle in Congress. Comey, who has been conducting an investigation into possible collusion between Trump and Russia during the presidential campaign, clearly has been a thorn in Trump’s side. The White House has claimed that it fired Comey over his handling of an email scandal involving Hillary Clinton, but the move has been roundly condemned by the Democrats, and some key Republicans have also voiced opposition as well. The firestorm could heat up further, with calls in Congress to appoint a special prosecutor into Trump’s connections with Russia. Has Trump gone one step to far? This latest controversy could cause some jitters among investors and hurt the US dollar.