Sample Category Title
Technical Outlook: Cable – Break Of 1.2900/1.3000 Pivots To Signal Fresh Direction, BoE Reports Seen As A Trigger
Cable is holding within 1.2900/87 congestion for the third day, awaiting the outcome from BoE’s super Thursday on policy decision and inflation report.
Markets are widely expected the central bank to stay unchanged today, but focus will turn on the minutes of the previous meeting. Lat time, one MPC member voted for rate hike towards the end of the year and markets will be closely watching for today’s minutes’ numbers.
If number of voters for early rate hike increases that would be good support for the pound.
Inflation remains steady above 2% and unemployment is holding ant multi-year lows, which are supportive factors.
On the other side GDP fell below expectations in Q1 that weighs on sentiment.
Traders are also focusing on the press conference of BoE’s Governor Carney for more hints.
From the technical point of view, cable remains bullish overall, with recent dips being contained by daily Tenkan-sen line (1.2908) which marks initial support.
Strong indecision was signaled by long shadows of past two days’ candles, as the pair faced strong headwinds at psychological 1.3000 barrier.
Indication of fresh downside comes from daily RSI and slow stochastic that turned south after touching overbought zone boundary.
Initial bearish signal could be expected on loss of 1.2900 handle which may trigger bearish acceleration towards next pivots at 1.2830 (04 May trough) and 1.2750 (Fibo 38.2% of 1.2363/1.2986 rally).
Alternative scenario needs sustained break through 1.3000 barrier for attack at next strong barrier at 1.3088 (base of falling weekly Ichimoku cloud).
Res: 1.3000, 1.3050, 1.3088, 1.3146
Sup: 1.2900, 1.2830, 1.2770, 1.2750
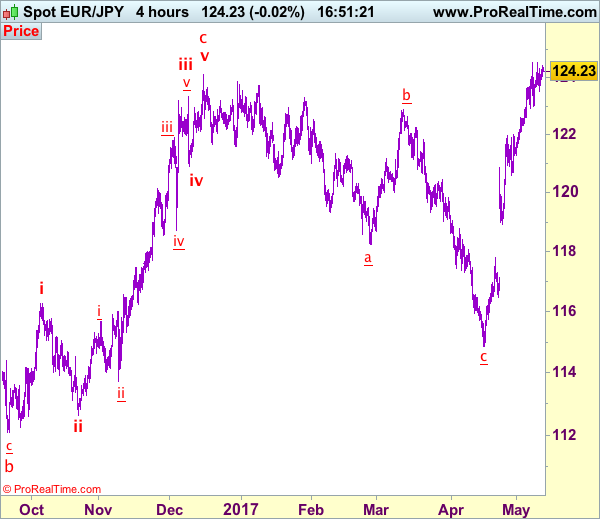
Trade Idea: EUR/JPY – Hold short entered at 124.00
EUR/JPY - 124.20
Recent wave: wave v of (C) ended at 94.12 and major correction in wave A has ended at 149.79
Trend: Near term up
Original strategy:
Sold at 124.00, Target: 122.20, Stop: 124.55
Position: - Short at 124.00
Target: - 122.20
Stop: - 124.55
New strategy :
Hold short entered at 124.00, Target: 122.20, Stop: 124.55
Position: - Short at 124.00
Target: - 122.20
Stop:- 124.55
Although the single currency has rebounded again after finding support at 123.50 yesterday, as long as indicated resistance at 124.55 holds, further consolidation would take place with mild downside bias for a test of support at 122.92-98, break there would suggest a temporary top is possibly formed, bring further fall to 122.60 but break of 122.00-10 is needed to add credence to this view, bring retracement of recent upmove to 121.50 first.
In view of this, we are holding on to our short position entered at 124.00. Above said resistance at 124.55 would abort and signal recent upmove is still in progress and may extend further gain towards 125.00 level but loss of upward momentum should prevent sharp move beyond 125.40-50, risk from there is seen for another retreat later.
Our latest preferred count is that wave (ii) is ABC-X-ABC which ended at 123.33 and wave (iii) is unfolding with wave iii ended at 100.77, followed by wave iv at 111.57 and wave v as well as the wave (iii) has ended at 97.04, followed by wave (iv) at 111.43 and wave (v) has ended at 94.12 which is also the end of the larger degree v, this also implied the major wave (C) has also ended there, hence major correction has commenced from there with (A) leg unfolding in its lower degree wave c which has possibly ended at 145.69. Under this count, A-B-C wave (B) has commenced with A leg ended at 136.23, wave B at 143.79 and wave C has possibly ended at 149.79.
Our larger degree count is that the decline from 139.26 is wave (C) and is sub-divided into a diagonal triangle i-ii-iii-iv-v with wave i - 105.44, wave ii- 123.33, wave iii - 97.03, wave iv - 111.43, followed by the final wave v as well as the end of wave (C) at 94.12, this also mark the bottom of larger degree wave B. Under this count, major rise in wave C has commenced as an impulsive wave with minor wave III ended at 145.69, wave V is still in progress for further gain to 150.00. Having said that, this so-called wave V could well be the first leg of larger degree 5-waver wave C and this wave C should bring at least a retest of wave A top at 169.97 (July 2008).
Daily Technical Analysis: GBP/USD Super Thursday Event – Running Flat Top Ascending Pattern
The main focus today is BOE interest rate decision with monetary policy summary. This is called Super Thursday event and I expect it to be very volatile. The event is scheduled for 11 AM GMT. The BOE will also present its quarterly inflation report which has been updated. We might see two-way price movement.
The pattern that is formed is called - running flat top ascending triangle. It is a running pattern because the apex of the triangle has not been established yet. This suggest two way price movement, that could be also fueled with Balance of Trade date today. There are two zones traders should focus on at this point.1.2995 is a strong resistance and a break of 1.2995 (D H5, ATR high) may target 1.3025 to 1.3050 - Weekly H3 camarilla pivot and round number resistance. Break of lower zone (D L3, ATR pivot) 1.2916 might target even 1.2825 level - Weekly L5 camarilla. I suggest you use VPS tool in the case you want to trade GBP/USD today.
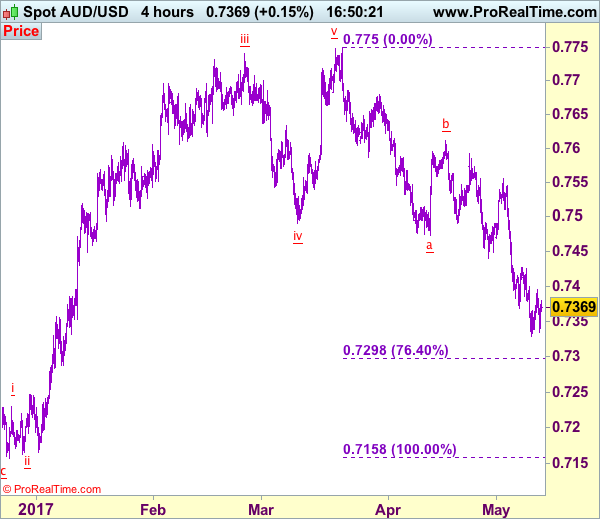
Trade Idea: AUD/USD – Buy at 0.7300
AUD/USD – 0.7368
Recent wave: Wave 5 ended at 1.1081 and major correction has commenced for fall to 0.7000 and then towards 0.6500-10
Trend: Near term down
Original strategy :
Buy at 0.7300, Target: 0.7500, Stop: 0.7240
Position: -
Target: -
Stop: -
New strategy :
Buy at 0.7300, Target: 0.7500, Stop: 0.7240
Position: -
Target: -
Stop:-
Although aussie’s recovery from 0.7329 suggests minor consolidation above this level would be seen, reckon 0.7400 would limit upside and bring another decline later, below said support at 0.7329 would extend one more fall to 0.7295-00 (76.4% retracement of 0.7158-0.7750), however, loss of downward momentum should prevent sharp fall below there and bring rebound later, above 0.7425-30 would bring subsequent gain to 0.7490-00 but break of 0.7510 is needed to signal low is formed, then test of resistance at 0.7556 would follow.
In view of this, we are inclined to turn long on next decline. Below 0.7245-50 would risk weakness to 0.7200-10, however, reckon previous support 0.7158 would contain downside and aussie may stage another strong rebound from there later this week.
On the 4-hour chart, the move from 0.8066 is the wave 5 with i: 0.8860, ii: 0.8315, wave iii is an extended move ended at 1.0183, iv: 0.9706 and wave v has ended at 1.1081 (also the top of entire wave 5). The subsequent selloff is the major correction which is unfolding as ABC-X-ABC and 2nd A leg has ended at 0.8848, followed by a-b-c wave B which ended at 0.9758, hence, 2nd C wave is now in progress and indicated downside target at 0.7000 and 0.6950 had been met, so further fall to 0.6710-20 cannot be ruled out.
US Import Prices Surge 0.5% In April
.
'In April, higher prices for nonfuel industrial supplies and materials; foods, feeds, and beverages; and each of the major finished goods categories all contributed to the overall rise in nonfuel prices.' - US Bureau of Labour Statistics
The US Import Price Index managed to post a larger-than-expected gain over the course of April, official data revealed on Wednesday. The US Bureau of Labour Statistics reported that the price index for US imports tacked on 0.5% in April, following the upwardly revised 0.1% uptick registered in the preceding month and beating analysts' expectations for a 0.2% increase. April's surge was mainly driven by higher fuel prices, which rose 1.6% over the month of April, following a 0.9% drop observed in March. A 1.6% hike in prices for petroleum and a 4% advance in natural gas prices appeared to be the main contributors to the increase in fuel prices. In the meantime, the price index for imports excluding fuel rose 0.3% in April, following an increase of 0.2% posted in the previous month. As reported by the US BLS, higher prices for food and beverages, industrial supplies and materials as well as an uptick in feeds managed to bolster the overall acceleration in nonfuel prices. Over the year, prices for US imports soared 4.1% in April, while export prices inched 3% higher over the same period.
RBNZ Holds Benchmark Rate At Record Low Of 1.75%
'…the growth outlook remains positive, supported by on-going accommodative monetary policy, strong population growth, and high levels of household spending and construction activity.' - Reserve Bank of New Zealand
Yet again, the Reserve Bank of New Zealand left its monetary policy unchanged at its May meeting on Wednesday in support of inflation and steady economic growth. The Monetary Policy Committee voted to hold the official cash rate at a record low of 1.75%, where it has stood since November last year, satisfying market analysts who are eyeing a gradual tightening beginning not earlier than at the start of 2018. In the May statement, the RBNZ highlighted that the monetary policy is likely to remain accommodative until late 2019, however, economists worldwide argued that this would be difficult to justify, as inflation continues to spike up. The CPI was up 2.2% in the Q1 of 2017, much higher than the 1.5% projected by the Central Bank. Since 2011, it was the first time when the RBNZ has reached the mid-point if its inflation target range of 1-3%. Meanwhile, data released last week suggested long-run inflation expectations across the business sector also inched higher in the first quarter. Overall, the RBNZ Governor Graeme Wheeler remained upbeat on the country's economic outlook, though still warned that major challenges remain emplace.
EUR/USD Analysis: Stalls Below 1.09
'Traders continue to be wary of the EUR as it approaches the 1.0820 area that was the opening level after the first round of French presidential voting.' – Alexandria Arnold and Dennis Pettit, Bloomberg
Pair's Outlook
On Thursday morning the common European currency traded between the 1.0860 and 1.0880 levels against the US Dollar. From a technical perspective the currency exchange rate was still set to decline down to the support cluster, which surrounds the 1.0830 mark. However, due to recent US Dollar weakness caused by political events in the country the currency pair has remained just below the 1.09 level. Markets are still expecting the Euro to resume its decline, as the European Central bank is set to continue its stimulating monetary policy.
Traders' Sentiment
SWFX traders remain bearish, as 60% of open positions are short. In addition, 65% of trader set up orders are set to sell the Euro.
GBP/USD Analysis: Attempts To Break Away From Weekly PP
'The improved optimism regarding the macro fundamentals are supportive of a stronger US dollar in the current circumstances.' – London Capital Group (based on Investing.com)
Pair's Outlook
The Cable remained completely flat on Wednesday, although some upside volatility was registered. The Pound has been consolidating against the US Dollar for quite some time now, but with the bullish momentum moderately prevailing. According to technical studies, the Sterling should continue outperforming the US Dollar, with demand at 1.2934, represented by the weekly PP, remains sufficient to keep the pair afloat, and no resistance is preventing the exchange rate from climbing over the 1.30 level. The overall ceiling for now is the area sirca 1.3130, where a number of supply levels coincide with the ascending channel's upper boundary.
Traders' Sentiment
Market sentiment remains unchanged, with 51% of all open positions being short for the fifth consecutive time.
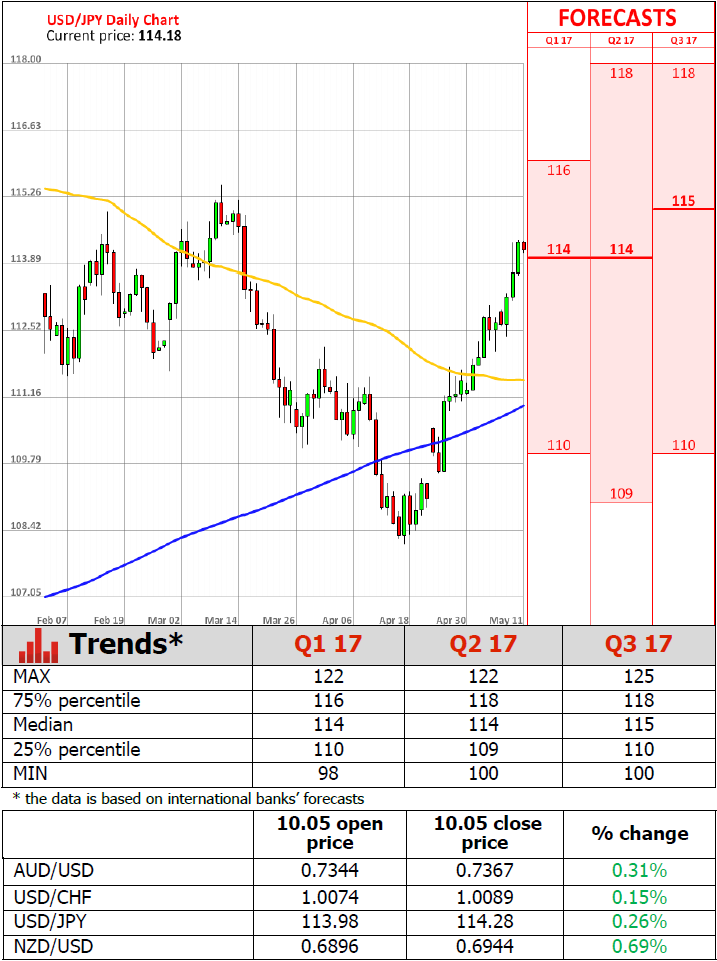
USD/JPY Analysis: Set For Another Rally
'With this [expectations of the newly-elected South Korean President to negotiate with North Korea] in the background, as well as the present uncertainty in the U.S., the dollar will trade heavily today below the 114-yen level.' – Daiwa Securities (based on Reuters)
Pair's Outlook
The USD/JPY currency pair surprised with its performance once again, having breached the immediate resistance, thus, stabilizing above 114.00. However, due to the recent almost constant three-week rally, a bearish correction is bound to take place sooner or later, but according to technical indicators—today is no such case. With the weekly and the monthly R2s now providing immediate support, the Buck has the opportunity to even put the 115.00 level to the test, as the upper Bollinger band marks the possible intraday high, as well as the a psychological resistance area, which the given pair failed to pierce back in March.
Traders' Sentiment
There are 66% of traders holding short positions (previously 65%), while 51% of all pending orders are to acquire the US Dollar.
Gold Analysis: Remains Above Resistance
'From a pure technical-fundamental aspect, everybody would be eying $1,200 as the next level of support, but I think $1,215 support here is not out of the question.' – Spencer Campbell, Kaloti Precious Metals (based on Reuters)
Pair's Outlook
Due to fundamental events in the US the price of the yellow metal remained above the 1,220 mark on Thursday morning. The future course of the commodity price is unclear, as both from a technical and fundamental perspective the yellow metal's price is being squeezed. The metal keeps finding support in the support cluster below it, which has forced the bullion into breaking short term descending channel patterns that were reviewed in the Trade Pattern Ideas section of Dukascopy Bank. Due to that reason it is possible that a surge is about to occur up to the 1,242 mark in the medium term.
Traders' Sentiment
Trader open positions remain neutral. However, 66% of trader set up orders are set to buy the bullion.