Sample Category Title
Oil’s Dead Cat Bounce Ahead Of Crude Inventories
Crude oil recouped some of its intra-session losses overnight, but the wolves are still circling.
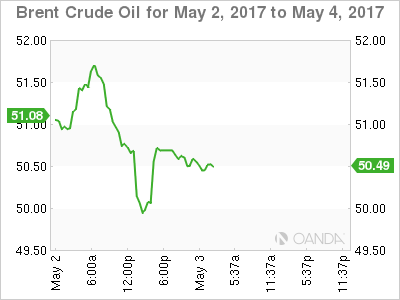
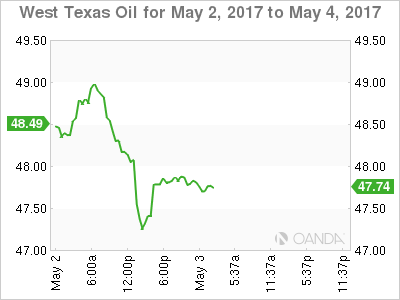
Oil was whipsawed overnight, as both Brent and WTI fell over two percent in the New York trading session as news hit the wires that OPEC's compliance level had dropped to 90%. Crude was saved by the bell, so to speak, by the API Crude Inventory numbers very late in the session. These showed an unexpectedly large drop in inventories of 4.2 million against an expected draw of 2.3 million barrels sending Brent and WTI up one percent.
Even with the late bounce in prices though, both Brent and WTI remain on their knees from a technical perspective. All attention may be on the FOMC this evening but for energy traders, far more important will be the official EIA Crude Inventories coming out 2.5 hours before the main event. The market is expecting a 3 million barrel draw down, and we can expect a decent move on a miss either way.
Brent spot trades at 50.50 in early Asia having broken and closed below its 200-day moving average at 50.95 overnight. Above here resistance is at 51.75. Support lies at 49.75 and then the March low at 49.50 close behind. A break here could see more stop loss selling.
WTI spot trades at 47.75 in Asia with two closes under its 200-day moving average now at 48.75. Behind this is a double top resistance at 49.00. Support lies at 47.10 and then the March low of 46.50. Like Brent, a break of the latter level could see another stampede for the exit.
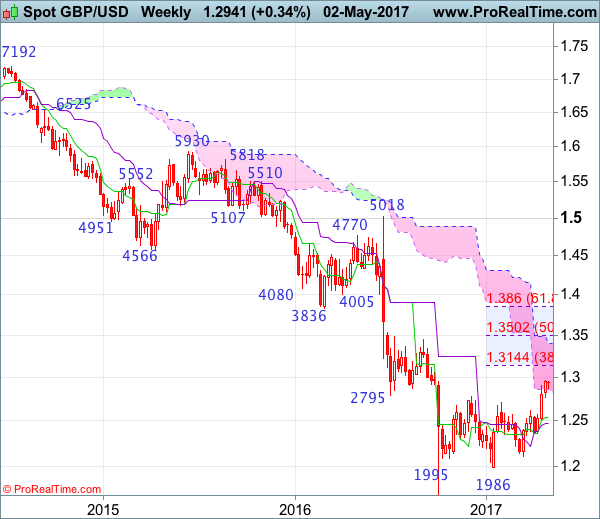
GBP/USD Candlesticks and Ichimoku Analysis
Weekly
• Last Candlesticks pattern: Long white candlestick
• Time of formation: 16 Jan 2017
• Trend bias: Down
Daily
• Last Candlesticks pattern: Long white candlestick
• Time of formation: 18 Apr 2017
• Trend bias: Near term up
GBP/USD – 1.2906
Although cable has continued moving higher after last week’s gap-up opening and bullishness remains for the erratic rise from 1.1986 low (Jan low) to bring retracement of early downtrend to 1.3000 psychological resistance, loss of near term upward momentum should prevent sharp move beyond 1.3090-00 and reckon 1.3140-50 (38.2% Fibonacci retracement of 1.5018-1.1986) would hold on first testing, risk from there is seen for a retreat to take place later.
On the downside, whilst initial pullback to 1..2860-65 and possibly support at 1.2757 is likely, reckon downside would be limited to 1.2700-10 and bring another rise later to aforesaid upside targets. A daily close below the Kijun-Sen (now at 1.2665) would suggest top is possibly formed instead, risk correction to previous resistance at 1.2616 but downside should be limited to 1.2575 and price should stay well above 1.2500, bring another rally later.
Recommendation: Buy at 1.2710 for 1.2910 with stop below 1.2610.
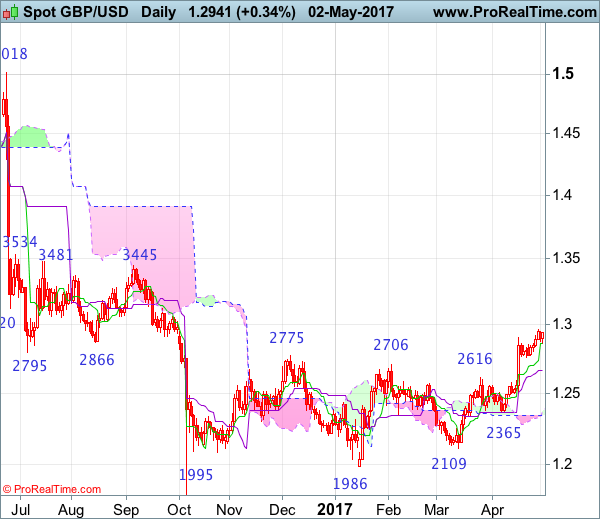
On the weekly chart, as cable has maintained a firm undertone after recent rally above resistance at 1.2775, adding credence to our bullish view that the erratic rise from this year’s low at 1.1986 has resumed and near term upside bias remains for this rise to bring retracement of early decline and gain to psychological resistance at 1.3000, however, reckon upside would be limited to 1.3090-00 and price should falter well below 1.3140-50 (38.2% Fibonacci retracement of 1.5018-1.1986), bring retreat later.
On the downside, although initial pullback to 1.2850 and 1.2800 cannot be ruled out, reckon downside would be limited to another previous resistance at 1.2706 and bring another rise later. Below 1.2640-50 would risk test of previous resistance at 1.2616, break there would defer and suggest top is possibly formed, bring weakness to 1.2550-60 but last week’s low at 1.2515 should hold, bring another rise later. Only a drop below 1.2500 would abort and signal top is formed instead, then test of the Kijun-Sen (now at 1.2476) would follow but support at 1.2365 should remain intact.
Australia’s Services Sector Expanded Further In April
For the 24 hours to 23:00 GMT, the AUD rose 0.16% against the USD and closed at 0.7538.
LME Copper prices rose 1.0% or $58.0/MT to $5746.5/MT. Aluminium prices declined 1.1% or $21.0/MT to $1909.0/MT.
In the Asian session, at GMT0300, the pair is trading at 0.7517, with the AUD trading 0.28% lower against the USD from yesterday's close.
Overnight data indicated that Australia's AiG performance of services index advanced to a level of 53.0 in April, after recording a level of 51.7 in the previous month.
The pair is expected to find support at 0.7498, and a fall through could take it to the next support level of 0.7478. The pair is expected to find its first resistance at 0.7546, and a rise through could take it to the next resistance level of 0.7574.
Looking ahead, a speech by the Reserve Bank of Australia's (RBA) Governor, Philip Lowe along with Australia's trade balance figures and HIA new home sales data, both for March, slated to release tomorrow, will be on investors' radar.
The currency pair is trading below its 20 Hr moving average and showing convergence with its 50 Hr moving average.

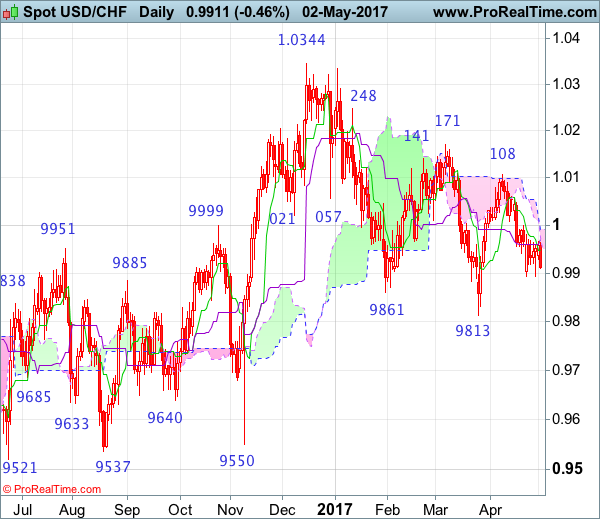
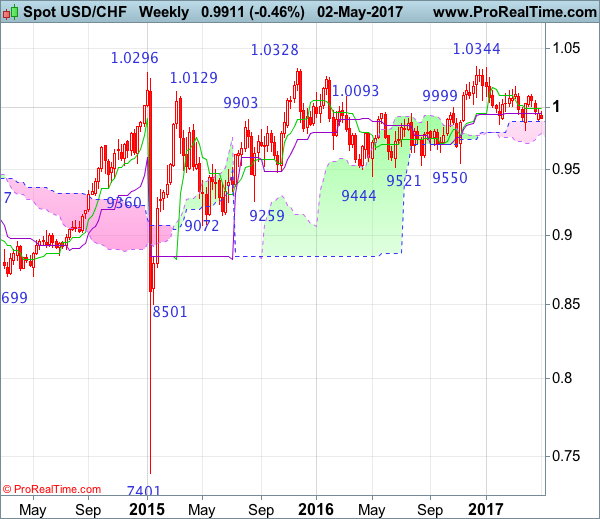
USD/CHF Candlesticks and Ichimoku Analysis
Weekly
• Last Candlesticks pattern: Doji
• Time of formation: 26 Sep 2016
• Trend bias: Sideways
Daily
• Last Candlesticks pattern: Shooting star
• Time of formation: 25 Oct 2016
• Trend bias: Near term up
USD/CHF – 0.9978
As the greenback found support at 0.9893 after opening lower last week and recovered, suggesting consolidation above this level would be seen, however, reckon resistance at 1.0000-08 would limit upside and bring another decline later, below said support at 09893 would signal the rebound from 0.9813 has ended bring another fall to this level. Looking ahead, only a drop below said support at 0.9813 would revive bearishness and signal the decline from 1.0344 top has resumed instead and extend further fall to 0.9735-40 (76.4% retracement of 0.9550-1.0344) and later towards 0.9700 but reckon 0.9650-60 would hold.
On the upside, a daily close above said resistance at 1.0000-08 would suggest a temporary low is formed, then gain to 1.0025-30 (61.8% Fibonacci retracement of 1.0108-0.9893) would be seen, however, break of 1.0067 is needed to retain bullishness and signal the retreat from 1.0108 has ended, bring retest of this level later, break there would extend the rebound from 0.9813 towards key resistance at 1.0171. Looking ahead, only a sustained breach above this level would add credence to our view that the erratic decline from 1.0344 top has ended at 0.9813, bring further rise to 1.0200-10, then 1.0250 but price should falter well below said resistance at 1.0344 (2016 high).
Recommendation: Hold long entered at 0.9990 for 1.0190 with stop below 0.9890.
On the weekly chart, as the greenback continued finding support at 0.9893, retaining our view that further consolidation would be seen and still reckon the upper Kumo (now at 0.9886) would limit downside, bring rebound later to the Tenkan-Sen (now at 0.9992) but break of resistance at 1.0067 is needed to retain bullishness and signal the retreat from 1.0108 has ended, bring retest of this level. A break above 1.0108 would extend the rebound from 0.9813 to resistance at 1.0171, however, a weekly close above this level is needed to confirm the fall from 1.0344 top has ended at 0.9813, bring further subsequent rise towards key resistance at 1.0248. A sustained breach above this level would signal early upmove has possibly resumed, bring test of 1.0335-44 resistance area, above there would provide confirmation and headway to 1.0400-10 and later 1.0500 would follow.
On the downside, below the upper Kumo (now at 0.9886) would defer but only break of indicated support at 0.9813 would abort and signal the erratic fall from 1.0344 top is still in progress, bring further decline for retracement of early upmove to 0.9735-40, then 0.9700 but reckon downside would be limited to 0.9640-50 and price should stay well above support at 0.9550.
Euro-Zone’s Unemployment Rate Remained Steady At Its Lowest Level Since April 2009 In March
For the 24 hours to 23:00 GMT, the EUR rose 0.18% against the USD and closed at 1.0929, after growth in the Euro-zone's manufacturing sector was confirmed at a six-year high level of 56.7 in April. However, the PMI was revised slightly lower from a preliminary print of 56.8. In the previous month, the PMI had registered a level of 56.2. Meanwhile, the region's unemployment rate surprisingly remained steady at an eight-year low level of 9.5% in March, against market expectation for a fall to a level of 9.4%.
Separately, Germany's final Markit manufacturing PMI eased to a level of 58.2 in April, confirming the flash estimates. In the previous month, the PMI had registered a reading of 58.3.
In the Asian session, at GMT0300, the pair is trading at 1.0933, with the EUR trading a tad higher against the USD from yesterday's close.
The pair is expected to find support at 1.0901, and a fall through could take it to the next support level of 1.0868. The pair is expected to find its first resistance at 1.0951, and a rise through could take it to the next resistance level of 1.0968.
Moving ahead, market participants will draw their attention to the Euro-zone's 1Q GDP figures and Germany's unemployment rate data for April, scheduled to release in a few hours. Later today, all eyes would be on the release of the latest Federal Reserve monetary policy meeting, wherein investors would be keen to get hints on the timing of the next interest rate hike. Additionally, in the US, ADP's jobs report, ISM non-manufacturing PMI and final Markit services PMI, all for April, will keep investors on their toes.
The currency pair is trading above its 20 Hr and 50 Hr moving averages.

UK’s Manufacturing Sector Growth At A 3-Year High Level In April
For the 24 hours to 23:00 GMT, the GBP rose 0.3% against the USD and closed at 1.2936, after Britain's manufacturing sector surprised with a robust performance in April.
The Markit manufacturing PMI in UK unexpectedly jumped to a level of 57.3 in April, expanding at its quickest pace in three years, buoyed by strong global demand, thus painting a largely bright picture of the economy and tempering worries about a Brexit-driven economic slowdown. The PMI had registered a reading of 54.2 in the previous month, while market participants had envisaged for a drop to a level of 54.0
In the Asian session, at GMT0300, the pair is trading at 1.2941, with the GBP trading slightly higher against the USD from yesterday's close.
Overnight data indicated that the nation's BRC shop price index fell 0.5% on an annual basis in April, meeting market expectations and following a drop of 0.8% in the prior month.
The pair is expected to find support at 1.2885, and a fall through could take it to the next support level of 1.2829. The pair is expected to find its first resistance at 1.2973, and a rise through could take it to the next resistance level of 1.3005.
Moving ahead, market participants await the release of UK's Markit construction PMI for April, set to release in a few hours.
The currency pair is trading above its 20 Hr and 50 Hr moving averages.

Japanese Yen Trading On A Weaker Footing This Morning
For the 24 hours to 23:00 GMT, the USD rose 0.11% against the JPY and closed at 111.97.
In the Asian session, at GMT0300, the pair is trading at 112.04, with the USD trading 0.06% higher against the JPY from yesterday’s close.
The pair is expected to find support at 111.80, and a fall through could take it to the next support level of 111.56. The pair is expected to find its first resistance at 112.29, and a rise through could take it to the next resistance level of 112.54.
On account of a holiday observed in Japan today, investors will look forward to global events for further direction in Yen.
The currency pair is showing convergence with its 20 Hr moving average and trading above its 50 Hr moving average.

Swiss SVME–PMI Fell More-Than-Expected In April
For the 24 hours to 23:00 GMT, the USD declined 0.42% against the CHF and closed at 0.9913.
On the data front, Switzerland's SVME–purchasing managers' index (PMI) declined more-than-anticipated to a level of 57.4 in April, compared to a level of 58.6 in the previous month, whereas markets anticipated for a fall to a level of 58.2.
In the Asian session, at GMT0300, the pair is trading at 0.9911, with the USD trading slightly lower against the CHF from yesterday's close.
The pair is expected to find support at 0.9891, and a fall through could take it to the next support level of 0.987. The pair is expected to find its first resistance at 0.9947, and a rise through could take it to the next resistance level of 0.9982.
The currency pair is trading below its 20 Hr and 50 Hr moving averages.

Loonie Trading Lower In The Morning Session
For the 24 hours to 23:00 GMT, the USD rose 0.23% against the CAD and closed at 1.3704.
In the Asian session, at GMT0300, the pair is trading at 1.3718, with the USD trading 0.1% higher against the CAD from yesterday’s close.
The pair is expected to find support at 1.3658, and a fall through could take it to the next support level of 1.3597. The pair is expected to find its first resistance at 1.3768, and a rise through could take it to the next resistance level of 1.3817.
With no economic releases in Canada today, investor sentiment would be governed by global macroeconomic news.
The currency pair is trading above its 20 Hr and 50 Hr moving averages.

Daily Technical Analysis: EUR/USD Setups Consolidation Zone Break Aiming For 1.10
Currency pair EUR/USD
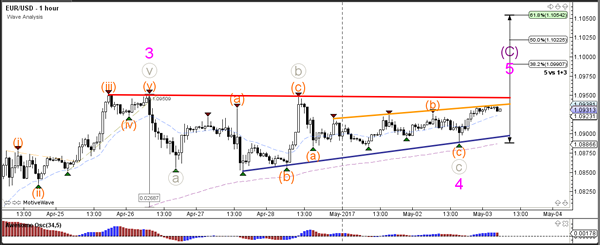
The EUR/USD remains in a consolidation pattern which is indicated by the support (blue) and resistance (red) trend lines. A bullish break could indicate a potential uptrend continuation towards the 78.6% Fibonacci level of wave 2 (green) whereas a bearish break could start a reversal and indicate the completion of the ABC zigzag (purple).
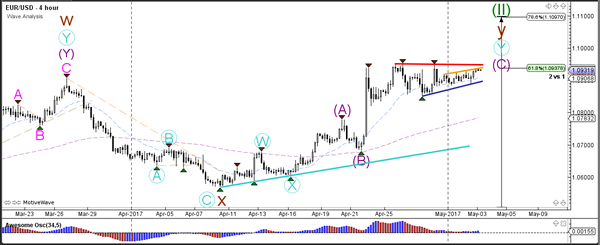
The EUR/USD sideways zone is probably making a wave 4 (pink) correction rather than a reversal. The next targets are the psychological even level at 1.10 and the 61.8% Fib target at 1.1050.
Currency pair GBP/USD
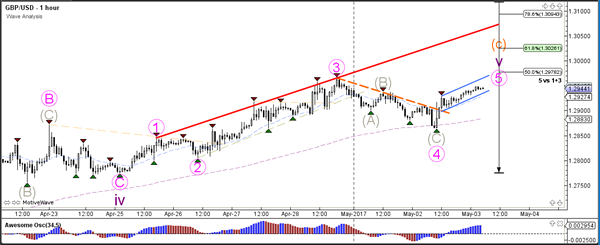
The GBP/USD is continuing with the bullish trend which is indicated by the support trend lines (blue). The 1.30 level could act as resistance too due to the importance of round levels in technical analysis. A break above it could see price extend towards the Fibonacci targets.
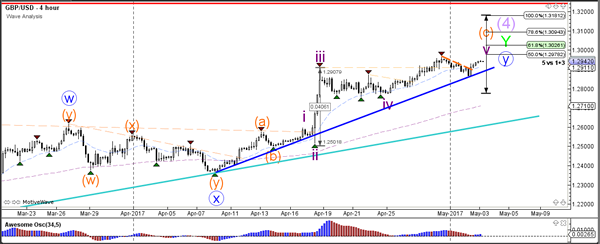
The GBP/USD is building a smaller bullish channel (blue lines) after breaking above the resistance trend line (dotted orange).
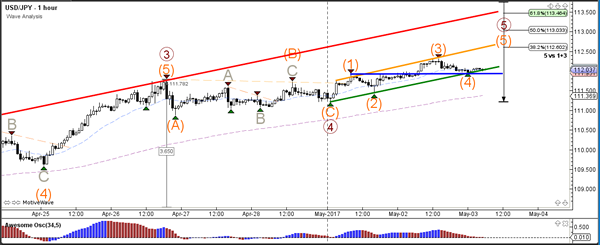
Currency pair USD/JPY
The USD/JPY is in an uptrend channel which is indicated by the trend lines. Price could move up towards the Fibonacci targets of wave 5 (brown). The channel could break bearishly once the 5th wave (brown) is completed.
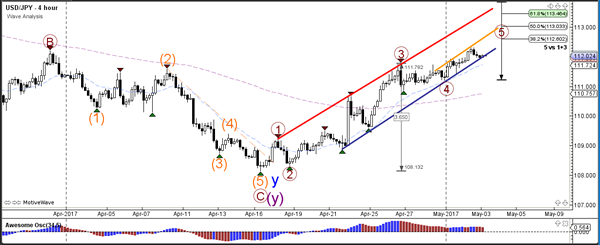
The USD/JPY is probably still in a 5th wave (orange) of a 5th wave (brown) as long as price stays above the support zone (green/blue).