
Sample Category Title
European Open Briefing: Flows Were Light In The Asian Session
Global Markets:
- Asian stock markets: Shanghai Composite down 0.35 %, ASX 200 lost 1.00 %, Nikkei and Hang Seng closed for holiday
- Commodities: Gold at $1257 (+0.05 %), Silver at $16.91 (+0.50 %), WTI Oil at $48.10 (+0.85 %), Brent Oil at $50.95 (+1.00 %)
- Rates: US 10-year yield at 2.29, UK 10-year yield at 1.09, German 10-year yield at 0.32
News & Data
- Australian AIG Services Index Apr: 53.0 (prev 51.7)
- New Zealand Employment Change (QoQ) Q1: 1.2% (exp 0.8%; prev 0.8%; rev prev 0.7%)
- New Zealand (YoY) Q1: 5.7% (exp 5.3%; prev 5.8%)
- New Zealand Unemployment Rate Q1: 4.9% (exp 5.1%; prev 5.2%)
- New Zealand Participation Rate Q1: 70.6% (exp 70.5%; prev 70.5%)
- PBoC Fixes USDCNY Reference Rate At 6.8892 (prev fix 6.8946 prev close 6.8965)
- Asia stocks ride global momentum, dollar up on June Fed rate hike bets – RTRS
- Oil rebounds on U.S. stocks drawdown, declining OPEC compliance weighs – RTRS
Markets Update:
Flows were light in the Asian session, as Japanese and Hong Kong markets were closed. Meanwhile, Chinese and Australian stock markets declined.
In FX, the New Zealand Dollar rose after stronger than expected employment data. The unemployment rate fell from 5.2 % to 4.9 %. NZD/USD rose from 0.6930 to 0.6970. A break above 0.6980 resistance would suggest that the currency pair is likely to recover further. The next notable resistance level then lies at 0.7050.
The Australian Dollar failed to follow the NZD higher. AUD/USD fell from 0.7545 to 0.7505, and some pressure came also from AUD/NZD selling.
The US central bank will decide on interest rates today. No changes are expected, and it is unlikely that there will be a surprise. There will be no press conference for today, but the FOMC will release a statement at 19:00 BST.
Upcoming Events:
- 08:55 BST – German Unemployment Rate
- 08:55 BST – German Unemployment Change
- 09:30 BST – UK Construction PMI
- 10:00 BST – Euro Zone GDP
- 13:15 BST – US ADP Nonfarm Employment Change
- 14:45 BST – US Services PMI
- 15:00 BST – US ISM Non-Manufacturing PMI
- 15:30 BST – US Crude Oil Inventories
- 19:00 BST – Federal Reserve Rate Decision
- 19:00 BST – FOMC Statement
Daily Technical Outlook And Review: EUR/USD, GBP/USD, AUD/USD, USD/JPY, USD/CAD, USD/CHF, DOW 30, GOLD
A note on lower timeframe confirming price action...
Waiting for lower timeframe confirmation is our main tool to confirm strength within higher timeframe zones, and has really been the key to our trading success. It takes a little time to understand the subtle nuances, however, as each trade is never the same, but once you master the rhythm so to speak, you will be saved from countless unnecessary losing trades. The following is a list of what we look for:
- A break/retest of supply or demand dependent on which way you're trading.
- A trendline break/retest.
- Buying/selling tails ... essentially we look for a cluster of very obvious spikes off of lower timeframe support and resistance levels within the higher timeframe zone.
- Candlestick patterns. We tend to only stick with pin bars and engulfing bars as these have proven to be the most effective.
EUR/USD
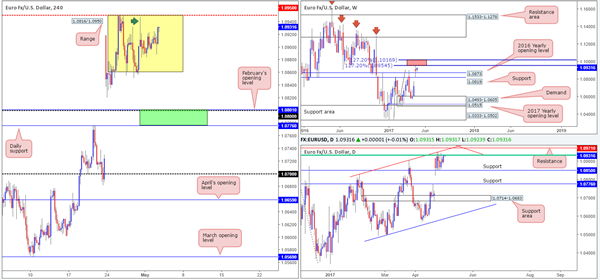
The EUR/USD, as you can see, remains somewhat muted as the major continues to trade within a H4 consolidation fixed between 1.0816/1.0950. Of particular interest here, however, is the long wick seen formed on the 28th April at 1.0947 (green arrow). This candle's extreme has potentially consumed a large amount of offers within the current range, which could see price approach the upper edge of this box sometime today.
Now, 1.0950 on its own would not be a high-probability location to short from, as momentum has been firmly positioned to the upside since early April. Nevertheless, when coupled with a daily 61.8% Fib resistance at 1.0932 (green line), a nearby daily resistance pegged at 1.0971 and a weekly 127.2% Fib extension at 1.0954 (taken from the lows 1.0340), the technical story shifts in favor of the bears!
Our suggestions: Watch for H4 price to form a reasonably sized bearish candle between 1.0971/1.0950 (preferably a full-bodied candle). Should this come to fruition, then not only is a move back into the H4 consolidation possible, but a trade short on the back of this is as well.
Data points to consider: US ADP non-farm employment change at 1.15pm, ISM non-manufacturing PMI at 3pm and the FOMC's monetary policy decision at 7pm GMT+1.
Levels to watch/live orders:
- Buys: Flat (stop loss: N/A).
- Sells: 1.0971/1.0950 ([waiting for a reasonably sized H4 bear candle to form before pulling the trigger is advised] stop loss: ideally beyond the candle's wick).
GBP/USD
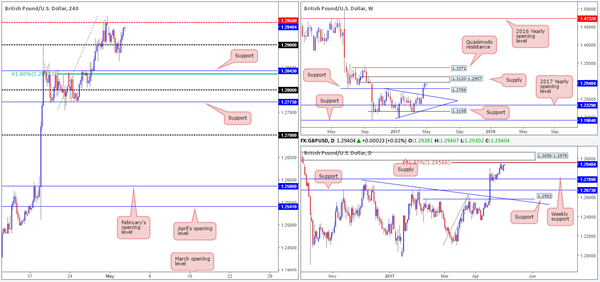
Better-than-expected UK manufacturing PMI figures helped provide support around the 1.2883 neighborhood amid London's morning trade yesterday. As a result of this, the market reclaimed the 1.29 handle and popped to a high of 1.2939 by the closing bell. Although this recent advance managed to erase all of Monday's losses as well as print a healthy full-bodied daily bull candle, it's still a challenging pair to buy at the moment. Not only do we have a nearby 161.8% daily Fib extension at 1.2956 (drawn from the low 1.2108) and daily supply carved from 1.3058-1.2979, there's also a weekly supply at 1.3120-1.2957 currently in motion.
Our suggestions: So, if structure suggests shorting, where does one consider selling from? Well, the first level that springs to mind is the most obvious: the H4 mid-level resistance at 1.2950 since it managed to cap upside on Friday. Our next port of call would be the large psychological band seen at 1.30.
Both levels, in our estimation, have equal chance of holding price given higher-timeframe structure. To be on the safe side though, we would not recommend placing pending orders here. Instead, watch how the H4 candles behave once price connects with the said levels. Assuming a reasonably sized H4 bearish candle forms (a full-bodied candle would be attractive), we'd consider selling this market.
Data points to consider: UK construction PMI at 9.30am. US ADP non-farm employment change at 1.15pm, ISM non-manufacturing PMI at 3pm and the FOMC's monetary policy decision at 7pm GMT+1.
Levels to watch/live orders:
- Buys: Flat (stop loss: N/A).
- Sells: 1.2950 region ([waiting for a reasonably sized H4 bear candle to form before pulling the trigger is advised] stop loss: ideally beyond the candle's wick). 1.30 area ([waiting for a reasonably sized H4 bear candle to form before pulling the trigger is advised] stop loss: ideally beyond the candle's wick).
AUD/USD
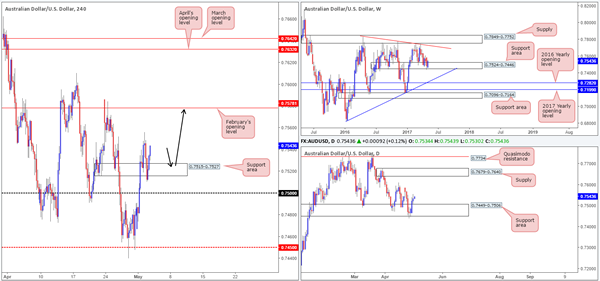
Aussie bulls managed to print their third consecutive daily gain yesterday, reaching highs of 0.7556 on the day. The H4 support area at 0.7515-0.7527 has managed to remain intact, despite suffering a breach going into the US segment. Owing to weekly bulls continuing to defend the support area at 0.7524-0.7446, we still believe that the H4 candles want to test February's opening level at 0.7578. Be that as it may, to take advantage of this move, the only viable setup we see right now is a retest of the said H4 support area (as per the black arrows).
Our suggestions: In the event that a retest of the H4 zone is seen and a reasonably sized H4 bull candle presents itself (a full-bodied candle would be ideal), a long from this region, with a target objective of 0.7578, could be something to consider.
Data points to consider: US ADP non-farm employment change at 1.15pm, ISM non-manufacturing PMI at 3pm and the FOMC's monetary policy decision at 7pm GMT+1.
Levels to watch/live orders:
- Buys: 0.7515-0.7527 ([waiting for a reasonably sized H4 bull candle to form before pulling the trigger is advised] stop loss: ideally beyond the candle's tail).
- Sells: Flat (stop loss: N/A).
USD/JPY
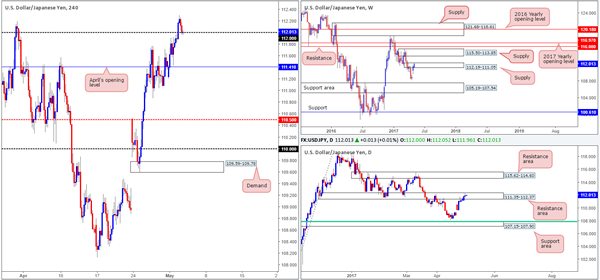
In recent sessions, we can see that the H4 candles cleared the 112 handle during the early hours of London and then went on to retest it as support going into the US afternoon session. While a long from this level could be an option, it might be worth noting the bigger picture. Weekly price is currently seen trading within the upper limits of a supply formed from 112.19-111.05, and daily action has been interacting with a resistance zone coming in at 111.35-112.37 since last Wednesday.
Therefore, instead of looking to buy from 112 today, we are going to be watching for 112 to give way. This could, according to our technicals, open up the path south down to April's opening level at 111.41 and quite possibly the 111 handle.
Our suggestions: A H4 close beyond 112 followed up with a retest and a reasonably sized H4 bearish (preferably full-bodied) candle would, in our humble opinion, be enough evidence to suggest the bears are in control and shorts are now viable.
Data points to consider: US ADP non-farm employment change at 1.15pm, ISM non-manufacturing PMI at 3pm and the FOMC's monetary policy decision at 7pm GMT+1.
Levels to watch/live orders:
- Buys: Flat (stop loss: N/A).
- Sells: Watch for H4 price to close below 112 and then look to trade any retest seen thereafter ([waiting for a reasonably sized H4 bearish candle to form following the retest is advised] stop loss: ideally beyond the candle's wick).
USD/CAD
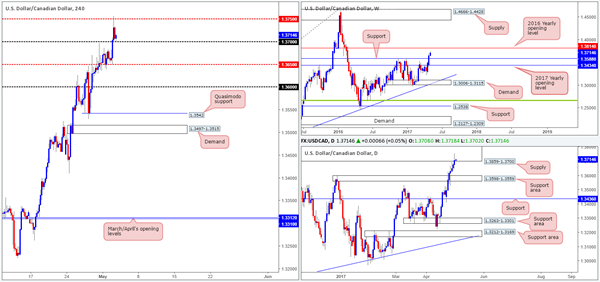
With oil prices softening yesterday, the USD/CAD pair rallied higher. H4 price easily cleared the 1.37 handle and went on to challenge the mid-level resistance 1.3750, which, as you can see, held firm. Although daily buyers printed their eighth consecutive bullish candle yesterday, our team remains somewhat biased to the downside. Our reasoning lies within the higher-timeframe structures. Daily price has recently checked in with a supply zone penciled in at 1.3859-1.3700. And weekly flow looks poised to attack the 2016 yearly opening level at 1.3814, which sits nicely within the upper limits of the said daily supply.
Our suggestions: To our way of seeing things, entering long (medium/long term) is not a viable option at present. Shorts on the other hand, are. However, given our conservative nature, we would not be looking to commit until price has connected with the above noted 2016 yearly opening level (essentially around the 1.38 region). The reason being is that it's firmly positioned within the said daily supply, thus allowing the trader to conservatively place stops above this area.
Data points to consider: US ADP non-farm employment change at 1.15pm, ISM non-manufacturing PMI at 3pm and the FOMC's monetary policy decision at 7pm GMT+1.
Levels to watch/live orders:
- Buys: Flat (stop loss: N/A).
- Sells: 1.3814/1.38 region is an ideal place for shorts since this area requires no additional confirmation (stop loss: conservative at 1.3861).
USD/CHF
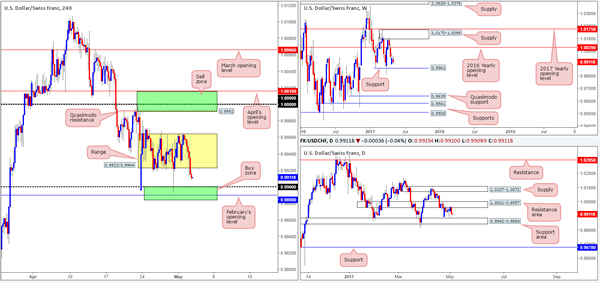
As can be seen from the H4 chart this morning, price breached and eventually closed beyond the lower edge of the consolidation fixed between 0.9923/0.9964. Consequent to this, the H4 buy zone seen marked in green at 0.9884/0.99 is now in view. Comprised of the 0.99 handle, February's opening level at 0.9890 and the top edge of a daily support area at 0.9842-0.9884, this zone could potentially bounce price today as it did last Friday.
Our suggestions: The only grumble we would have if we were to take a long from the said H4 area is the fact that weekly price could potentially push the market lower to shake hands with support at 0.9861. As such, we are advising traders not to trade the above said zone blindly! Wait for additional confirmation either in the form of a H4 candle (preferably a full-bodied candle) or a lower-timeframe buy signal (see the top of this report).
Data points to consider: US ADP non-farm employment change at 1.15pm, ISM non-manufacturing PMI at 3pm and the FOMC's monetary policy decision at 7pm GMT+1.
Levels to watch/live orders:
- Buys: 0.9884/0.99 ([waiting for a reasonably sized H4 bull candle to form before pulling the trigger is advised] stop loss: ideally beyond the candle's tail).
- Sells: Flat (stop loss: N/A).
DOW 30
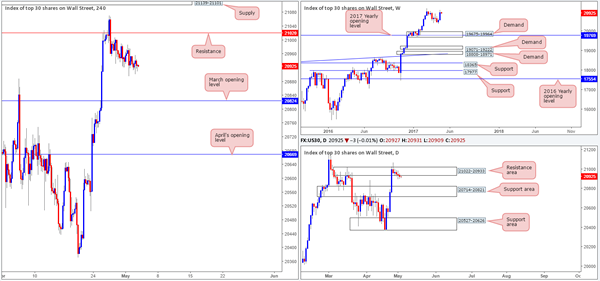
This market has been as monotonous as watching paint dry since H4 price whipsawed through resistance at 21020. While the market continues to grind lower, albeit as slow as a snail, the next support target on tap from here is not seen in view until March's opening level at 20824.
As highlighted in previous reports, the noted monthly level is positioned above the daily support area at 20714-20821 (the next downside target on that timeframe).With daily price currently trading from a resistance area at 21022-20933, there's a good chance that price may reach the above noted daily support area. However, up on the weekly candles, price still looks poised to continue marching higher!
Our suggestions: Ultimately, our team's bias is long. However, we're finding it difficult to pin down a setup given the only support present is March's opening level seen on the H4 chart. Therefore, unless new H4 structure forms at current price or we see a decline down to 20824, we will continue to remain flat.
Data points to consider: US ADP non-farm employment change at 1.15pm, ISM non-manufacturing PMI at 3pm and the FOMC's monetary policy decision at 7pm GMT+1.
Levels to watch/live orders:
- Buys: 20824 looks an interesting level for longs. However, we would require a H4 bullish candle to present itself here (preferably a full-bodied candle) before committing (stop loss: ideally beyond the candle's tail).
- Sells: Flat (stop loss: N/A).
GOLD
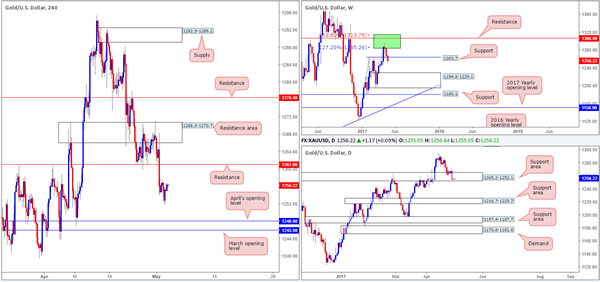
Gold prices are effectively unchanged this morning. The metal continues to loiter around the lower edge of the daily support area seen at 1265.2-1252.1, while weekly bears continue to hold price below support at 1263.7. Although weekly flow suggests further selling could be on the cards, it would be a chancy move to sell seeing where daily price is currently positioned!
Moving across to the H4 candles, the unit remains trading between resistance drawn from 1261.0 and April's opening base line at 1248.0/March's opening base line at 1245.9.
Our suggestions: Should H4 price retest 1261.0 as resistance today and hold, we may, given the technical picture on the weekly chart, think about selling. Of course, the only grumble here is that daily price remains within a support zone (see above). Therefore, we would not consider shorts from 1261.0 UNLESS a reasonably sized H4 bearish candle forms off this line, preferably a full-bodied candle.
Levels to watch/live orders:
- Buys: Flat (stop loss: N/A).
- Sells: 1261.0 region ([waiting for a reasonably sized H4 bear candle to form before pulling the trigger is advised] stop loss: ideally beyond the candle's wick).
Elliott Wave View: NZDUSD Correction In Progress
Short term Elliott Wave view in NZDUSD suggests the decline to 0.6844 low ended cycle from 3/21 high in Minor wave W. Pair is currently correcting cycle from 3/21 high in 7 or 11 swing in Minor wave X before the decline resumes. The rally from 4/27 low (0.6844) is unfolding as a double three Elliott Wave structure where Minute wave ((w)) ended at 0.6937 as a Flat Elliott wave structure , and Minute wave ((x)) pullback ended at 0.69. Near term, pair is correcting cycle from 0.69 low within Minutte wave (b) and while dips stay above there, expect pair to resume higher towards 0.699 – 0.7014 area before the decline resumes. We expect Minor wave X rally to find sellers at 0.699 – 0.705 area for an extension lower or at least a 3 waves pullback as far as pivot at 0.709 high remains intact.
NZDUSD 1 hour Elliott Wave Chart
Market Morning Briefing: The Markets Wait For The FOMC Comments Tonight
STOCKS
The Japanese markets are closed today. All other major markets are trading very quietly, mostly waiting for the FOMC comments due tonight and the second round of the French Presidential election on Sunday.
Dow (20949.89, +0.17%) has been stuck in a very narrow range of 20900-21070 for the last 6 sessions but the underlying bullishness can push the index higher towards the resistance of 21400 in the next few days.
Dax (12507.90, +0.56%) has broken into new ground this week as it trades above the 2015 high of 12390. The current rise may extend to 12600-700 before the next bout of profit booking comes.
Shanghai (3140.04, -0.12%) keeps trading in the range of 3100-3180 in line with expectations with 3100 standing firm as a major support. The sideways oscillation may keep the index in this range for the rest of the week and a directional move may be seen next week only.
Nifty (9313.80, +0.10%) has been stalling near the resistance area of 9370-9430 for the last 5 sessions with increasing risk of a correction in the medium term. While 9430 may be tested in the near term, keep any eye for a probable selloff from that area.
COMMODITIES
Muted price action had been seen in Gold (1257) as market is waiting for today's FOMC statement and FED fund rate announcement at 11.30 P.M IST.Immediate support is at 1239. Buyers will take every dip as a further opportunity for buying while it is trading above 1239. A close above 1264 could open up 1285, which could be a level where the price action has to be checked to assess the chances of further bounce to 1305.
Silver (16.78) is Oversold on the near-term charts and trading within the range of 16.50-17.02.The bias will remain bearish while it is trading below 17.50 levels.
Copper (2.61) has shown some strength as it manages to trade above its crucial support at 2.57. Recent trading range could be 2.60-2.69 and upon 2.69, higher resistances of 2.72 -80 can come into consideration.
Brent (51.73) and WTI (48.03) both had moved lower in line with our expectation. They are within their trading ranges of 50 -52. and 46.20 – 48.80 respectively. Brent may consolidate within these levels for few more sessions though the possibility of a corrective bounce towards resistance can’t be ruled out.Today we have U.S Crude inventory at 8.00 P.M IST with an expectation of a decrease of 3.3M barrel, which could be supportive for oil prices. But we will remain bearish while Brent and WTI are trading below 53 and 51 levels respectively.
FOREX
The markets wait for the FOMC comments tonight and the US jobs data on Friday to provide clues for the near term direction of Dollar. Euro and Pound remains the strongest majors with further upside possibilities emerging.
No change in the technical state for either Dollar Index (98.93) or Euro (1.0934) yet as Euro refuses to yield ground even after the initial rejection from the resistance of 1.0950-60. Coupled with the inability of Dollar to rise above the immediate resistance of 99.35-50, the chances of Euro rising past 1.0960 towards 1.10 and higher are increasing instead of the expected correction towards 1.08. In that case, Dollar may retest the major support of 98.50-00.
Dollar-Yen (112.03) has traded in the range of 111-112 for the last 2 sessions as expected but the bulls may be anxious with the proximity of the resistance of 112.30 and 112.90. From any of these resistances, a correction towards 111.00-110.50 can be expected in the next few sessions.
Pound (1.2943) is gathering fresh steam every passing session as it gets closer to our initial target of 1.3000 and now not only 1.3150 comes into consideration, even 1.3350-1.3400 may be not out of question in the coming days.
Aussie (0.7518) has shot above the immediate target of 0.7500 and now needs a break above 0.7560 to extend the rise towards 0.7600-75. Till the break comes, it may consolidate in the range of 0.7450-0.7550.
Dollar-Rupee (64.2125) ended the first session of the month in the range of 63.95-64.35 as expected. The horizontal trading in this range is expected to continue for another couple of sessions as the FOMC meet may not trigger a lot of activity in the markets.
INTEREST RATES
The US yields are range bound before FED rate announcement. The 2Yr (1.26%),5Yr (1.8%), 10YR (2.28%) and the 30YR (2.97%) are all down by 3-4 bps.
The US T Bond 10-5 Yr Short term Yld Spread (0.485) may find resistance at current levels and could come down towards 0.46-0.45 levels.
EUR/AUD Resistance Zone For Shorters
Hump day and we're all about the currency crosses!
Take a look at this clear higher time frame resistance on the daily:
EUR/AUD Daily:
I've drawn this as a single line, but just by looking at the level, you can see it's much more of a zone.
Either way, it's obviously resistance and it's obviously holding.
Lets now zoom into the hourly:
EUR/AUD Hourly:
After the higher time frame rejection, we now look for an opportunity to get short and as always, it's pullbacks into previous short term support turned possible resistance that we're looking to use to enter.
Of course stops will sit above the higher time frame level for conservative traders.
Remember this EUR/AUD long setup from back in January? Yes it's inverted, but does it look familiar?
UP Down Turnaround
Up Down Turnaround
Global markets returned from various Mayday celebrations with a risk-friendly spring in their step and were rewarded as equities were buoyed by good US earnings results and had another run at making all all-time highs before retreating slightly. For the most part, markets continue to trade in tight ranges ahead of FOMC, NFP and the French elections later this week.The US dollar storylines remain numerous and shifting sentiment continues to pull the greenback in every which direction.
Japanese Yen
Price action in the US bond market with 30-year yields topping 3.02% saw USDJPY touch 112.30 before the 30-year yields faded post-Mnuchin's long end supply headlines after April US car sales plummeted. Supporting the headline USDJPY, there has been a focus on the EURJPY which broke its trendline resistance at 122.20/25. With French election surprise very unlikely, we could see a push higher on EURJPY which will underpin USDJPY. Overall, the headlining pair remains positioned for a move higher, and with equities and risk trading well, we should expect dips to stay supported.
As for trading tonight, FOMC should provide some interest but will offer little in the way of a surprise with the market more focused on the language surrounding June. Overall, I suspect traders are looking past tonight's release, preferring to focus on Friday's NFP as one of the key barometers for the Fed June rate hike.
Australian Dollar
Making 'Cents' of the Aussie dollar moves can be challenging at times, even more so with typical short-term indicators becoming notoriously unreliable, so we take what the market gives us and trudge on.
AUDUSD has been in the limelight post-RBA after the bank held base rates steady. Lately, expectations had shifted slightly to the dovish side expecting that the balance of likelihoods may see a cut as the next move from the bank rather than a hike. The RBA is sounding a tad more upbeat while maintaining the constant theme of a glass half full approach to growth and underlying inflation, was enough to convince the market that chances for a rate cut are very unlikely and the AUD pressed to .7750.
Traders are keeping an eye on .7550-75 levels as there may be some more AUD shorts to get unwound in the days ahead. This could be aided by how well the cross JPY pairs are trading, underpinning the AUDUSD headline pair.
Aussie bulls continue to bank on a rebound in risk, commodity prices as the AUD pairs have continued to lag the moves in global equity prices.With risk rebounding, the interest rate picture a bit more clear and commodity prices apparently basing, we could see an extension of the current moves.
FRENCH ELECTION TIMELINE
May 5 – [from midnight] Poll blackout
May 7 – Second round of French presidential elections. Last polls close at 19:00 BST / 14:00 EDT, with an exit poll result announced immediately.
May 11 – Official proclamation of the new President.
May 14 – [from midnight] End of Francois Hollande's mandate
June 11 – First round of legislative elections
June 18 – Second round of legislative elections.
USD/CAD Canadian Dollar Lower After Oil Drop
The Canadian dollar is lower on Tuesday as mixed economic data and the fall in oil prices due to high supply expectations have depreciated the loonie to near 14 month lows. The woes of mortgage lender Home Capital could deflate the housing bubble even as the Canadian Finance Minister Bill Morneau plays down the links between Home Capital and overvalued assets in major cities.
Global think tanks and organizations such as the Organization for Economic Co-operation and Development (OECD), International Monetary Fund (IMF) and others had pointed out the disconnect between prices and value in Canadian real estate. The central bank had tried to push the message across with little success until first authorities in Vancouver instituted a foreign buyer tax that was replicated in Toronto last month.
The Bank of Canada (BoC) looks unlikely to change rates anytime soon and even though the U.S. Federal Reserve will probably hold in May, June is still in play for the US central bank. The BoC’s next move might be a rate cut if the economy doesn’t gather momentum this year. The change in rhetoric from US officials also hurt the loonie. Despite some rumoured assurances from high profile members of the Trump administration it is now alongside Mexico and China as targets of trade retaliation.
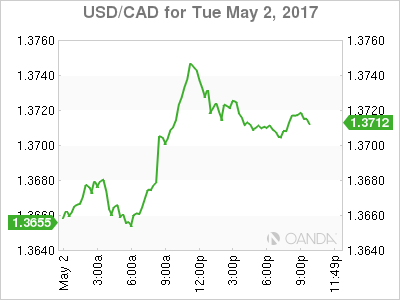
The USD/CAD gained 0.224 percent in the last 24 hours. The pair is trading at 1.3712 after oil prices depreciated the loonie versus the dollar. The Canadian currency is the worst performer against the USD. Even the Mexican peso which was the worst performer earlier this year as Trump’s rhetoric hit fever pitch is now stable. In a sense this is a catch up from the Trump effect the loonie was spared.
BoC Governor Stephen Poloz will be in Mexico City on Thursday where the topic of Nafta is sure to come up. US Commerce Secretary Wilbur Ross was speaking today about the trade agreement and he considers it his biggest priority to get the agreement on the right foot without starting a trade war.
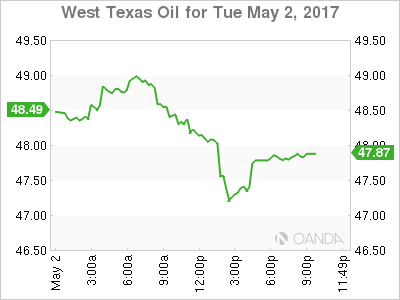
The price of oil lost 1.781 percent during the trading session. The price of West Texas is trading at $47.53 ahead of the US weekly crude inventories to be released on Wednesday, May 3 at 10:30 am EDT. The number of barrels in storage is expected to contract by 3.3 million but gasoline and distillate supplies are expected to climb as refineries are processing more but weak demand from consumers is still pressuring the price of oil.
The Organization of the Petroleum Exporting Countries (OPEC) managed to agree to a production cut deal last year that went into effect in 2017. Non-OPEC members such as Russia and Mexico joined but as the 6 month term of the deal nears the end, there is talk of an extension scheduled for May 25.
The rise in US oil production has offset the impact of the OPEC cuts on prices, but the underlying demand has not grown which poses a threat to energy producers around the world.
Market events to watch this week:
Wednesday, May 3
4:30am GBP Construction PMI
8:15am USD ADP Non-Farm Employment Change
10:00am USD ISM Non-Manufacturing PMI
10:30am USD Crude Oil Inventories
2:00pm USD FOMC Statement
USD Federal Funds Rate
9:30pm AUD Trade Balance
11:10pm AUD RBA Gov Lowe Speaks
Thursday, May 4
4:30am GBP Services PMI
8:30am CAD Trade Balance
USD Unemployment Claims
4:25pm CAD BOC Gov Poloz Speaks
9:30pm AUD RBA Monetary Policy Statement
11:00pm NZD Inflation Expectations q/q
Friday. May 5
8:30am CAD Employment Change
8:30am USD Average Hourly Earnings m/m
8:30am USD Non-Farm Employment Change
Fed To Hold As Trump Cuts Loose
Market to focus on Fed statement looking for June meeting clues
Central banks around the globe have kept on the sidelines as geopolitical risk clouds are still hovering above. The Federal Open Market Committee (FOMC) two-day meeting will end with the release of the policy statement on Wednesday, May 3 at 2:00 pm EDT. The central bank is not expected to raise interest rates with the CME's FedWatch tool showing a 95 percent probability of the range staying unchanged at 0.75 to 1 percent. Without a press conference by the Fed Chair or forecast updates the spotlight will shine solely on the text of the statement. Investors will be looking for insight into the FOMC meeting in June. The CME's Fed futures contract prices show a 67.4 percent probability of a hike on June 14.
The US dollar has been mixed against the majors ahead of the central bank statement. The greenback has advanced against the JPY, GBP and CAD but is lower against the NZD, AUD, EUR and CHF. The USD continues to get some support from the market anticipating language in the statement validating a rate hike in June. US fundamentals have been weaker in the first quarter but not enough to derail a rate hike. The Fed noticed ahead of its March meeting that the market was not pricing in a hike, so they turned up the rhetoric. It clear this year the Fed is not afraid to tip their hand if they think investors misunderstood their intentions.
Jobs data will also be released tomorrow with private payroll processor ADP releasing its non-farm employment change on Wednesday, May 3 at 8:15 am EDT. Job creation in the private sector has beat expectations since January, but the market has a conservative estimate of 178,000 which is inline with previous forecasts.
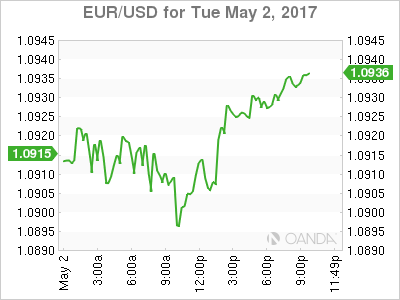
The EUR/USD gained 0.018 percent in the last 24 hours. The single pair is trading at 1.0908 after the first day of a two-day Federal Reserve rate setting meeting. Comments from U.S. President Donald Trump have kept the market on edge. Risk appetite had returned after a shutdown of the US government had been adverted thanks to a bipartisan vote, but Trump unhappy with the negotiations called for a shutdown in September as more republican votes would be needed.
The market impact of the US President's comments was not as big as yesterday's statements on his plans to break the big banks but it keeps the political risk high as his tactics intend to intimidate the Democrats into compliance.

The price of oil lost 1.781 percent during the trading session. The price of West Texas is trading at $47.53 ahead of the US weekly crude inventories to be released on Wednesday, May 3 at 10:30 am EDT. The number of barrels in storage is expected to contract by 3.3 million but gasoline and distillate supplies are expected to climb as refineries are processing more but weak demand from consumers is still pressuring the price of oil.
The Organization of the Petroleum Exporting Countries (OPEC) managed to agree to a production cut deal last year that went into effect in 2017. Non-OPEC members such as Russia and Mexico joined but as the 6 month term of the deal nears the end, there is talk of an extension scheduled for May 25.
The rise in US oil production has offset the impact of the OPEC cuts on prices, but the underlying demand has not grown which poses a threat to energy producers around the world.
Market events to watch this week:
Wednesday, May 3
4:30am GBP Construction PMI
8:15am USD ADP Non-Farm Employment Change
10:00am USD ISM Non-Manufacturing PMI
10:30am USD Crude Oil Inventories
2:00pm USD FOMC Statement
USD Federal Funds Rate
9:30pm AUD Trade Balance
11:10pm AUD RBA Gov Lowe Speaks
Thursday, May 4
4:30am GBP Services PMI
8:30am CAD Trade Balance
USD Unemployment Claims
4:25pm CAD BOC Gov Poloz Speaks
9:30pm AUD RBA Monetary Policy Statement
11:00pm NZD Inflation Expectations q/q
Friday. May 5
8:30am CAD Employment Change
8:30am USD Average Hourly Earnings m/m
8:30am USD Non-Farm Employment Change
Oil Adds To CAD Crunch
Another 2% fall in oil prices on Tuesday contributed to the eighth straight day of USD/CAD gains. The New Zealand dollar led the way while the Canadian dollar lagged again. New Zealand jobs data is up next. The Premium video, focusing on gold, yen, USD & euro is posted below for subscribers. New trades are out ahead of Wednesday's FOMC.
The combination of worries about the housing market and a slump in oil prices sent USD/CAD above 1.37 on Tuesday for the first time in 14 months. The pair touched as high as 1.3758 as oil prices fell below the uptrend that started in November.
Crude oil traders are concerned about more supply after Libya's rival governments announced peace talks. Libya is exempt from quotas and has hundreds of thousands of barrels of idled production that could add to the global glut.
The market also continues to watch the drama surrounding embattled Canadian lender Home Capital and a new foreign buyer tax. Together they're seen as a major test of the red-hot market.
With most of the bad news priced in, the next leg of the USD/CAD trade may come from the US dollar side. The FOMC meeting is Wednesday and economic data continues to lead us to believe that caution will be the signal from the Fed either now or in June. US automakers roundly reported disappointing numbers on Tuesday and total sales fell to a 16.81m pace from 17.1m. It's another example of the divergence between soft and hard data.
Another currency that has been struggling lately is the New Zealand dollar. It touched an 11-month low last week before bouncing yesterday and today but a fresh challenge will come from jobs data to be released at 2245 GMT. The consensus is for unemployment to fall to 5.1% from 5.2% with participation steady at 70.5%. Earnings are expected to rise 0.7% in the quarter.
Elliott Wave Trade Ideas Performance Update
The long position entered in USD/CAD at 1.3430 finally met our indicated upside target at 1.3590 as the pair surged after finding renewed buying interest at 1.3411 (160 points profit was generated), price eventually rose above 1.3700 this week.
On the other hand, the short position entered in EUR/GBP at 0.8475 was stopped at 0.8515 as the pair edged higher early last week, however, euro met resistance at 0.8531 twice and has retreated again since.
No position was entered among other currency pairs.
In short, 2 positions were squared last week with total profit of 120 points and the positions are listed below.
24 Apr : USD/CAD - Long ar 1.3430, exited at 1.3590 (+ 160 points)
24 Apr : EUR/GBP - Short at 0.8475, exited at 0.8515 (- 40 points)
| AUD EUR/JPY EUR/GBP CAD GBP GBPJPY
Jan - 15 -275 - 35 -120
Feb + 140 -17 - 40 +11
Mar - 20 +115 +132 - 19
Apr + 30 - 40 +120 + 45
May
Jun
Jul
Aug
Sep
Oct
Nov
Dec
Y-T-D + 135 - 177 + 17 + 158 + 45