Sample Category Title
Candlesticks and Ichimoku Trade Ideas Performance Update
The greenback traded in relatively narrow range against euro after opening sharply higher, we entered at long position at 1.0900, however, in view of the sharpness of the retreat from 1.0951, we exited the position around break-even and the pair slipped to as low as 1.0851 before rebounding again.
No position was entered among other currency pairs.
In short, only 1 position was entered among all 4 currency pairs with total profit of 3 points and the position is listed below:
26 Apr : EUR/USD - Long at 1.0900, exited at 1.0903 (+ 3 points)
| JPY EUR CHF GBP
Jan + 167 - 85 - 10 + 50
Feb + 200 +150 +93 - 59
Mar -23 -70 -23 - 35
Apr + 65 + 93 + 50 - 40
May
Jun
Jul
Aug
Sep
Oct
Nov
Dec
Y-T-D + 408 + 83 +110 -84
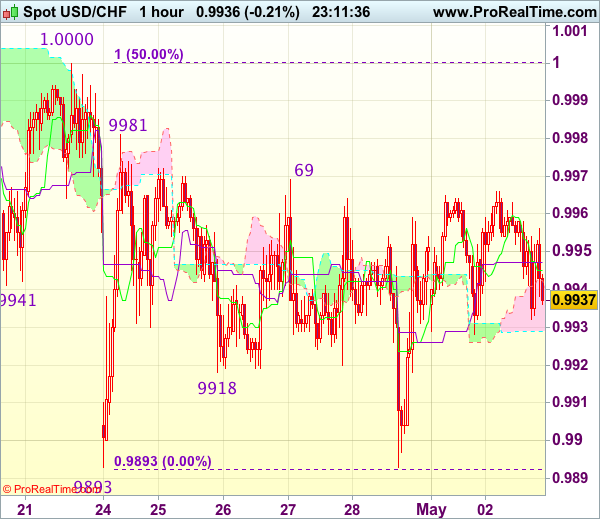
Trade Idea Wrap-up: USD/CHF – Stand aside
USD/CHF - 0.9935
Most recent candlesticks pattern : N/A
Trend : Near term down
Tenkan-Sen level : 0.9944
Kijun-Sen level : 0.9949
Ichimoku cloud top : 0.9944
Ichimoku cloud bottom : 0.9929
New strategy :
Stand aside
Position : -
Target : -
Stop : -
Despite last week’s late fall to 0.9893, failure to penetrate this last week’s low and the subsequent strong rebound to 0.9961 has retained our view that further choppy trading above said support would take place, above 0.9969 would bring test of resistance at 0.9981 but only break of 1.0000-08 resistance would confirm a temporary low has been formed at 0.9893, bring retracement of recent decline to 1.0025-30 (61.8% Fibonacci retracement of 1.0108-0.9893) but price should falter well below resistance at 1.0067.
On the downside, below 0.9915-20 would bring another test of said strong support at 0.9893 but break there is needed to revive bearishness and signal the decline from 1.0108 top has resumed and extend weakness to 0.9865-70 (2 times extension of 1.0108-1.0008 measuring from 1.0067), however, support at 0.9831 would hold from here, bring rebound later. As near term outlook is mixed, would be prudent to stand aside for now.
Trade Idea Wrap-up: GBP/USD – Buy at 1.2790
GBP/USD - 1.2925
Most recent candlesticks pattern : N/A
Trend : Near term up
Tenkan-Sen level : 1.2897
Kijun-Sen level : 1.2899
Ichimoku cloud top : 1.2926
Ichimoku cloud bottom : 1.2915
Original strategy :
Buy at 1.2790, Target: 1.2910, Stop: 1.2755
Position : -
Target : -
Stop : -
New strategy :
Buy at 1.2790, Target: 1.2910, Stop: 1.2755
Position : -
Target : -
Stop : -
Although cable has rebounded after finding support at 1.2864 and consolidation with mild upside bias is seen or gain to 1.2937 resistance, however, a firm break above there is needed to signal the pullback from 1.2965 has ended, bring retest of this level later, bring retest of this level first, then towards 1.2990-00 (1.236 times projection of 1.2109-1.2616 measuring from 1.2365 and psychological resistance). If said resistance continues to hold, further consolidation would take place and another leg of corrective fall to 1.2840-45, then towards support at 1.2805 but reckon downside would be limited to 1.2790-95 (38.2% Fibonacci retracement of 1.2515-1.2965) and bring rebound later.
In view of this, would not chase this rise here and would be prudent to buy cable on further subsequent pullback as downside should be limited to 1.2790-95. A drop below previous support at 1.2757 would abort and signal top is formed instead, bring correction to 1.2740 (50% Fibonacci retracement of 1.2515-1.2965) first.
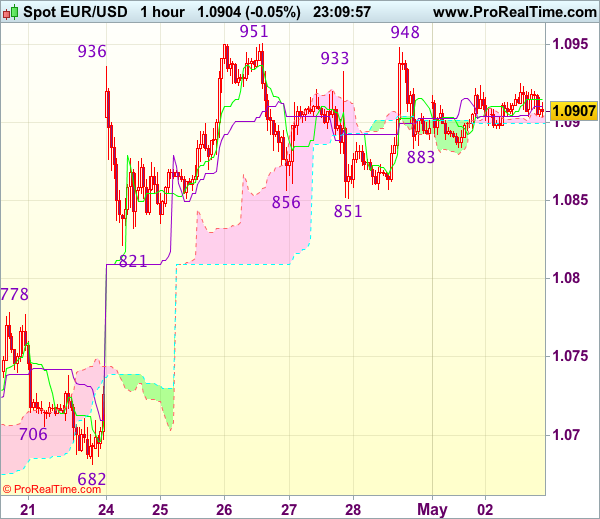
Trade Idea Wrap-up: EUR/USD – Stand aside
EUR/USD - 1.0905
Most recent candlesticks pattern : N/A
Trend : Near term up
Tenkan-Sen level : 1.0905
Kijun-Sen level : 1.0905
Ichimoku cloud top : 1.0903
Ichimoku cloud bottom : 1.0900
New strategy :
Stand aside
Position : -
Target : -
Stop : -
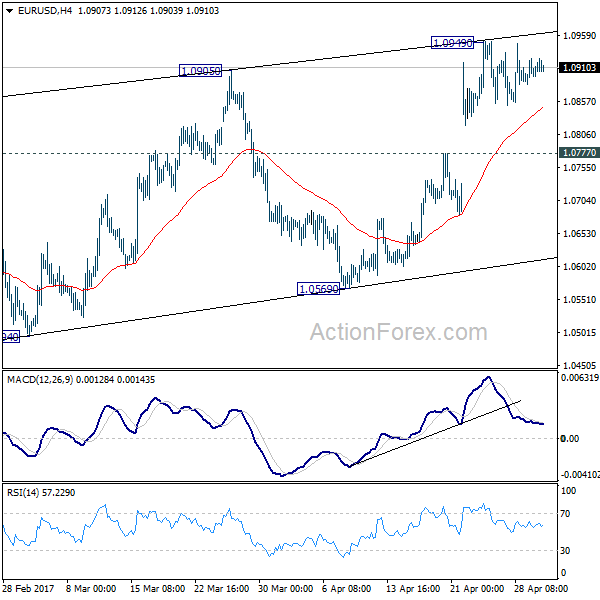
Although the single currency rose to as high as 1.0948 late last week, the subsequent retreat after faltering below last week’s high at 1.0951 has retained our view that further consolidation below this level would be seen and test of support at 1.0883 cannot be ruled out, however, reckon downside would be limited to support at 1.0851 and price should stay above 1.0821 support, bring another rise later.
On the upside, above said resistance at 1.0948-51 would revive bullishness and signal recent upmove from 1.0340 low has resumed for headway to 1.0975-80 and possibly towards 1.1000 which is likely to hold on first testing due to loss of momentum. As near term outlook is still mixed, would be prudent to stand aside in the meantime.
Trade Idea Wrap-up: USD/JPY – Buy at 111.55
USD/JPY - 112.18
Most recent candlesticks pattern : N/A
Trend : Near term up
Tenkan-Sen level : 112.09
Kijun-Sen level : 111.87
Ichimoku cloud top : 111.66
Ichimoku cloud bottom : 111.48
Original strategy :
Buy at 111.55, Target: 112.55, Stop: 111.20
Position : -
Target : -
Stop : -
New strategy :
Buy at 111.55, Target: 112.55, Stop: 111.20
Position : -
Target : -
Stop : -
As the greenback has surged again after brief pullback and broke above previous resistance at 111.74, adding credence to our view that recent upmove is still in progress and bullishness remains for further subsequent gain to 112.50-60 but near term overbought condition should limit upside to 112.80 and price should falter below 113.00-10, risk from there has increased for a retreat to take place later.
In view of this, would not chase this rise here and would be prudent to buy dollar on subsequent pullback as 111.50-55 should limit downside. Below support at 111.21 (yesterday’s low) would abort and suggest a temporary top is formed instead, bring correction towards 110.87 support.
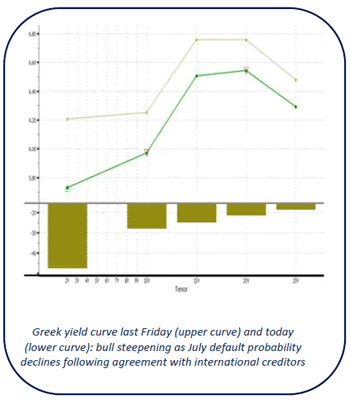
USD/JPY Testing the 112.20 Neckline
Headlines
European equity markets gained up to 0.75% with the Athens stock exchange outperforming after the reform agreement between Greece and international creditors. US stock markets opened slightly firmer as well.
Growth in the UK's manufacturing sector unexpectedly rebounded in April (from 54.2 to 57.3), confounding expectations of a slide to push the PMI to a three-year high. The forward looking overall new orders balance rose sharply from 56.1 to 60.7.
The eurozone's unemployment rate was steady at 9.5% in March, falling short of economists' expectations it would improve to 9.4%. This kept the rate at its lowest level since May 2009, after a downward trend from 2013′s peak at 12.1%. The final EMU manufacturing PMI was marginally downwardly revised from 56.8 to 56.7.
The ECB will have to hold a discussion next month about its strategy for 2018 and the eventual exit from its ultraeasy monetary policy, ECB Governing Council member Ewald Nowotny said.
Czech PM Sobotka said he will submit the resignation of his government to President Zeman this week. The move follows last week's comments by PM Sobotka that FM Babis may have engaged in "tax tricks or even tax evasion" as he built his empire, allegations that the minister has rejected. The premier said early elections were one option. A regularly scheduled ballot is set for October.
Rates
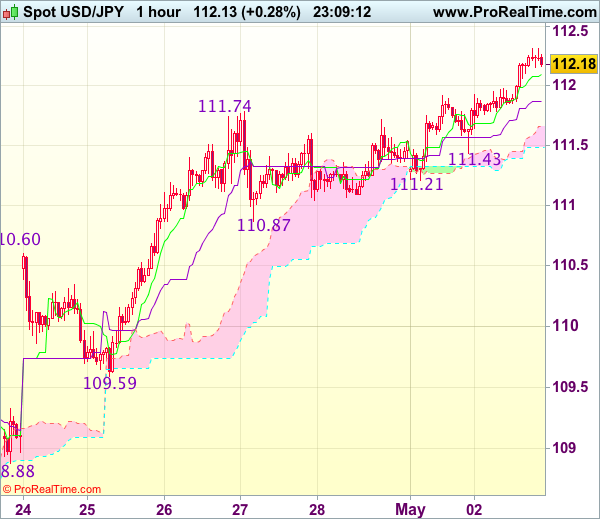
Greek assets outperform on reform agreement
Global core bonds lost marginally ground today in an uneventful session. This week's back-loaded eco calendar keeps many investors at bay with Apple earnings (tonight), the Fed meeting (tomorrow), US payrolls (Friday) and a potential new vote on a health care bill in US congress lining up. At the time of writing, the German yield curve shifts 0.6 bps (2-yr) to 1.3 bps (10-yr) higher. Changes on the US yield curve vary between +0.4 bps (2-yr) and +0.9 bps (10-yr). On intra-EMU bond markets, 10-yr yield spread changes versus Germany range between -2 bps and + 4 bps with Greece outperforming (-29 bps).
The Bund opened slightly weaker but trading flat lined afterwards. EMU eco data printed to close to consensus to trigger market reaction and the US eco calendar is empty. The initial move was some catching up with the US after yesterday's European banking holiday. US Treasuries lost ground after US Treasury Secretary Mnuchin repeated that issuing bonds with tenors +30y was a realistic possibility.
Apart from the catch-up move, European stock markets reacted positively on the reform agreement between Greece and international creditors. Greeks assets outperformed today. The Athens stock exchange gained around 3% and Greek spreads vs Germany narrowed up to 40 bps at the front end of the curve.
If the Greek parliament approves the measures agreed with EU/IMF, the Eurogroup can rubberstamp a new aid tranche at its May 22 meeting, avoiding a Greek default in July when €6B bonds are due. Yesterday's deal is also a first necessary requirement to get the IMF financially on board for the third bailout package and to start debt relief talks.
ECB Nowotny said that the ECB will have to hold a discussion about its strategy for 2018 and the eventual exit from its ultra-easy monetary policy at the June 8 meeting. "It is clear that the (asset-purchasing) programme has been and is a success. But on the other hand it is also clear that it must not become a permanent facility... That is the challenge we face," he added. "The longer such a programme continues, the more one must think about its consequences." Nowotny's comments didn't trigger market reaction, contrary to the ECB exit speculation we've witnessed after the March meeting.
Currencies
USD/JPY testing the 112.20 neckline
There were few eco data with potential to move the euro or the dollar. Especially EUR/USD again held a very tight range in the low 1.09 area. Greece's agreement with international creditors and hawkish comments of ECB's Nowotny didn't help the euro. USD/JPY (currently 112.25). tries to regain 112.20 resistance. The pair is supported by an ongoing positive risk sentiment and slightly higher core bond yields
Overnight, Asian markets partially joined the tech-driven rally from the US yesterday. China underperformed as the Caixin manufacturing PMI unexpectedly declined to 50.3 from 51.2. USD/JPY stabilized in the high 111 area, near the recent correction top. EUR/USD still didn't go anywhere in the low 1.09 area.
European equities also started the shortened week with a positive bias. Positive spill-over effects from the US were at play. Greece's agreement with its creditors on additional reforms was also positive for sentiment on European markets. However, it didn't help the euro. EUR/USD showed no dynamics at all and was locked in a very tight range in the low 1.09 area. ECB's Nowotny in a press interview again indicated that the ECB might discuss the future strategy at the June meeting. However, these Nowotny headlines had little impact on the euro. Interest rate differentials between the US and Europe were also little changed. Investors apparently await more important US data/events later this week before engaging in directional bets on the dollar. USD/JPY profited from the rise in core yields and the ongoing risk-on sentiment. The pair returned to the 112.20 resistance/neckline.
There were no important data in the US. The focus for trading over there is currently on the corporate earnings for the first quarter. US indices remain at/within reach of record levels going into the results of Apple after tonight's close. The dollar maintains a cautious bid. EUR/USD trades in the 1.0910 area. The test of USD/JPY 112.20 is ongoing (currently 112.25).
Sterling profits modestly from strong manufacturing PMI
Sterling remained under pressure early in Europe. The harsh comments from EU commission President Juncker on the Brexit negotiation after this weekend's meeting of EU leaders caused some further follow-through sterling selling. EUR/GBP rebounded to the 0.8480/85 area. Mid-morning, the UK April manufacturing PMI came out surprisingly strong at 57.3 from 54.2 in March. The report suggests that the sector profits, at least temporary, from the post-Brexit decline of sterling and from better economic conditions in Europe and at other UK trading partners. Initially, the gains of sterling remained very modest, but the UK currency gradually received a better bid later in the session. EUR/GBP trades currently in the 0.8450/55 area. Cable is again trading in the 1.29 area. Of late, sterling performed quite well, even as there was no important news. In this context, sterling gains to the UK PMI might be seen as slightly disappointing for sterling bulls.
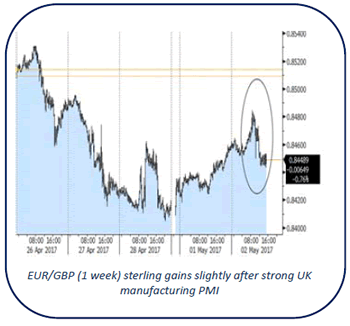
EUR/GBP Rounding Bottom Uptrend Continuation
The EUR/GBP has formed a rounding bottom shaped pattern at the support and is rejecting from W H3 camarilla pivot. 0.8435-50 is POC zone (D L3, ATR pivot, EMA 89, 50.0, trend line) and rejection from POC could target 0.8510. Have in mind that if target is reached, the pair could possibly spike to 0.8550 during next few days. This bullish scenario is negated if the pair drops and stays below 0.8400, rounded bottom low.
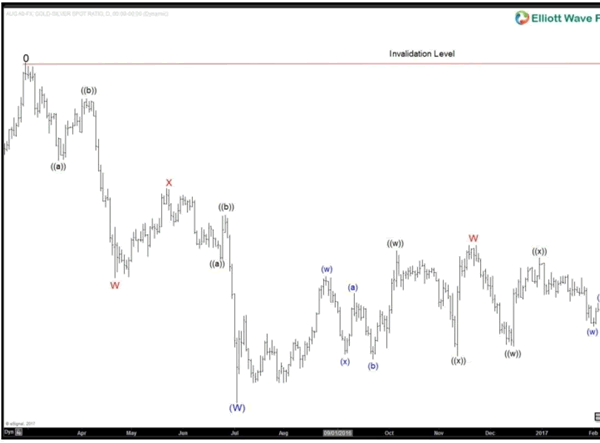
Gold Short Term Weakness Likely
Daily chart of Gold-to-Silver ratio above suggests that the ratio is correcting cycle from 2/29/2016 peak (83.68) before the decline resumes later, provided that pivot at 83.68 high stays intact. Short term, cycle from 7/4/2016 low (64.37) is showing a 5 swing incomplete sequence, favoring further upside in the short term. Expect the ratio to extend higher towards 76.55 – 78.68 area to end the rally from 7/4/2016 low, then it should at least pullback in 3 waves if not continue the next leg lower.
As the Ratio is inversely correlated with the underlying physical metals, this suggests that a higher ratio implies a lower XAUUSD and XAGUSD. Thus, we could expect short term weakness in both metals to persist until the Ratio reaches the target of 76.55 – 78.68, then when the Ratio turns lower, both metals can get support and start rallying also.
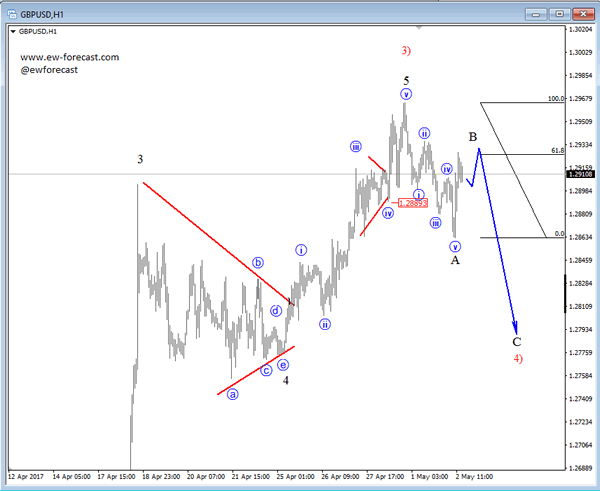
Elliott Wave Analysis: GBPUSD Undergoing A Possible Reversal
GBPUSD made a sharp bounce in the last couple of hours, which we see as wave B as part of a three wave decline. That said current wave B may see limited upside in the next few trading sessions around the Fibonacci ratio of 61.8, before making a new drop towards wave C).
GBPUSD, 1H
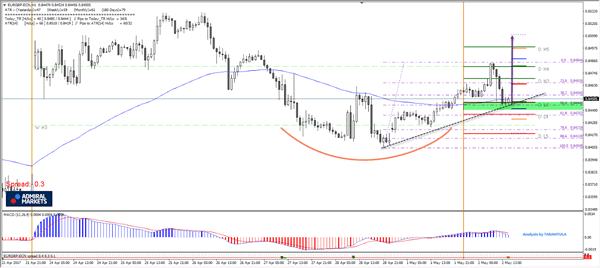
EUR/USD Mid-Day Outlook
Daily Pivots: (S1) 1.0880; (P) 1.0901 (R1) 1.0920; More....
Intraday bias in EUR/USD remains neutral as consolidation from 1.0949 temporary top continues. With 1.0777 minor support intact, further rise is still expected. But still, choppy rebound from 1.0339 is seen as a correction. Hence we'd look for topping again on next rise. Meanwhile, on the downside, break of 1.0777 will turn turn bias to the downside for 1.0569 support first.
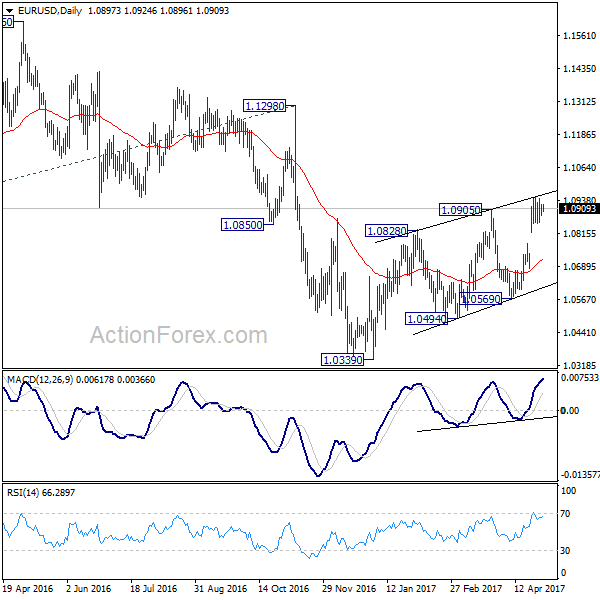
In the bigger picture, as long as 1.1298 key resistance holds, whole down trend from 1.6039 (2008 high) is still expected to continue. Break of 1.0339 low will send EUR/USD through parity to 61.8% projection of 1.3993 to 1.0461 from 1.1298 at 0.9115. However, considering bullish convergence condition in weekly MACD, break of 1.1298 will indicate term reversal. This would also be supported by sustained trading above 55 week EMA.