Sample Category Title
Focus Turned From Geopolitical Tensions to UK Election, French Election and US Tax Reform, Volatility Remains
Geopolitical tensions somewhat took a back seat last week. The headlines were filled by news of UK snap election, French election, and to a lesser extent US tax reform. Sterling ended the week as the strongest major currency after boosted by the news of snap election and prospect of a "softer" Brexit. Euro survived the terrorist attack in Paris and French election uncertainties to end as the second strongest one. Dollar ended the week mixed as markets seemed not too convinced by news of Trump administration's tax reform. Meanwhile, Canadian Dollar ended as the weakest one as dragged down by WTI crude oil's sharp fall and break of 50 handle. The result of French election on Sunday will be the first market mover this week.
French election on Sunday watched
The first round of French presidential election on Sunday prompted some risk averse sentiments in the markets. In particular, investors are getting more cautious after the terrorist attack in Paris. German bund yields tumbled to close the week at 0.19%, lowest level for the year. At this point, centrist Emmanuel Macron and far-right Marine Le Pen are still expected to come out of Sunday as the winner for the run-off on May 7. Anti-euro Le Pen seemed to have gotten a jump in support after the Paris attack. But that didn't change the base line scenario of a Macron-Le Pen run off with Macron as winner in that case. It was indeed, the strong momentum of another anti-euro candidate far-left Jean-Luc Melenchon that worried the markets most. A Melenchon-Le Pen run off will drastically raise the voice of Frexit in France and would give the Euro much pressure. Judging from the actions in CAC 40, markets are not too worried about it yet.
CAC 40 rebounded after intra-week dip
CAC 40 dipped to as low as 4980.81 last week but that was mainly following the sharp fall in FTSE. CAC 40 then drew strong support from 55 day EMA and 38.2% retracement of 4733.81 to 5142.81 and rebounded. The news of Paris attack didn't trouble the index much. It's staying in up trend despite loss of upside momentum as seen in daily MACD. For now, outlook of the index remains bullish for another rise through 5142.81 at a later stage.
May's snap election positive for Sterling
The world was shocked by UK Prime Minister Theresa May's u-turn and call for a snap election last week. The notion was then approved by the parliament with overwhelming 522 to 13 votes. FTSE 100 suffered the worst day since Brexit referendum and tumbled sharply after the news. On the other hand, Sterling soared and ended the week as the strongest major currency. May's Conservative is widely expected to win the election in June as the party is having over 20% margin of support over its strongest rivals. Some analysts noted that a win in the election will give May the mandate to pursue her "own" Brexit strategy. And that would mean a softer and more patient approach, in avoidance of "hard Brexit". Markets' repricing of the scenarios for Sterling has sent FTSE sharply lower due to profit projections on exchange rate.
But negative for FTSE
The sharp decline in FTSE clearly indicated topping at 7447.00. This is supported by the strong break of 55 day EMA as well as bearish divergence condition in daily MACD. We also see the rise from 5499.50 as ended and thus expect medium term pull back to 38.2% retracement of 5499.50 to 7447.00 at 6703.05. At this point, we're staying bearish in GBP/USD for medium term. But upside acceleration in GBP/USD, accompanied by downside acceleration in FTSE, could prompt us to change the medium term outlook of GBP/USD.
Markets unconvinced by Trump's tax plan
US stocks, yields and Dollar attempted to rebound last week on news regarding US President Donald Trump's tax reforms. But the developments argue that these markets have merely stabilized rather than reversed. After some comments by Treasury Secretary Steven Mnuchin, the White House finally said on Friday that Trump will release "broad principles and priorities" of the tax overhaul on the coming Wednesday. Trump also said that "the process has begun long ago but it really formally begins on Wednesday." However, it's also reported that the announcement will only contain broad principles and no details. Meanwhile, it's also reported that this round of reform will only be temporary because the so called border-adjusted tax will be excluded. Based on the current reactions, markets will need something more concrete before committing to a rebound.
DJIA stabilized with weak recovery
DJIA is trying to stabilize around 55 day EMA but the momentum for recovery is very weak. At this point, we'd need to see at least a break of 20887.50 resistance before confirming sustainable buying interest. Otherwise, deeper decline is still in favor for the correction from 21169.11 to extend to 38.2% retracement of 17883.56 to 21169.11 at 19914.02.
TNX still heading down
10 year yield dipped to as low as 2.177 but recovered since then. There is no change in the near term bearish outlook as long as 2.391 resistance holds. And TNX's correction from 2.615 would extend to as 38.2% retracement of 1.336 to 2.621 at 2.130. Based on oversold condition as seen in daily chart, strong support should be seen at around 2.13 to bring a rebound. But still, break of 2.391 resistance is needed to indicate completion of the correction. Or, more downside would be seen ahead.
Regarding trading strategy, out EUR/USD short (entered at 1.0580) was stopped out at 1.0680 last week, losing -100 pips. We'll wait for markets reaction to French election before putting on a position.
GBP/JPY Weekly Outlook
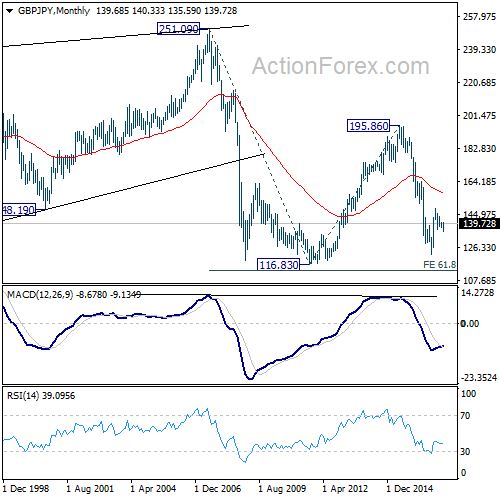
GBP/JPY formed a short term bottom at 135.58 last week, just ahead of 135.39 medium term fibonacci level. The development argues that whole consolidation pattern from 148.42 has completed. But we'd prefer to see decisive break of 140.08 resistance to confirm. At this point, we're favoring the bullish case and expect further upside in GBP/JPY ahead.
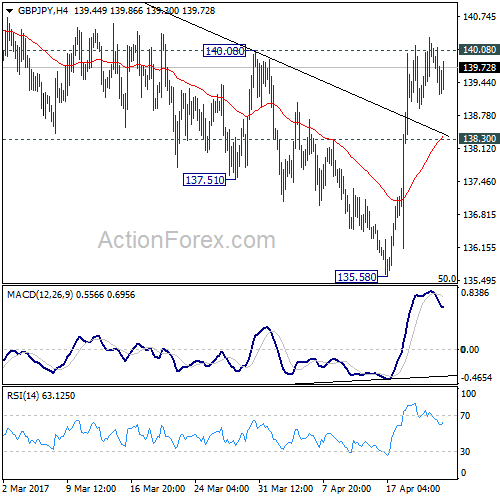
Initial bias in GBP/JPY is neutral this week for some consolidations. But as long as 138.30 minor support holds, further rally is expected. Decisive break of 140.08 resistance should affirm our bullish view and target 144.77 resistance next. However, break of 138.30 will turn focus back to 135.58 low instead.
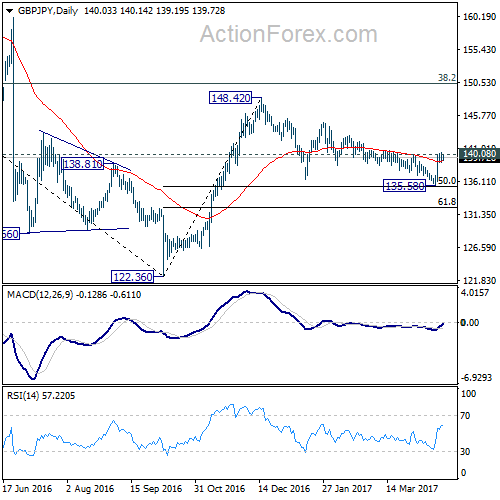
In the bigger picture, price actions from 122.36 medium term bottom are still seen as a corrective pattern. As long as 50% retracement of 122.36 to 148.42 at 135.39 holds, another rising leg would be seen to 38.2% retracement of 195.86 to 122.36 at 150.42 and possibly above. However, firm break of 135.39 will bring retest of 122.36, with prospect of resuming the larger down trend from 195.86.
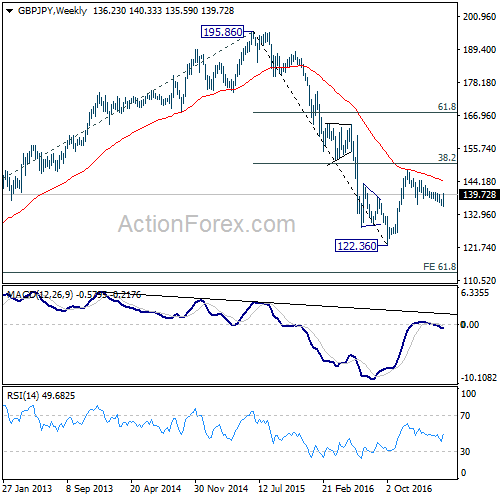
In the longer term picture, while price actions from 122.36 would develop into a medium term correction, fall from 195.86 is still seen as resuming the down trend from 251.09 (2007 high). Hence, after the correction from 122.36 completes we'd expect another fall through 116.83 low.
EUR/USD Weekly Outlook
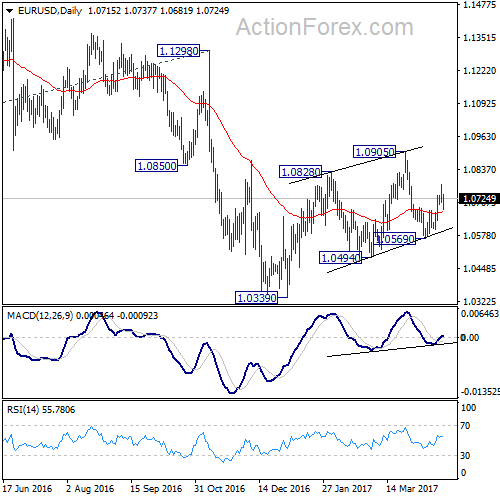
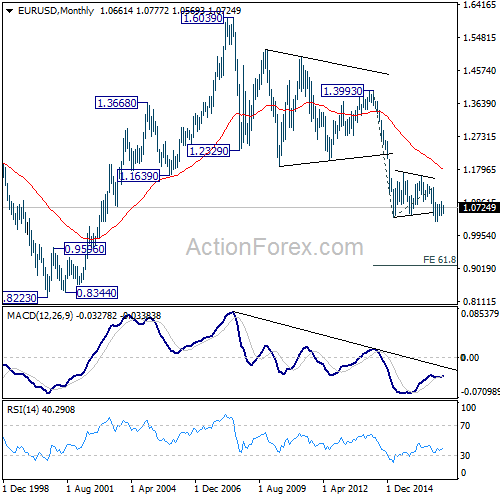
EUR/USD surged to 1.0777 last week but failed to sustained gain and retreated. Nonetheless, current development slightly favors the case that corrective rise from 1.0339 is not completed. Hence, another rally is mildly in favor as long as 1.0676 minor support holds.
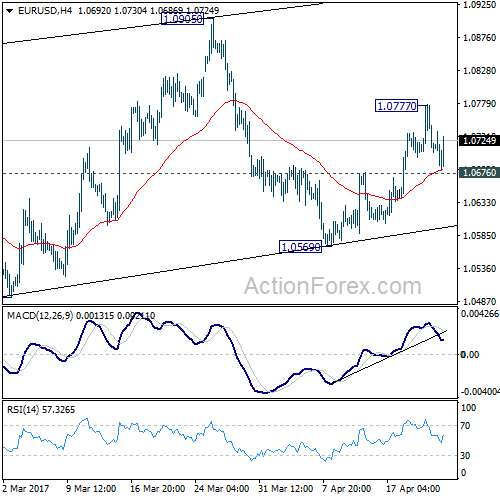
Initial bias in EUR/USD is neutral this week first. On the upside, above 1.0777 will target 1.0905 and above. But still, choppy rise from 1.0339 is still seen as a correction. Hence, we'll pay attention to topping signal above 1.0905 again, as we'd expect larger down trend to resume later. On the downside, break of 1.0676 minor support will turn intraday bias back to the downside for 1.0569 instead.
In the bigger picture, as long as 1.1298 key resistance holds, whole down trend from 1.6039 (2008 high) is still expected to continue. Break of 1.0339 low will send EUR/USD through parity to 61.8% projection of 1.3993 to 1.0461 from 1.1298 at 0.9115. However, considering bullish convergence condition in weekly MACD, break of 1.1298 will indicate term reversal. this would also be supported by sustained trading above 55 week EMA.
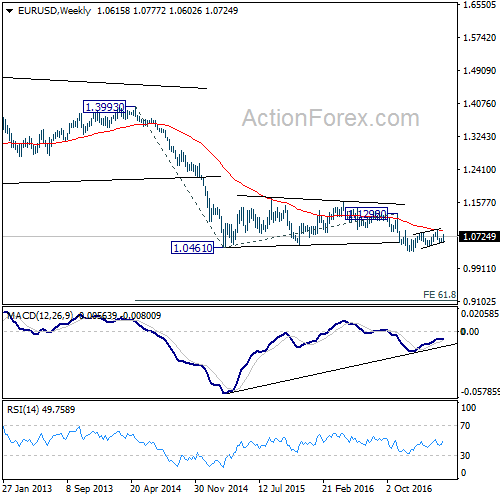
In the long term picture, the down trend from 1.6039 (2008 high) is still in progress and there is no clear sign of completion. We'd expect more downside towards 0.8223 (2000 low) as long as 1.1298 resistance holds. However, firm break of 1.1298 should now confirm long term reversal.
USD/JPY Weekly Outlook
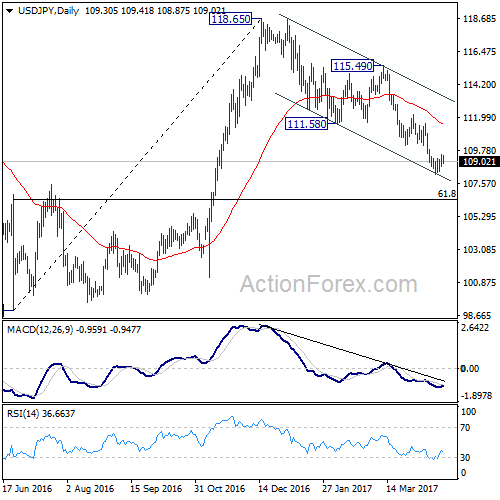
USD/JPY stayed in consolidation above 108.12 temporary low last week. Upside of recovery is limited well below 110.10 support turned resistance so far. Thus, bearish near term outlook is maintained. Fall from 118.65 is expected to extend lower.
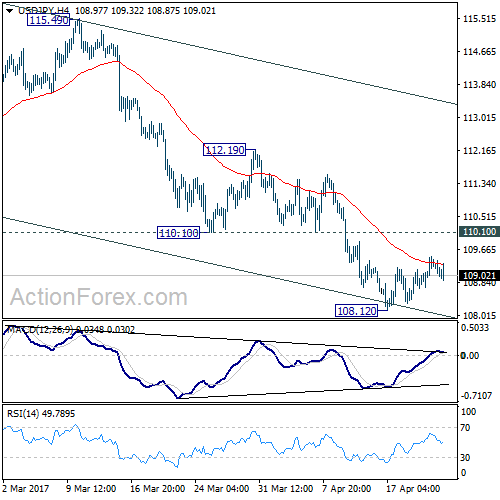
Initial bias in USD/JPY is neutral this week first. With 110.10 resistance intact, near term outlook remains bearish. Rise from 98.97 is finished at 118.65 and fall from there would extend. On the downside, break of 108.12 will target 61.8% retracement of 98.97 to 118.65 at 106.48. Sustained break there will pave the way back to 98.97 low. Nonetheless, break of 110.10 will be the first sign of near term bottoming and turn bias back to the upside for 112.19 resistance instead.
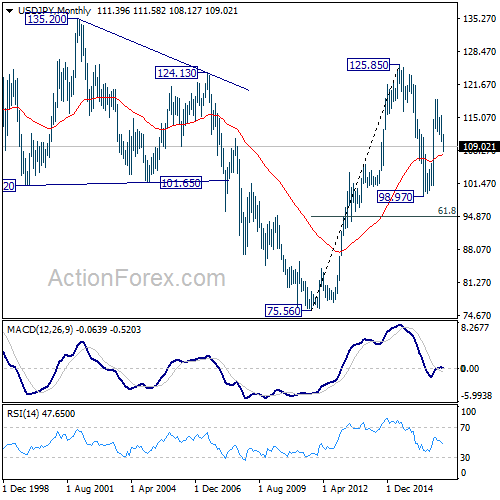
In the bigger picture, price actions from 125.85 high are seen as a corrective pattern. Current development suggests that it's not completed yet and is extending. In case of deeper decline, downside should be contained by 61.8% retracement of 75.56 to 125.85 at 94.77 to bring rebound. Rise from 75.56 is still expected to resume later after the correction from 125.85 completes.
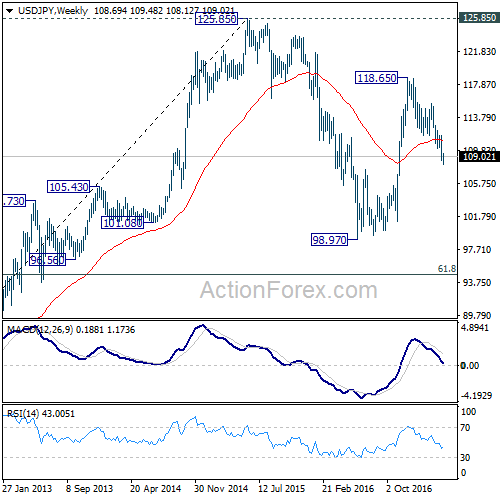
In the long term picture, the rise from 75.56 long term bottom to 125.85 medium term top is viewed as an impulsive move. Price actions from 125.85 are seen as a corrective move which could still extend. But, up trend from 75.56 is expected to resume at a later stage for above 135.20/147.68 resistance zone.
GBP/USD Weekly Outlook
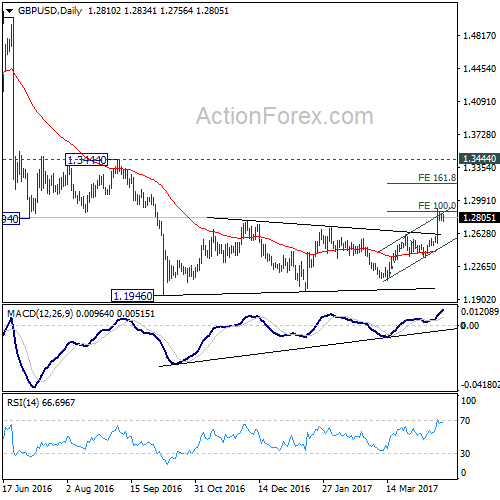
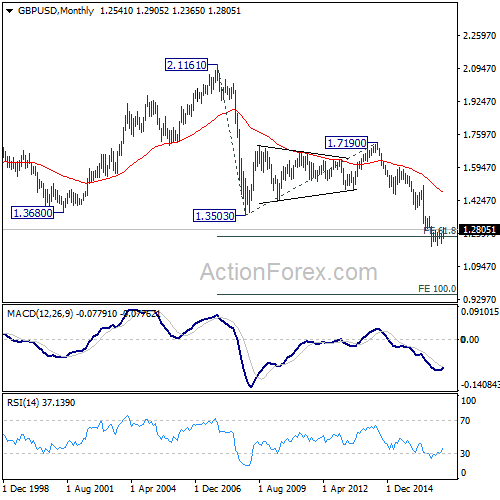
GBP/USD surged to as high as 1.2903 last week but retreated after hitting 100% projection of 1.2108 to 1.2614 from 1.2365 at 1.2871. Further rise is still expected in the pair. But price actions from 1.1946 are viewed as a corrective pattern. Hence we'd expect loss of momentum ahead to limit upside on next rise.
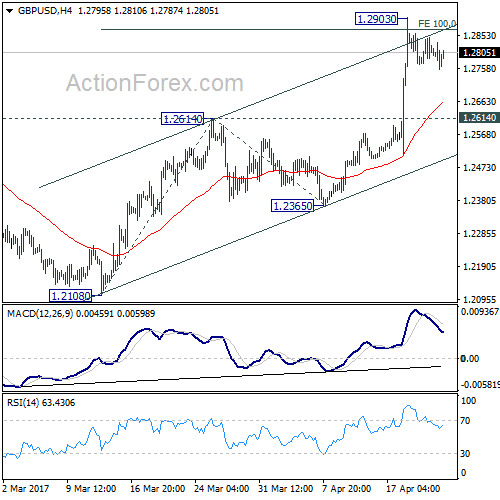
Initial bias in GBP/USD is neutral this week for consolidations. With 1.2614 resistance turned support intact, further rally is expected. Firm break of 100% projection of 1.2108 to 1.2614 from 1.2365 at 1.2871 will target 161.8% retracement at 1.3184. Still, price actions from 1.1946 are seen as a correction. Hence we'd expect strong resistance below 1.3444 to bring larger down trend resumption. On the downside, break of 1.2614 resistance turned support will turn bias back to the downside for 1.2365 support first.
In the bigger picture, fall from 1.7190 is seen as part of the down trend from 2.1161. There is no sign of medium term reversal yet. Sustained trading below 61.8% projection of 2.1161 to 1.3503 from 1.7190 at 1.2457 will target 100% projection at 0.9532. Overall, break of 1.3444 resistance is needed to confirm medium term bottoming. Otherwise, outlook will remain bearish.
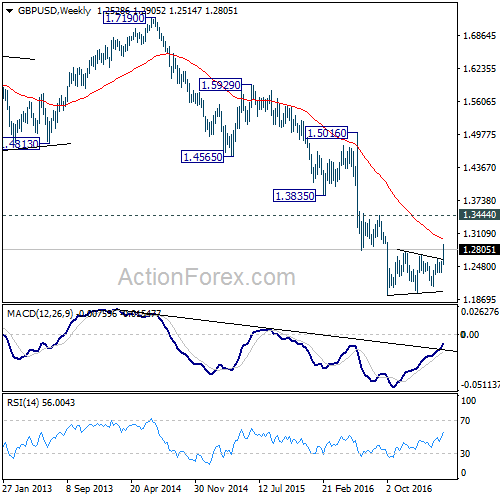
In the longer term picture, no change in the view that down trend from 2.1161 is still in progress. Current momentum suggests that the down trend will go deeper than originally expected to 100% projection of 2.1161 to 1.3503 from 1.7190 at 0.9532.
USD/CHF Weekly Outlook
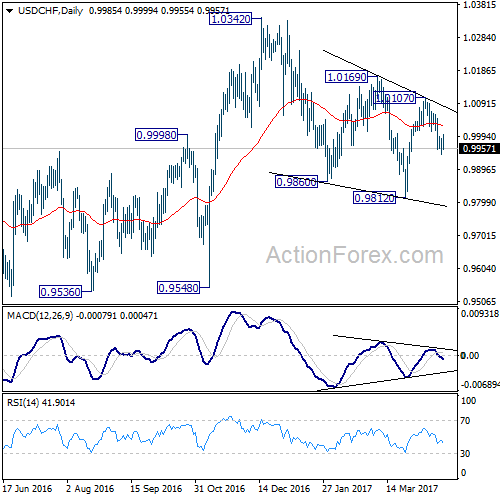
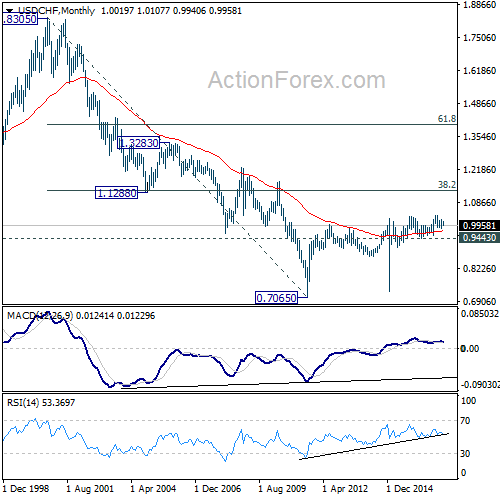
USD/CHF's decline last week argues that rebound from 0.9812 has completed at 1.0107 already. And more importantly, the corrective fall from 1.0342 could be in progress and has started another falling leg. Hence, deeper decline is mildly in favor in near term before larger rise resumes.
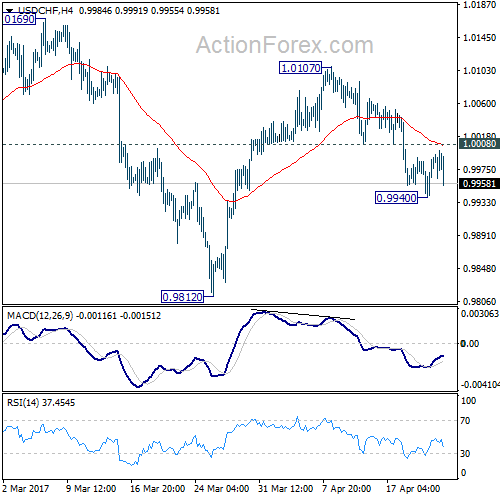
Initial bias in USD/CHF remains neutral this week for consolidations above 0.9940 temporary low. Another fall is expected as long as 1.0008 minor resistance holds. Below 0.9940 will turn bias to the downside for 0.9812 and below. Fall from 1.0342 is seen as a correction. Hence, we'll look for bottoming signal below 0.9812. Meanwhile, on the upside, above 1.0008 minor resistance will turn bias back to the upside for 1.0107 resistance instead.
In the bigger picture, we're still maintaining that firm break of 1.0342 key resistance is needed to confirm underlying bullish momentum in the cross. However, the corrective nature of the fall from 1.0342 is starting to give the medium term outlook a bullish favor. Hence, in stead of looking for topping signal around 1.0342, we'd now pay closer attention to upside acceleration as USD/CHF approaches this level again.
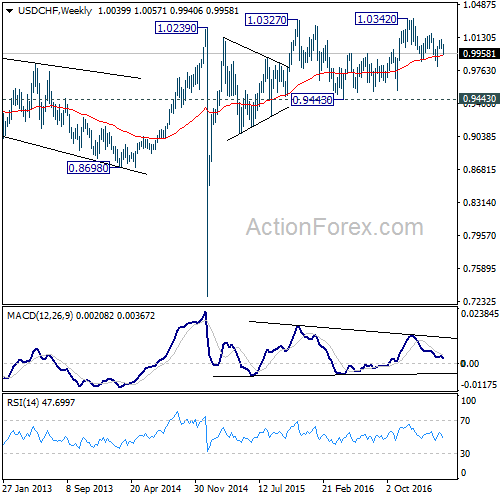
The long term outlook in USD/CHF stays a bit mixed for the moment. But in case of another medium term fall, we'd expect strong support from 0.9443/9548 support zone. Meanwhile, firm break of 1.0342 will target 38.2% retracement of 1.8305 to 0.7065 at 1.1359.
AUD/USD Weekly Outlook
AUD/USD's rebound lost momentum after hitting 0.7609 and reversed. The development mixed out the near term outlook. And we'll wait and see which side AUD/USD will break out to.
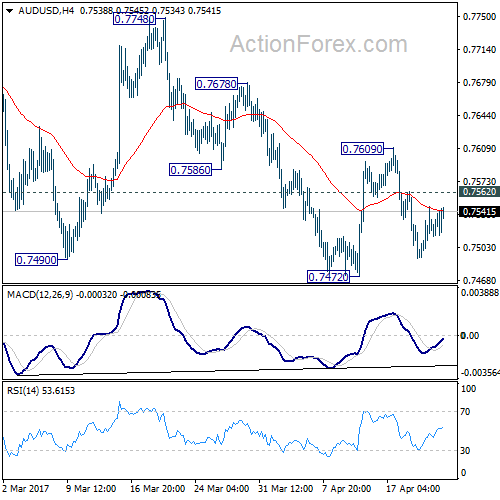
Initial bias in AUD/USD is neutral this week first. With 0.7562 minor resistance intact, deeper fall is just mildly in favor for0.7472 support. Firm break there will revive the case that whole rise from 0.7158 is completed at 0.7740. In that case, AUD/USD will target a test on 0.7158 key support level next. On the upside, above 0.7562 minor resistance will turn bias back to the upside for 0.7609 resistance. Break will target a test on 0.7748 high.
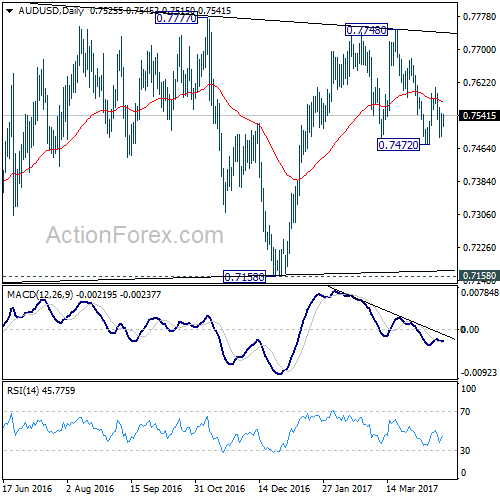
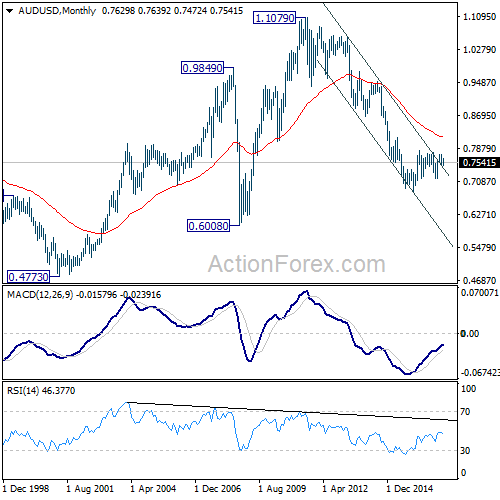
In the bigger picture, we're still treating price actions from 0.6826 low as a correction. And, as long as 38.2% retracement of 0.9504 to 0.6826 at 0.7849 holds, long term down trend from 1.1079 is expected to resume sooner or later. Break of 0.6826 low will target 0.6008 key support level. However, firm break of 0.7849 will indicate that rise from 0.6826 is developing into a medium term rebound, rather than a sideway pattern. In such case, stronger rise should be seen to 55 month EMA (now at 0.8144) and above.
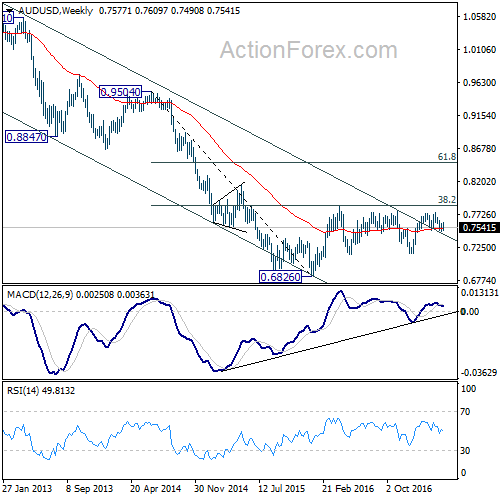
In the longer term picture, while the down trend from 1.1079 might extend lower, we're not anticipating a break of 0.6008 (2008 low) yet. We'll look for bottoming above there to reverse the medium term trend.
USD/CAD Weekly Outlook
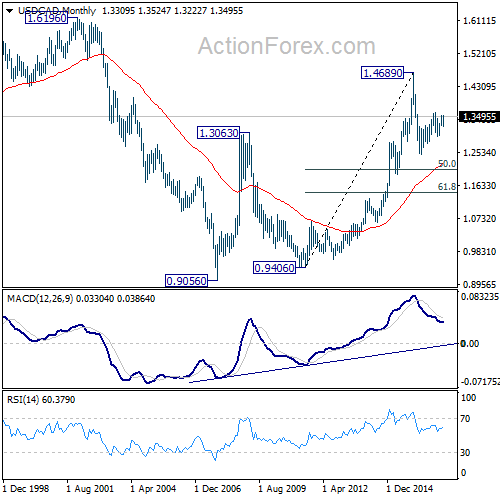
USD/CAD's strong rally and break of 1.3455 resistance argues that consolidation pattern from 1.3534 is completed at 1.3222 already. Rises from 1.2968 and 1.2460 are likely resuming. Further upside should be seen to 1.3598 and then 1.3838 fibonacci level ahead.
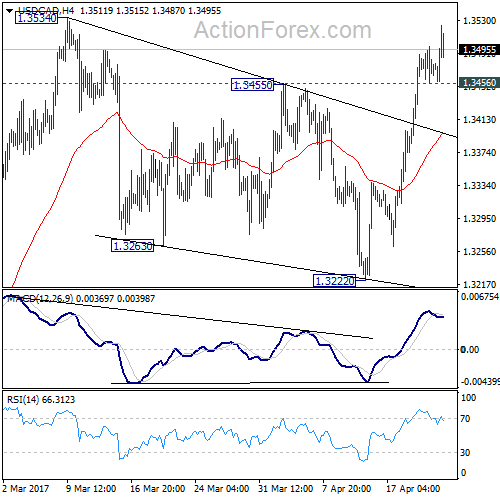
Initial bias in USD/CAD remains on the upside this week for 1.3534 resistance first. Break will target 1.3598 key resistance next. Firm break there will confirm resumption of whole rise from 1.2460 to next medium term fibonacci level at 1.3838. On the downside, below 1.3456 minor support will turn intraday bias neutral and bring consolidation. But retreat should be contained well above 1.3222 support and bring another rally.
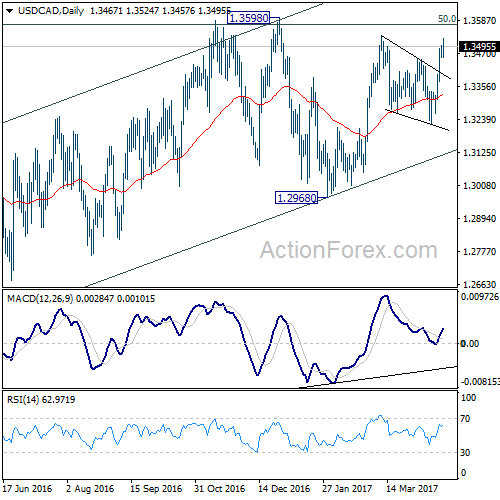
In the bigger picture, price actions from 1.4689 medium term top are seen as a correction pattern. The first leg has completed at 1.2460. The second leg from 1.2460 is likely still in progress and could target 61.8% retracement of 1.4689 to 1.2460 at 1.3838. We'd look for reversal signal there to start the third leg. However, break of 1.2968 will argue that the third leg has already started and should at least bring a retest of 1.2460 low. Meanwhile, sustained trading above 1.3838 would pave the way to retest 1.4689 high.
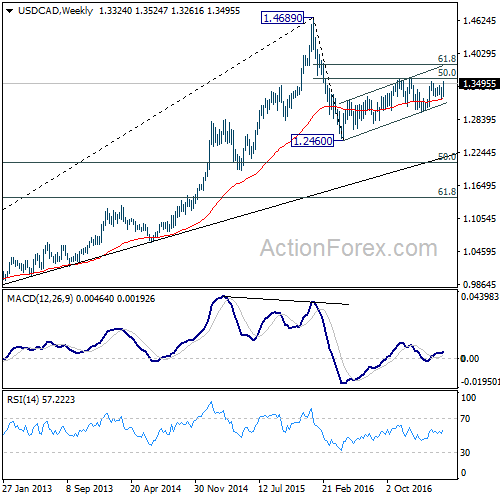
In the longer term picture, rise from 0.9056 (2007 low) is viewed as a long term up trend. It's taking a breath after hitting 1.4689. But such rise expected to resume later to test 1.6196 down the road.
GBP/JPY Weekly Outlook
GBP/JPY formed a short term bottom at 135.58 last week, just ahead of 135.39 medium term fibonacci level. The development argues that whole consolidation pattern from 148.42 has completed. But we'd prefer to see decisive break of 140.08 resistance to confirm. At this point, we're favoring the bullish case and expect further upside in GBP/JPY ahead.
Initial bias in GBP/JPY is neutral this week for some consolidations. But as long as 138.30 minor support holds, further rally is expected. Decisive break of 140.08 resistance should affirm our bullish view and target 144.77 resistance next. However, break of 138.30 will turn focus back to 135.58 low instead.
In the bigger picture, price actions from 122.36 medium term bottom are still seen as a corrective pattern. As long as 50% retracement of 122.36 to 148.42 at 135.39 holds, another rising leg would be seen to 38.2% retracement of 195.86 to 122.36 at 150.42 and possibly above. However, firm break of 135.39 will bring retest of 122.36, with prospect of resuming the larger down trend from 195.86.
In the longer term picture, while price actions from 122.36 would develop into a medium term correction, fall from 195.86 is still seen as resuming the down trend from 251.09 (2007 high). Hence, after the correction from 122.36 completes we'd expect another fall through 116.83 low.
EUR/JPY Weekly Outlook
EUR/JPY edged lower to 114.84 last week but drew support from 114.88 fibonacci level and recovered. Upside of recovery is limited below 118.23 support turned resistance so far. Thus, the bearish outlook is maintained. That is, rebound from 109.20 has completed at 124.08. Fall from 124.08 would resume to retest 109.20 low.
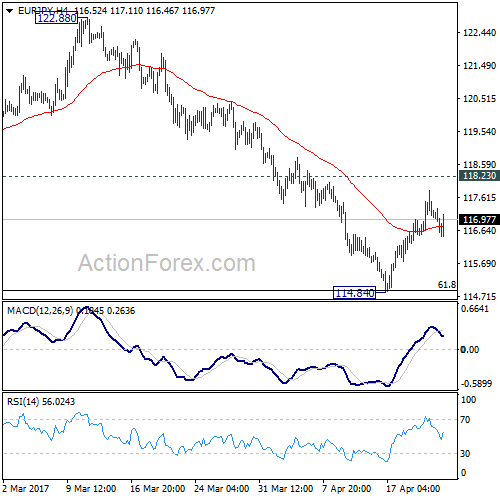
Initial bias in EUR/JPY remains neutral this week for consolidation above 114.84. Upside of recovery should be limited by 118.23 support turned resistance and bring another fall. Sustained break of 61.8% retracement of 109.20 to 124.08 at 114.88 will extend the decline from 124.08 to retest 109.20 low. However, firm break of 118.23 will indicate near term reversal and target 122.88 resistance instead.
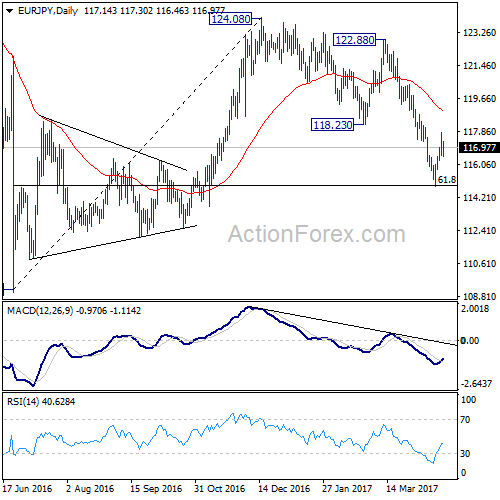
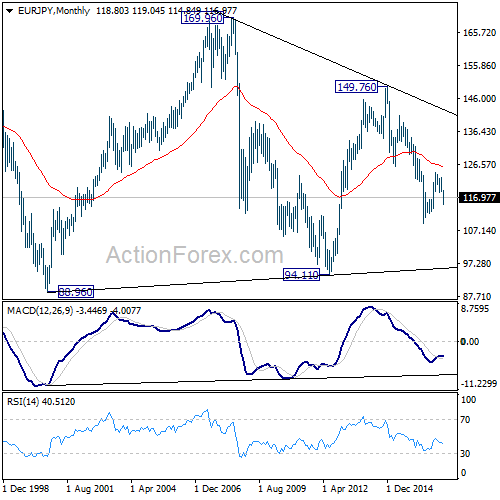
In the bigger picture, medium term corrective rise from 109.20 should have completed at 124.08, ahead of 126.09 support turned resistance. Medium term down trend from 149.76 could be resuming. Break of 109.20 will target 94.11 low. In any case, break of 126.09 is needed needed to confirm medium term reversal. Otherwise, outlook will remain bearish in case of another rebound.
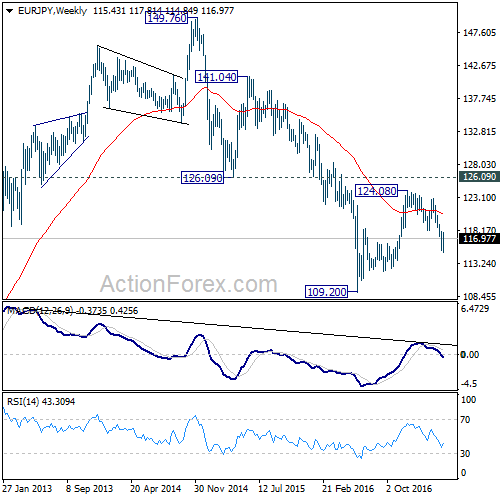
In the long term picture, medium term decline from 149.76 is seen as part of a long term sideway pattern from 88.96. Such decline is still in progress and could target 94.11 low. At this point, we'd look for loss of downside momentum above 94.11 to signal bottoming and reversal. This bearish view will hold as long as 126.09 resistance holds.
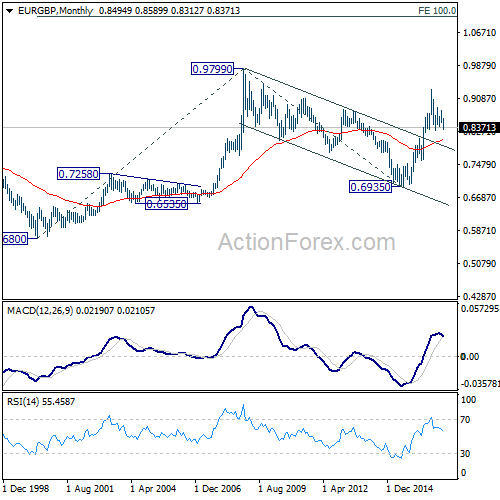
EUR/GBP Weekly Outlook
EUR/GBP dropped sharply to as low as 0.8312 last week but formed a temporary low ahead of 0.8303 low and recovered. Nonetheless, the development still suggests that larger correction from 0.9304 is resuming and further fall is expected through 0.8303 low ahead.
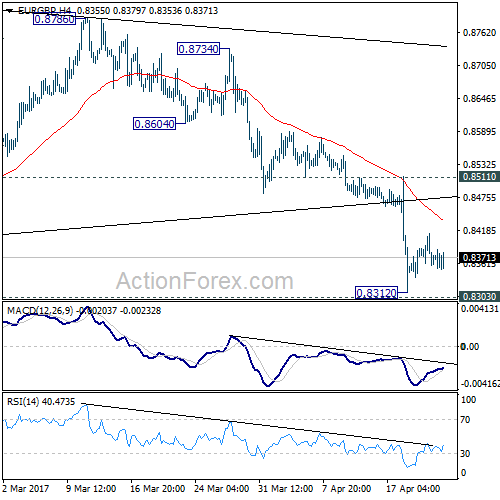
Initial bias in EUR/GBP is neutral this week for consolidation above 0.8312 temporary low first. Upside of recovery should be limited by 0.8511 resistance and bring another decline. Below 0.8303 will extend the fall from 0.9304 to 0.8116/20 cluster support. As decline from 0.9304 is seen as a corrective move, we'd expect strong support around 0.8116/20 to contain downside and completion such correction. Meanwhile, on the upside, break of 0.8511 will turn bias back to the upside for 0.8786 resistance instead.
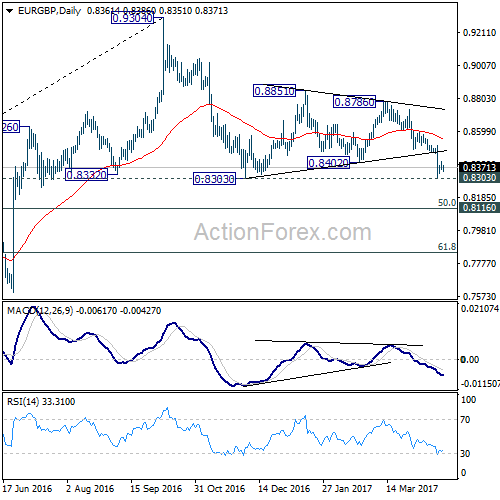
In the bigger picture, price actions from 0.9304 are viewed as a medium term corrective pattern. Such decline is likely ready to resume and should make a new low below 0.8303. At this point, we'd expect strong support from 0.8116 cluster support (50% retracement of 0.6935 to 0.9304 at 0.8120) to contain downside. Rise from 0.6935 (2015 low) will resume at a later stage to 0.9799 (2008 high). However, sustained break of 0.8116 could bring deeper decline to next key support level at 0.7564 before the correction completes.
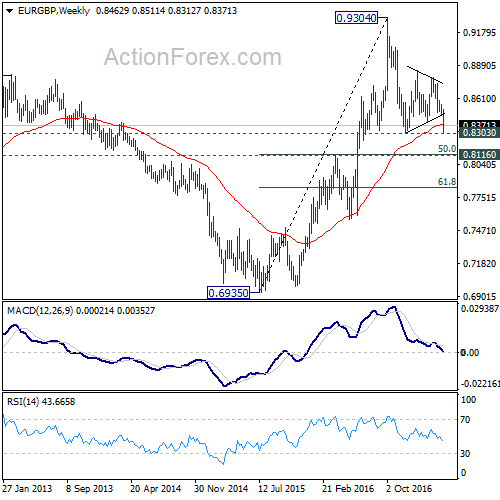
In the long term picture, firstly, price action from 0.9799 (2008 high) is seen as a long term corrective pattern and should have completed at 0.6935 (2015 low). Secondly, rise from 0.6935 is likely resuming up trend from 0.5680 (2000 low). Thirdly, this is supported by the impulsive structure of the rise from 0.6935 to 0.9304. Hence, after the correction from 0.9304 completes, we'd expect another medium term up trend to target 0.9799 high and above.