Sample Category Title
US Housing Starts Slipped Back in March But Still Up in Q1
Highlights:
- Housing starts fell short of market expectations in March, dropping to 1,215k annualized units from February's upwardly revised 1,303k pace (was 1,288k).
- Single and multi-unit starts both recorded declines in March but were up for the quarter as a whole. Single unit starts were at a cycle high in Q1.
- Building permits rebounded to 1,260k in March but are still running slightly short of the pace of housing starts over the last six months, limiting near-term upside risk for starts.
- Residential investment is expected to have increased by an annualized 10% in Q1, roughly matching the previous quarter's 9.6% gain.
Our Take:
US housing activity continues to trend higher although as today's data show the pattern isn't always smooth. The unexpectedly large decline in March housing starts follows an upwardly revised February reading with some activity likely having been pulled forward into the first two months of this year when temperatures were unseasonably mild. For Q1 as a whole starts edged up to a fresh cycle high. Other housing data have also improved early this year - home resales are rising and multi-unit construction spending has increased strongly quarter-to-date - supporting our forecast for a 10% annualized increase in Q1 residential investment. That will provide key offset to a slowdown in consumer spending that is expected to limit GDP growth to 1.5% in the quarter. While consumers are expected to re-emerge as the main source of growth going forward, residential investment is forecast to continue to make a solid contribution to economic activity as many of the factors that support consumer spending (particularly strong labour market conditions and buoyant confidence) should also boost demand for housing. While some choppiness can be expected, we think housing starts will continue to move higher throughout 2017 to extend the upward trend that has been in place since 2011.
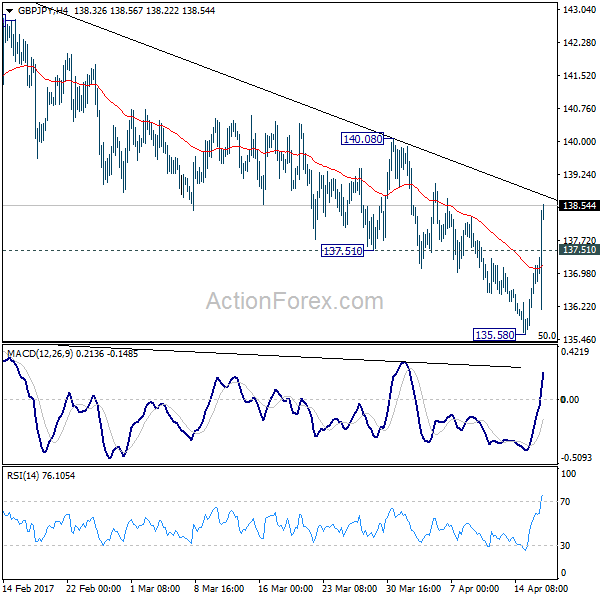
GBP/JPY Mid-Day Outlook
Daily Pivots: (S1) 135.94; (P) 136.45; (R1) 137.33; More...
GBP/JPY's strong break of 137.51 indicates short term bottoming at 135.58, ahead of 135.39 fibonacci level. The consolidation pattern from 148.82 could have completed today. Intraday bias is turned back to the upside for 140.08 resistance first. Break will affirm this case and target a test on 148.42 resistance next. For now, outlook will stays cautiously bullish as long as 135.58 support holds.
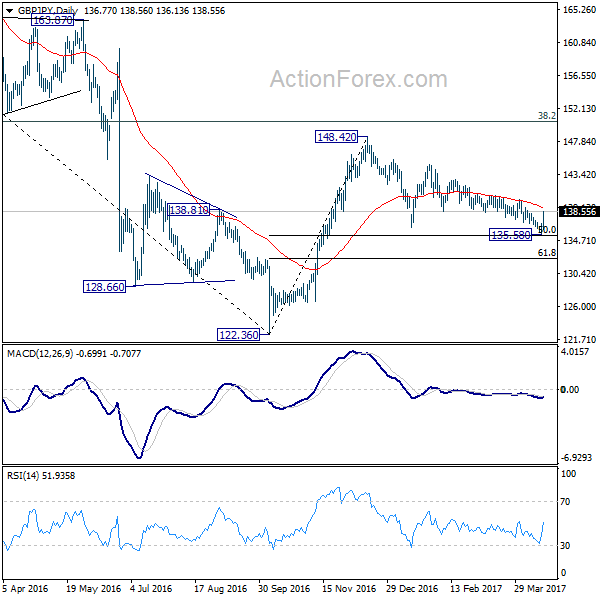
In the bigger picture, price actions from 122.36 medium term bottom are still seen as a corrective pattern. As long as 50% retracement of 122.36 to 148.42 at 135.39 holds, another rising leg would be seen to 38.2% retracement of 195.86 to 122.36 at 150.42 and possibly above. However, firm break of 135.39 will bring retest of 122.36, with prospect of resuming the larger down trend from 195.86.
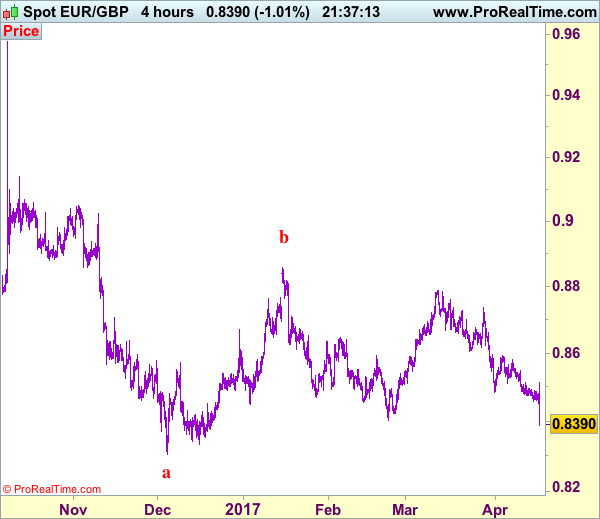
Trade Idea: EUR/GBP – Sell at 0.8485
EUR/GBP - 0.8393
Recent wave: Major double three (A)-(B)-(C)-(X)-(A)-(B)-(C) is unfolding and 2nd (A) has possibly ended at 0.6936.
Trend: Near term down
Original strategy :
Sell at 0.8590, Target: 0.8460, Stop: 0.8630
Position : -
Target : -
Stop : -
New strategy :
Sell at 0.8485, Target: 0.8355, Stop: 0.8535
Position : -
Target : -
Stop : -
The single currency has dropped again after intra-day brief bounce to 0.8512, adding credence to our bearish view that recent decline from 0.8788 is still in progress and bearishness remains for further weakness to 0.8350, then towards 0.8320-25, however, near term oversold condition should prevent sharp fall below 0.8300, risk from there has increased for a rebound to take place later.
In view of this, would not chase this fall here and would be prudent to sell euro on recovery as 0.8490-00 should limit upside. Above said resistance at 0.8512 would suggest low is formed instead, risk a stronger rebound to 0.8545-50 but resistance at 0.8580 should remain intact, bring another decline later.
Our preferred count is that, after forming a major top at 0.9805 (wave V), (A)-(B)-(C) correction is unfolding with (A) leg ended at 0.8400 (A: 0.8637, B: 0.9491 and 5-waver C ended at 0.8400. Wave (B) has ended at 0.9413 and impulsive wave (C) has either ended at 0.8067 or may extend one more fall to 0.8000 before prospect of another rally. Current breach of indicated resistance at 0.9043 confirms our view that the (C) leg has ended and bring stronger rebound towards 0.9150/54, then towards 0.9240/50.
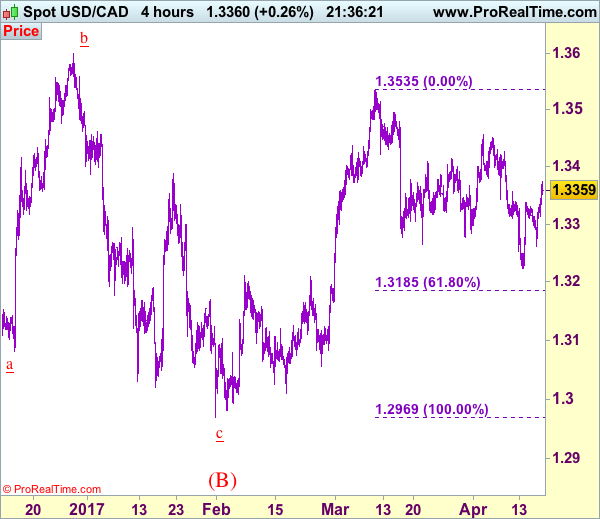
Trade Idea: USD/CAD – Exit short entered at 1.3320
USD/CAD - 1.3360
Recent wave: Only wave v of c has ended at 0.9407 and wave C of major A-B-C correction is underway for headway to 1.4700
Trend: Near term up
Original strategy :
Sold at 1.3320, Target: 1.3120, Stop: 1.3380
Position: - Short at 1.3320
Target: - 1.3120
Stop: - 1.3380
New strategy :
Exit short entered at 1.3320,
Position: -
Target: -
Stop:-
Although the greenback did retreat after meeting resistance at 1.3338, as renewed buying interest emerged at 1.3262 and the pair has staged a strong rebound today, dampening our bearishness and near term upside risk remains for the rebound from 1.3223 to extend further gain to 1.3400, then 1.3425-30, however, only break of resistance at 1.3456 would revive bullishness and signal the correction from 1.3535 has ended, bring further gain towards this level later.
In view of this, would not chase this rise here and would be prudent to stand aside in the meantime. Below 1.3310-15 would suggest an intra-day top is possibly formed, bring test of said support at 1.3262 but break there is needed to signal the rebound from 1.3223 has ended, bring retest of this level first. Looking ahead, a break of 1.3223 would signal the erratic fall from 1.3535 has resumed for weakness to 1.3180-85 (61.8% Fibonacci retracement of 1.2969-1.3535), then towards 1.3120-25.
To recap, wave B from 1.3066 is unfolding as an a-b-c and is sub-divided as a: 1.2192, b: 1.2716 and wave c is a 5-waver with i: 1.1983, ii: 1.2506, extended wave iii with minor iii at 1.0206, wave iv ended at 1.0781 and wave v as well as wave iii has ended at 0.9931, hence the subsequent choppy trading is the wave iv which is unfolding as (a)-(b)-(c) with (a) leg of iv ended at 1.0854, followed by (b) leg at 1.0108 and (c) leg as well as the wave iv ended at 1.0674. The wave v is sub-divided by minor wave (i): 0.9980, (ii): 1.0374, (iii): 0.9446, (iv): 0.9913 and (v) as well as v has possibly ended at 0.9407, therefore, consolidation with upside bias is seen for major correction, indicated target at 1.3700 and 1.4000 had been met and further gain to 1.4700 would be seen later.
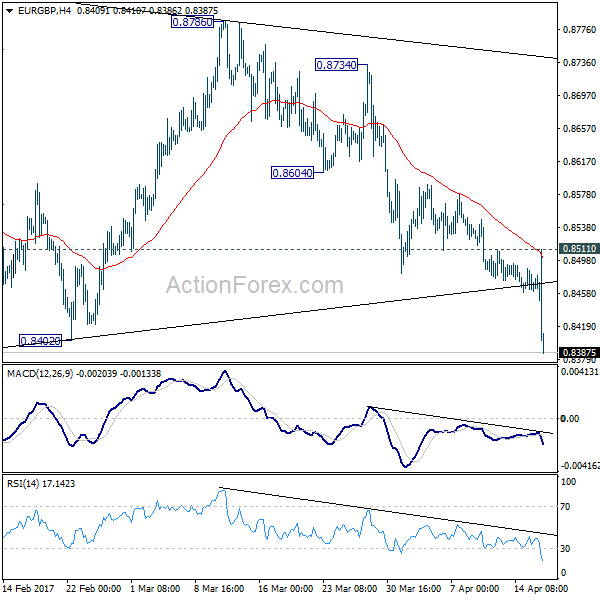
EUR/GBP Mid-Day Outlook
Daily Pivots: (S1) 0.8456; (P) 0.8473; (R1) 0.8486; More...
EUR/GBP's decline accelerates to as low as 0.8389 so far today. The break of 0.8402 should confirm completion of the consolidation pattern from 0.8303 at 0.8786. And, the correction from 0.9304 should have started the third leg. Intraday bias remains on the downside for 0.8303 support and below. At this point, we'd expect strong support from 0.8116/20 cluster support to complete the correction from 0.9304. But for now, break of 0.8511 resistance is needed to indicate short term bottoming. Otherwise, outlook will remain bearish in case of recovery.
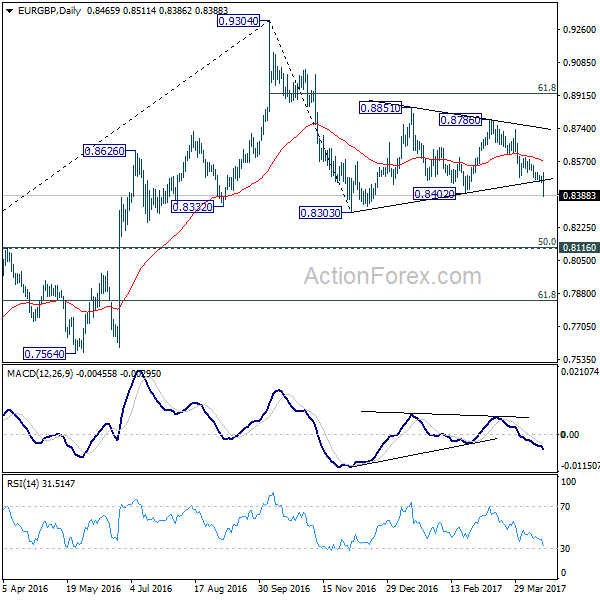
In the bigger picture, price actions from 0.9304 are viewed as a medium term corrective pattern. Such decline is likely ready to resume and should make a new low below 0.8303. At this point, we'd expect strong support from 0.8116 cluster support (50% retracement of 0.6935 to 0.9304 at 0.8120) to contain downside. Rise from 0.6935 (2015 low) will resume at a later stage to 0.9799 (2008 high). However, sustained break of 0.8116 could bring deeper decline to next key support level at 0.7564 before the correction completes.
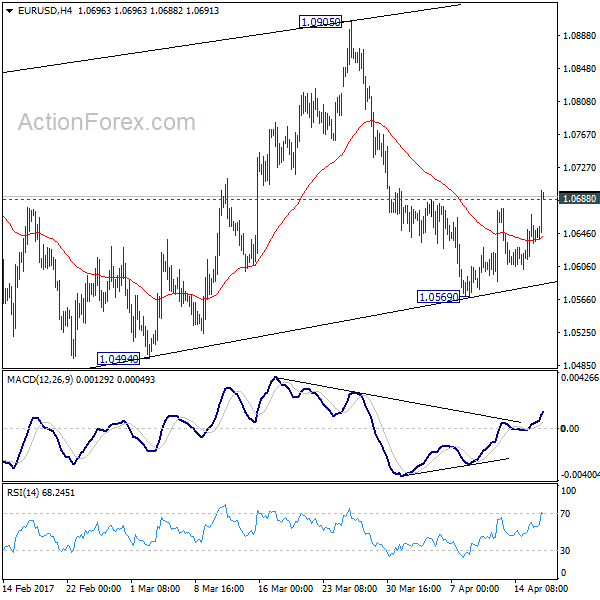
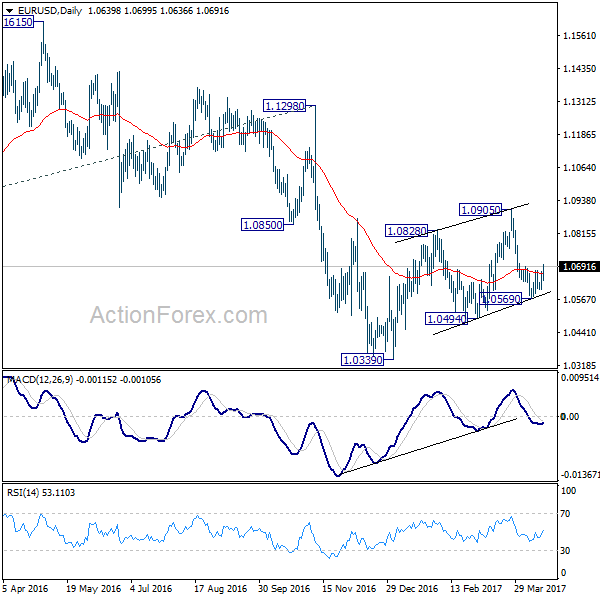
EUR/USD Mid-Day Outlook
Daily Pivots: (S1) 1.0605; (P) 1.0638 (R1) 1.0674; More....
EUR/USD's rebound form 1.0569 resumed and broke 1.0668 resistance. The development dampened our immediate bearish view. Fall from 1.0905 is completed and intraday bias is back on the upside for 1.0905 resistance. Nonetheless, price actions from 1.0339 are still viewed as a correction and thus, we'll look for topping signal above 1.0905 to complete the correction. On the downside, break of 1.0569 will revive that case that such correction from 1.0339 is completed and turn bias to the downside for 1.0494 support.
In the bigger picture, as long as 1.1298 key resistance holds, whole down trend from 1.6039 (2008 high) is still expected to continue. Break of 1.0339 low will send EUR/USD through parity to 61.8% projection of 1.3993 to 1.0461 from 1.1298 at 0.9115. However, considering bullish convergence condition in weekly MACD, break of 1.1298 will indicate term reversal. this would also be supported by sustained trading above 55 week EMA.
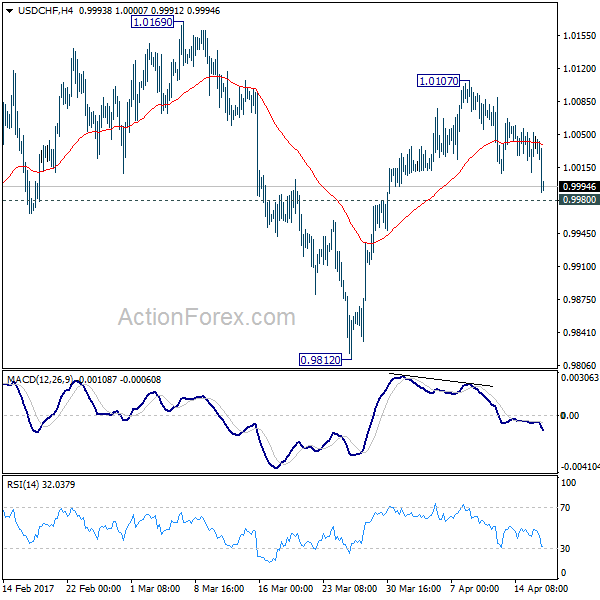
USD/CHF Mid-Day Outlook
Daily Pivots: (S1) 1.0015; (P) 1.0035; (R1) 1.0060; More.....
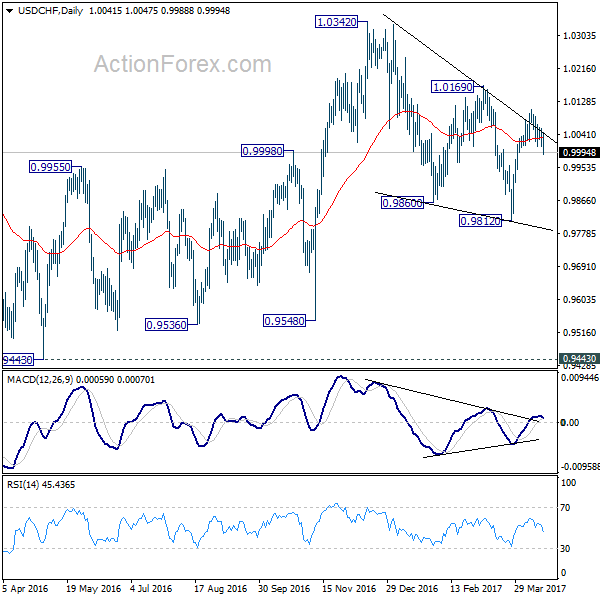
Intraday bias in USD/CHF remains neutral for the moment. Near term outlook is unchanged. That is, corrective from 1.0342 has completed with three waves down to 0.9812. And, rise from 0.9548 is resuming. On the upside, break of 1.0107 will turn bias to the upside for 1.0169 resistance. Break there should confirm our bullish view and should target a test on 1.0342 key resistance next. However, below 0.9980 will dampen this bullish case and turn bias back to the downside for 0.9812 low.
In the bigger picture, we're still maintaining that firm break of 1.0342 key resistance is needed to confirm underlying bullish momentum in the cross. However, the corrective nature of the fall from 1.0342 to 0.9812 is starting to give the medium term outlook a bullish favor. Hence, in stead of looking for topping signal around 1.0342, we'd now pay closer attention to upside acceleration as USD/CHF approaches this level again.
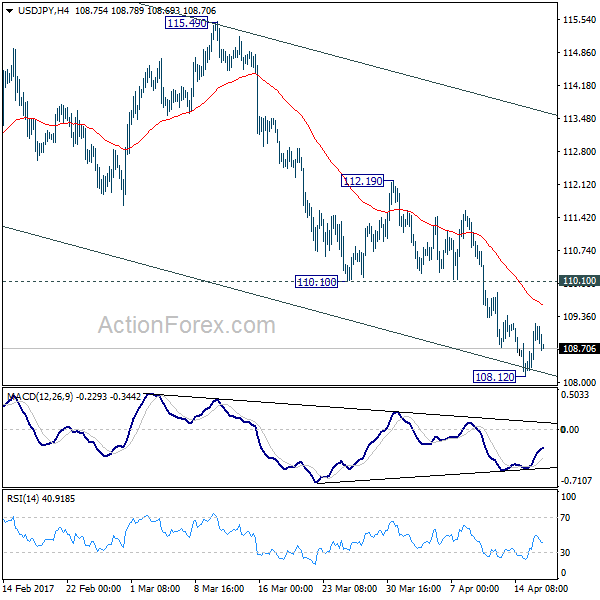
USD/JPY Mid-Day Outlook
Daily Pivots: (S1) 108.33; (P) 108.69; (R1) 109.26; More....
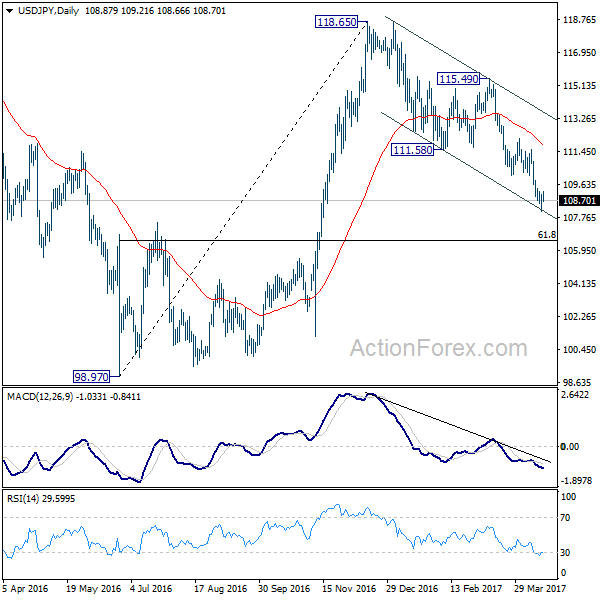
Intraday bias in USD/JPY remains neutral for the moment for consolidation above 108.12 temporary low. Near term outlook stays bearish as current development argues that rise from 98.97 is already completed at 118.65. Hence, we'd expect upside of recovery to limited by 110.10 minor resistance to bring another decline. Below 108.12 will target 61.8% retracement of 98.97 to 118.65 at 106.48. Sustained break there will pave the way back to 98.97 low. Nonetheless, break of 110.10 will be the first sign of near term bottoming and turn bias back to the upside for 112.19 resistance instead.
In the bigger picture, price actions from 125.85 high are seen as a corrective pattern. Current development suggests that it's not completed yet and is extending. In case of deeper decline, downside should be contained by 61.8% retracement of 75.56 to 125.85 at 94.77 to bring rebound. Rise from 75.56 is still expected to resume later after the correction from 125.85 completes.
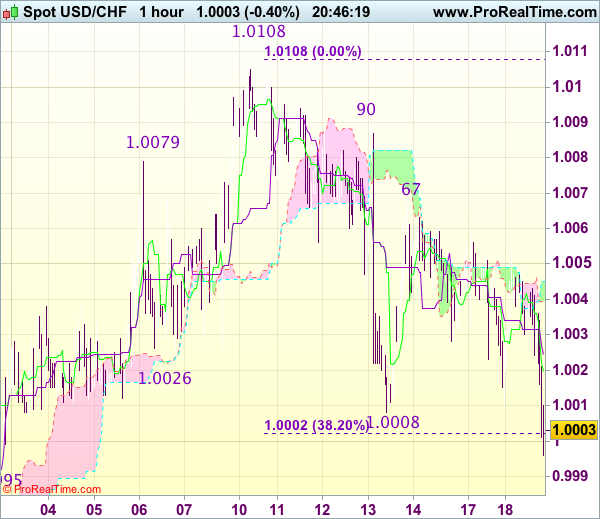
Trade Idea Update: USD/CHF – Sell at 1.0000
USD/CHF - 1.0000
New strategy :
Sell at 1.0000, Target: 0.9900, Stop: 1.0035
Position : -
Target : -
Stop : -
Current breach of support at 1.0008 signals top has been formed at 1.0108 last week and consolidation with downside bias is seen for further fall to 0.9960-67 (50% Fibonacci retracement of 0.9813-1.0108 and 100% projection of 1.0108-1.0008 measuring from 1.0067), however, reckon downside would be limited to 0.9943-48 (1.236 times projection and previous support) and 0.9926 (61.8% Fibonacci retracement) would hold, bring rebound later.
In view of this, would not chase this fall here and would be prudent to sell dollar on recovery as 1.0020 should limit upside, bring another decline. Above 1.0050-55 would suggest low is possibly formed but break of resistance at 1.0067 is needed to add credence to this view, brig test of key resistance at 1.0090 first.
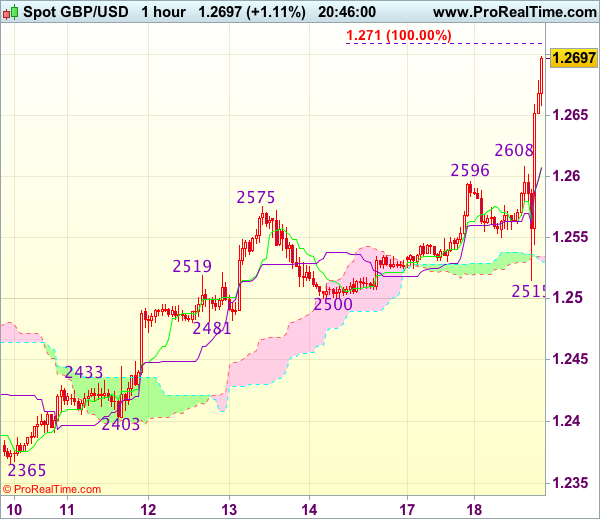
Trade Idea Update: GBP/USD – Buy at 1.2650
GBP/USD - 1.2719
Original strategy :
Buy at 1.2510, Target: 1.2610, Stop: 1.2475
Position : -
Target : -
Stop : -
New strategy :
Buy at 1.2650, Target: 1.2750, Stop: 1.2615
Position : -
Target : -
Stop : -
As cable has rallied again after finding renewed buying interest at 1.2515, signaling recent upmove is still in progress and bullishness remains for recent rise from 1.2109 to extend further gain to 1.2755-60 (1.236 times projection of 1.2365-1.2575 measuring from 1.2500), however, reckon previous resistance at 1.2775 would limit upside and risk from there is seen for a retreat to take place later.
In view of this, would not chase this rise here and would be prudent to buy cable on subsequent pullback as 1.2650-55 should limit downside and bring another rise later. Below previous resistance at 1.2616 (now support) would defer and risk correction to 1.2570-75 and possibly 1.2545-50 but price should stay well above support at 1.2515 and bring another upmove.