Sample Category Title
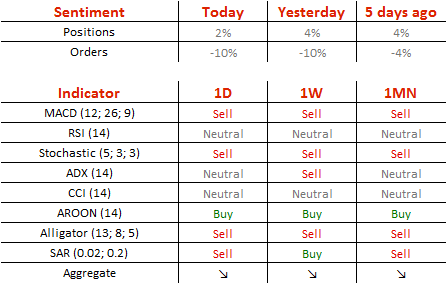
Technical Outlook: Aussie Fell Sharply After Recovery Rally Failed To Break Above Daily Cloud
The Aussie dollar accelerated sharply lower on Tuesday after strong four-day recovery rally was capped by daily Kijun-sen at 0.7608 after brief probe above daily cloud on Monday.
Fresh weakness was triggered by release of minutes for Australian central bank's April meeting that suggested caution on rate views.
Strong pullback that so far retraced 50% of 0.7471/0.7608 rally also broke below 200SMA at 0.7550 that may further weaken near-term structure on daily close below.
Daily Tenkan-sen at 0.7540 has been dented and bears are pressuring next pivot at 0.7523 (Fibo 61.8% of 0.7471/0.7608), loss of which will confirm reversal.
Slow stochastic emerged from oversold territory and shows plenty of space at the downside, as daily MA's are returning into full bearish setup and daily indicators are in negative territory, supporting for further easing.
However, strongly oversold near-term studies suggest a pause in current fall. Corrective attempts should be capped by hourly cloud (spanned between 0.7554/77) which now reverted to resistance.
Res: 0.7550, 0.7577, 0.7583, 0.7594
Sup: 0.7536, 0.7523, 0.7503, 0.7471
EUR/USD Elliott Wave Analysis
EUR/USD – 1.0660
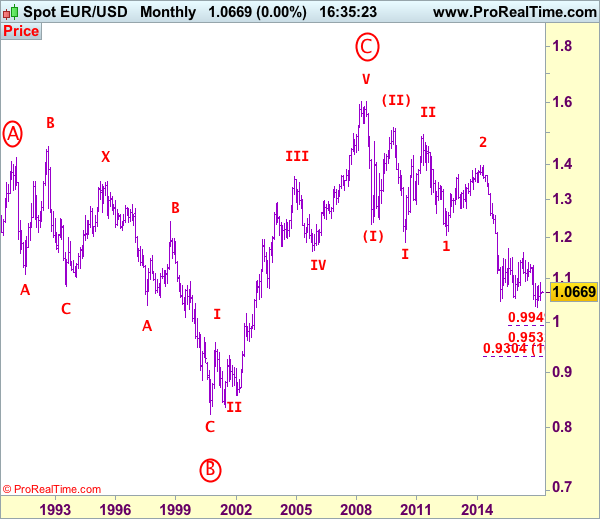
EUR/USD: Wave (c) of 2 ended at 1.3993 and wave 3 of III has commenced for weakness to 1.0411 (1.236 of wave 1), then 1.0000.
As the single currency has recovered after finding support at 1.0570, suggesting consolidation above this level would be seen and initial upside risk is for corrective bounce to 1.0700, however, reckon upside would be limited to 1.0740-50 and bring another decline later, below said support at 1.0570 would extend the fall from 1.0906 to 1.0525 but a daily close below support at 1.0493 is needed to confirm correction from 1.0340 low has ended at 1.0906, bring further fall to 1.0450-55. Looking ahead, below there would signal early downtrend has resumed and extend fall to 1.0400 and later towards this year’s low at 1.0340 later.
Our preferred count on the daily chart remains that a wave (II) from 1.2329 ended at 1.5145 with A-leg ended at 1.4720, followed by wave B at 1.2457, the wave C from there was also a 3 legged move and is labeled as (a): 1.3739, (b): 1.2885, the wave iii of the 5-waver (c) from 1.2885 has ended at 1.4339 and wave iv is a triangle ended at 1.3878 and wave v formed a top at 1.5145. The decline from there is a 5-waver (C) with minor wave (i) of I of (C) ended at 1.4218 with wave (ii) ended at 1.4580, wave (iii) ended at 1.3267 and wave (iv) ended at 1.3692 and wave (v) ended at 1.1876, this is also the low of wave I of (C) and wave II ended at 1.4940, hence wave III is now in progress with a diagonal wave 1 ended at 1.2042, the breach of previous support at 1.1876 (wave I trough) adds credence to our view that the wave 2 has ended at 1.3993, wave 3 has commenced for further weakness to 1.0411, then towards 1.0000.
On the upside, whilst initial recovery to 1.0700 cannot be ruled out, reckon upside would be limited to 1.0730-40 and bring another decline. Above 1.0765-70 would defer and suggest first leg of decline from 1.0906 has ended, bring a stronger rebound to 1.0800-10 but price should falter well below 1.0870-75 and bring another decline. In the unlikely event euro breaks above resistance at 1.0906, this would shift risk back the upside for the erratic rise from 1.0340 low to bring retracement of early downtrend to 1.0930-35 (61.8% Fibonacci retracement of 1.1300-1.0340), then 1.1000.
Recommendation: Sell at 1.0735 for 1.0535 with stop above 1.0835.
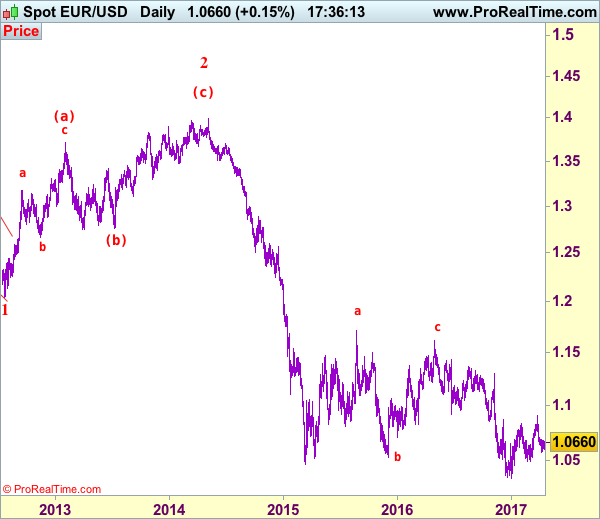
Euro's long-term uptrend started from 0.8228 (26 Oct 2000) with an impulsive structure. The rise from 0.8228 to 0.9593 (5 Jan 2001) is labeled as wave I, the retreat to 0.8352 (6 Jul 2001) is wave II and the rally to 1.3670 (31 Dec 2004) is wave III. Wave IV from there ended at 1.1640 (15 Nov 2005), the subsequent upmove to 1.6040 (July 15, 2008) is treated as wave V, the major selloff from the record high of 1.6040 to 1.2329 (October 27, 2008) signals a reversal has taken place with (I) leg ended at 1.2329 and once (II) ended at 1.5145, wave (III) itself is an extended move with I: 1.1876 and complex wave II ended at 1.4902, wave III has commenced with wave 1 and 2 ended at 1.2042 and 1.3993 respectively, wave 3 of III is now unfolding for weakness towards parity.
USD/JPY Elliott Wave Analysis
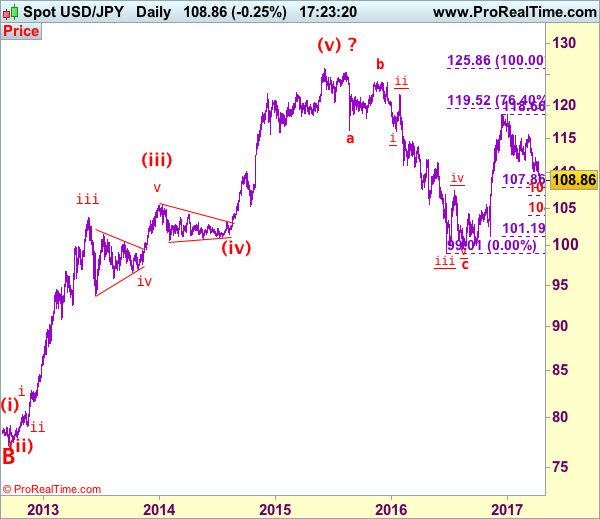
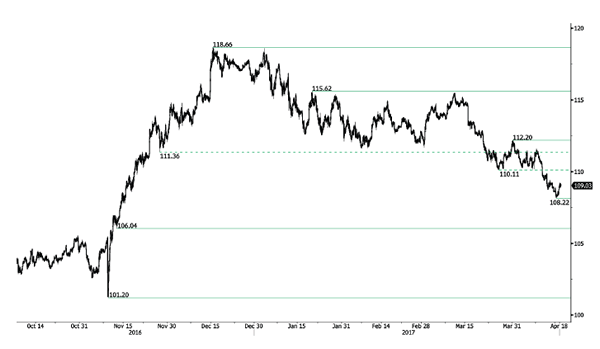
USD/JPY - 108.86
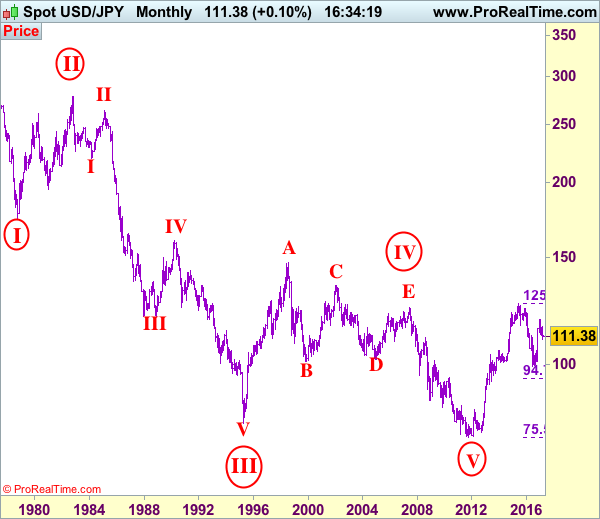
USD/JPY – Wave V of larger degree circle V has possibly ended at 75.31 and major correction has commenced and already met indicated target at 125.00.
The greenback only recovered to 111.58 early last week before meeting renewed selling there and price dropped quite sharply from there in line with our bearish expectation, this selloff adds credence to our view that top has been formed at 118.66 and the decline from there is still in progress for further weakness to 118.10-15, below there would extend weakness to 107.85-90 (61.8% Fibonacci retracement of 101.19-118.66), then towards 107.10-20 but reckon 106.75-80 (1.236 times projection of 118.66-111.59 measuring from 115.51) would limit downside and 106.00 should hold, bring rebound later due to oversold condition.
Our preferred count is that, triangle wave IV (with circle) ended at 101.45 and the circle wave V brought dollar down to the record low of 75.31 in 2011 and the subsequent rebound signal major correction has commenced with A leg ended at 84.19, followed by wave B at 77.14 and impulsive wave C is now unfolding (indicated upside target at 125.00 had been met) for gain towards 127.00 level. In the event dollar drops below support at 99.01, this would confirm medium term decline from 125.86 top (2015 high) has resumed for subsequent weakness to 98.00 and possibly 97.00.
Under this count, this wave C is unfolding as impulsive waves with (1) (2), 1 2 ended at 80.67, 79.07, 82.84 and 81.69 respectively, hence the extended wave 3 has ended at 103.74 and wave 4 correction of recent upmove should bring weakness to 92.57, then towards 90.88 but psychological support at 90.00 should limit downside and bring another rally later in wave 5, indicated target at 125.00 had been met and gain to 127.00 cannot be ruled out but reckon price would falter below 130.00.
On the upside, although the rebound from 108.13 (yesterday’s low) suggests consolidation above this level would be seen with initial upside risk for corrective bounce to 110.00, reckon 110.50-60 would limit upside and bring another decline later. Only break of said resistance at 111.58 would abort and suggest a temporary low is formed instead, bring a stronger rebound to resistance at 112.20.
Recommendation: Sell at 110.60 for 108.60 with stop above 111.60.
On the monthly chart, we have changed our preferred count that an impulsive wave is unfolding with major wave III with circle ended at 79.75, then followed by wave IV with circle and is labeled as a triangle with A: 147.64 (11 August, 1998), B: 101.25, C: 135.20, D: 101.67 and E leg ended at 124.14 to end the wave IV with circle. Hence, wave V with circle commenced from there and hit a record low of 75.31, however, the subsequent strong rebound signals this circle wave V has possibly ended there, hence gain to (indicated upside target at 122.00 and 125.00 had been met), the retreat from 125.86 suggests wave A of major correction has ended there and wave B correction back to 99.00, then 95.00 would be seen, however, reckon downside would be limited to 90.00, bring another rebound in wave C next year.
USD/CHF Still Weak Within Range, USD/CAD Weak Bounce. AUD/USD Fading Near The Resistance At 0.7610.
USD/CHF Still weak within range.
USD/CHF failed to breach 1.0107 dropping sharply to support. The short-term technical structure is negative as long as prices remain below the hourly resistance at 1.0171 (07/03/2017). Hourly support is given at 1.0009 (13/04/2017 base low) then 0.9814 (27/03/2017 low).
In the long-term, the pair is still trading in range since 2011 despite some turmoil when the SNB unpegged the CHF. Key support can be found 0.8986 (30/01/2015 low). The technical structure favours nonetheless a long term bullish bias since the unpeg in January 2015.
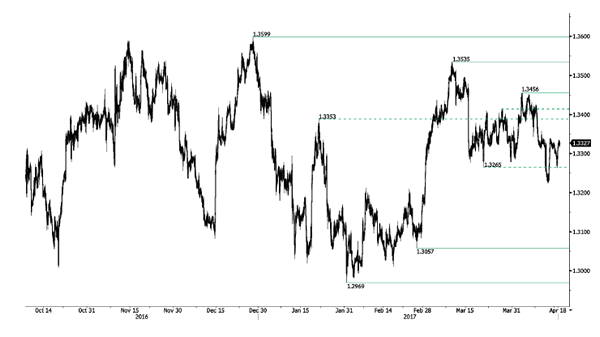
USD/CAD Weak bounce.
USD/CAD has broken the support at 1.3265 confirming an underlying bearish trend. Hourly resistances can now be found at 1.3340 (intraday high) and 1.3456 (04/04/2017 high). Support is given at 1.2969 (31/01/2017 low).
In the longer term, there is a golden cross with the 50 dma crossing the 200 dma indicating further upside pressures. Strong resistance is given at 1.4690 (22/01/2016 high). Long-term support can be found at 1.2461 (16/03/2015 low).
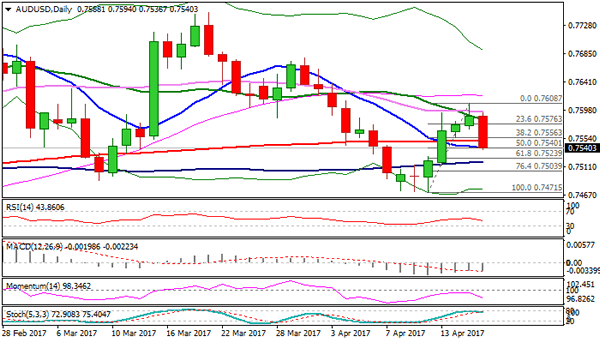
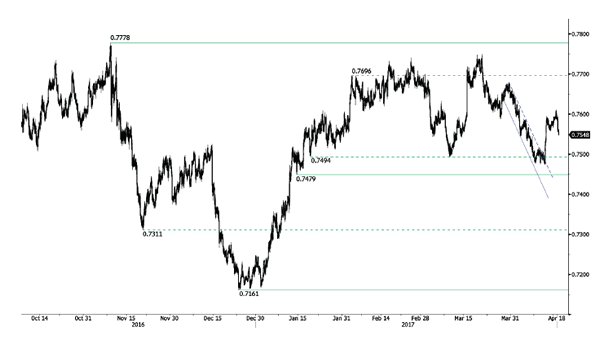
AUD/USD Fading near the resistance at 0.7610.
AUD/USD has failed to break short term resistance at 0.7610, reversing bullish momentum. Key resistance stands at 0.7681 (30/03/2017 high). Hourly support is located at 0.7449 (13/01/2017 low).
In the long-term, we are waiting for further signs that the current downtrend is ending. Key supports stand at 0.6009 (31/10/2008 low) . A break of the key resistance at 0.8295 (15/01/2015 high) is needed to invalidate our long-term bearish view.
EUR/USD Test Of Resistance, GBP/USD Pushing Higher, USD/JPY Weak Bounce.
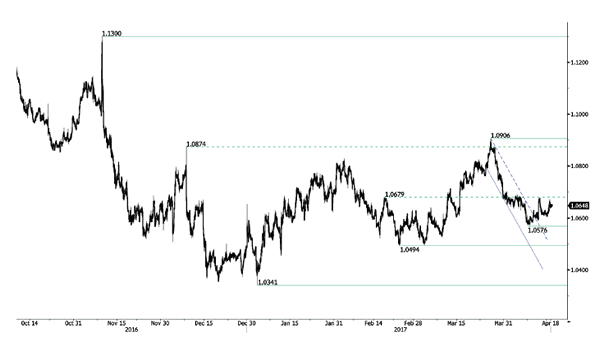
EUR/USD Test of resistance.
EUR/USD has improved, yet failure to break resistance suggest a reversal. Monitor the resistances area given by 1.0679. Hourly support can be found at 1.0650 (intraday base) then 1.0570 (11.04.2017 low). Stronger support can be found at 1.0494 (22/02/2017 low). A key resistance stands at 1.0874.
In the longer term, the death cross late October indicated a further bearish bias. The pair has broken key support given at 1.0458 (16/03/2015 low). Key resistance holds at 1.1714 (24/08/2015 high). Expected to head towards parity.
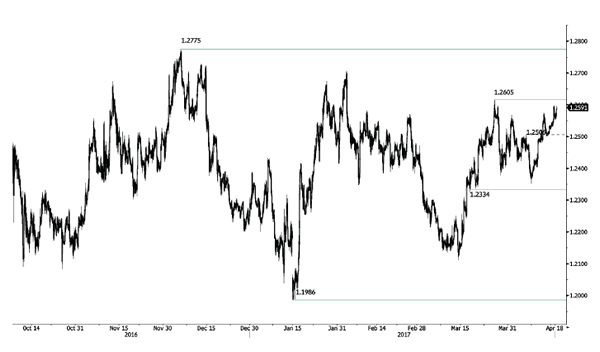
GBP/USD Pushing higher.
GBP/USD has rallied off key support at 1.2334, suggesting a potential short-term base formation. Key resistance stands at 1.2605 (27/03/2017 high). An hourly support can be found at 1.2581 (12/04/2017 base) then 1.2405 (11/04/2017 low).
The long-term technical pattern is even more negative since the Brexit vote has paved the way for further decline. Long-term support given at 1.0520 (01/03/85) represents a decent target. Long-term resistance is given at 1.5018 (24/06/2015) and would indicate a long-term reversal in the negative trend. Yet, it is very unlikely at the moment.
USD/JPY Weak bounce.
USD/JPY has broken to the downside out of the horizontal support at 110.11 confirming a bearish bias. Next support can be located at 108.22 (intraday low). Other key supports lie at a distant 106.04 (11/11/2016 low). Resistance can be found at 110.11, while a key resistance stands at 112.20 (31/03/2017 high).
We favor a long-term bearish bias. Support is now given at 96.57 (10/08/2013 low). A gradual rise towards the major resistance at 135.15 (01/02/2002 high) seems absolutely unlikely. Expected to decline further support at 93.79 (13/06/2013 low).
Commodities Fall As Mnuchin Trumps The Dollar
Treasury Secretary Mnuchin's strong dollar comments saw the greenback rally across most asset classes.
PRECIOUS METALS
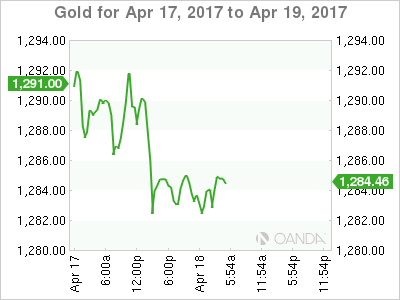
Gold fell from its high above 1295 to 1280 overnight, but gold has made a sprightly start in Asian trading, up five dollars to the 1285 level in the early part of the session, before drifting back to 1283.
This reinforces the view that gold is trading as a function of safe haven demand, with ongoing geopolitical tensions meaning that dips will be eagerly sought by investors and traders alike. This weekend's French Presidential first round elections are looking increasingly murky, and this will most likely fan those haven fires.
Gold has initial support at 1280 with major support at the 1255/60 region, the break-out and the 200-day moving average. Above, gold has resistance at 1296, 1300 and 1308. In all likelihood though, it will be news headlines and opinion polls that drive gold's short-term direction.
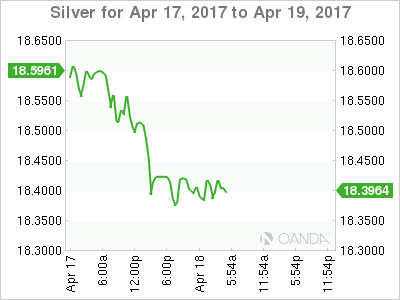
Silver suffered much the same fate as gold overnight and for exactly the same reasons. Silver fell from 18.6600 to close at 18.4100 for the New York session. More concerningly, silver has traced an outside reversal day on the daily charts which are a bearish formation in this case. However one could qualify this, as the move has occurred in a low liquidity holiday market. One suspects that silver will trade on the news as well and not technicals.
Silver has support at 18.3500 initially with possibly some weak long liquidation if it breaks. Behind this, we have support at 18.2500 and then the 200-day moving average at 18.0500.
Resistance lies intra-day at 18.4500 and then yesterday's high at 18.6550.
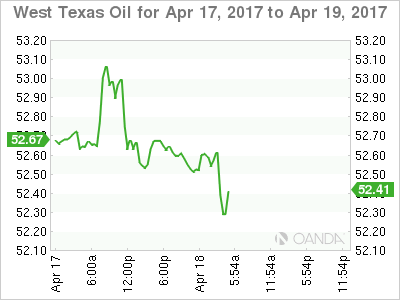
OIL
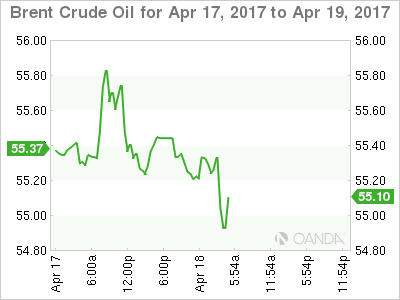
Both Brent Crude and WTI fell by approximately one percent overnight to leave both hovering just above short-term support in early Asian trading. In a holiday-thinned market, Treasury Secretary Mnuchin's comments were the start of the rot. As the USD rallied across the board, this prompted short-term profit taking in crude as well.
Traders will be eyeing the $55.00 and $52.50 levels for Brent and WTI spot nervously this morning, with a break of either possibly prompting another wave of selling to flush out weak longs. As liquidity is still below average following the Easter break, short term moves could be exacerbated.
The above levels aside, Brent spot has support at $54.00, it's 100-day moving average, with resistance at $56.00 and then $56.50.
WTI spot has support at $51.40, its 100-day moving average, with resistance at the $53.60 region.
Summary
Despite the comments by Mnuchin causing dollar strength, its effect may be temporary given the event risk around the world at the moment. After pausing for breath, precious metals may find support along with oil as the street trades of news headlines this week.
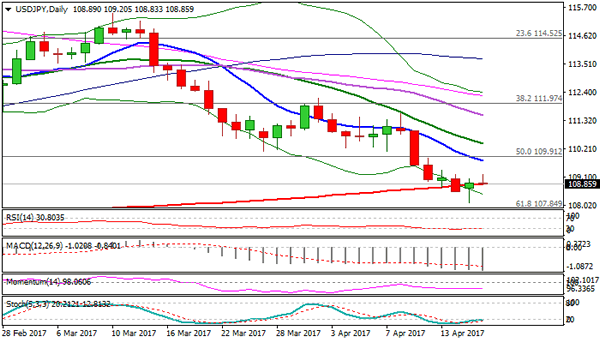
Technical Outlook: USDJPY – Strong Bearish Sentiment Sees Limited Recovery Before Fresh Downside
The pair is holding around 109.00 handle in early European trading, after hitting fresh recovery high at 109.20 in Asia and being so far supported by 200SMA, which reverted to support after recovery broke and close above it.
Monday’s long-tailed daily candle that was formed after strong downside rejection (the pair hit fresh five-month low at 108.11 on Monday) underpins and may spark stronger correction as slow stochastic is emerging from oversold territory and daily RSI is on the border of oversold zone.
However, negative daily studies see limited upside action, before bears resume, as general sentiment is firmly bearish on geopolitical tensions that favor yen’s safe haven buying.
Falling 10SMA offers strong barrier (currently at 109.74) which should ideally cap and keep intact upper pivots at 110.00/25 (psychological barrier/Fibo 61.8% of 111.56/108.11 downleg), break of which is needed to signal stronger recovery.
Conversely, early recovery rejection and return below 200SMA would signal an end of corrective phase and shift near-term focus lower again.
Res: 109.20, 109.74, 110.00, 110.25
Sup: 108.82, 108.55, 108.11, 107.84
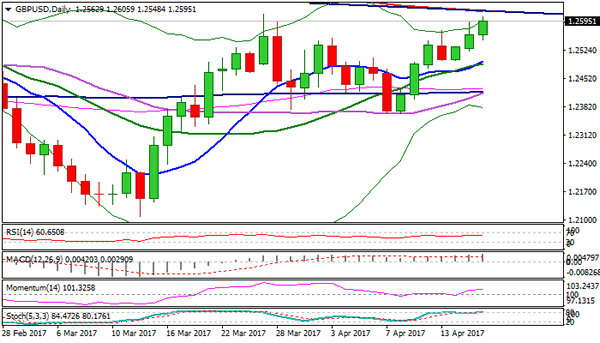
Technical Outlook: Cable Cracked 1.2600 Barrier, Eyes Pivotal 200SMA / Trendline Resistance
Cable cracked psychological 1.2600 on fresh strength from correction low at 1.2548, hit in Asia, after Monday's rally stalled at 1.2594.
The pair extends rally from 1.2500 higher base and pressures targets at 1.2613 (27 Mar high) and 1.2620 (200SMA / bear-trendline connecting 06 Dec/ 02 Feb tops).
Technical studies are bullish on all timeframes and favor final break above 1.2613/20 pivots for extension towards 1.2704 (02 Feb high).
Overbought slow stochastic on daily chart suggests consolidation, but without firmer bearish signals for now.
Session low at 1.2548 marks initial support ahead of Monday's low at 1.2521 and higher base at 1.2500, reinforced by 10/20SMA bull-cross at 1.2488.
Res: 1.2605, 1.2613, 1.2620, 1.2671
Sup: 1.2548, 1.2521, 1.2500, 1.2488
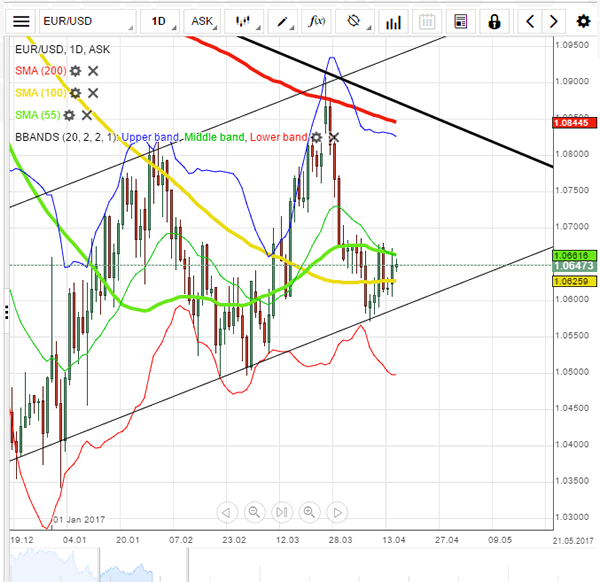
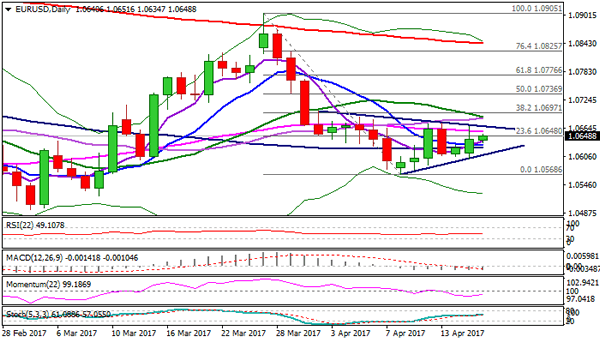
Technical Outlook: EURUSD – 10SMA And Rising Daily Cloud Underpin But Close Above 55SMA Is Needed To Signal Further...
The Euro is holding above a cluster of good supports which lay between 1.0628 and 1.0614, consisting of 10/100SMA's and daily cloud top and underpinning near-term action. Monday's break above 10SMA and acceleration to 1.0669 was bullish signal, however, the rally failed to close above 55SMA (1.0657) and confirm bullish continuation. Bullishly aligned near-term studies are supportive for renewed attempts higher and attack at key barriers at 1.0676 (12/13 Apr double recovery rejection) and 1.0700 (Fibo 38.2% of 1.0905/1.0568 descend) break of which would signal fresh extension of recovery phase from 1.0568 (10 Apr low). Caution on probes below 10/100SMA's which may soften near-term structure, as daily technicals are in mixed mode and show no clear direction for now.
Res: 1.0651, 1.0669, 1.0676, 1.0700
Sup: 1.0628, 1.0614, 1.0601, 1.0583
EUR/USD Analysis: Trades Near 1.0650 Mark
'France's presidential race enters its final stretch with no clear winner in sight as the main contenders scrap for votes in a flurry of campaign rallies.' – Geraldine Amiel and Vidya Root, Bloomberg
Pair's Outlook
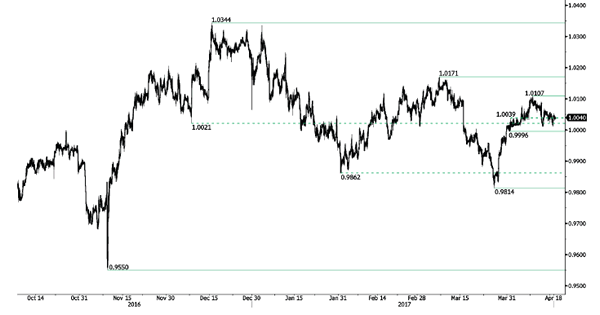
On Tuesday morning the common European currency fluctuated against the US Dollar just above the 23.60% Fibonacci retracement level, which is located at the 1.0639 level. The rate had retreated to the retracement level due to bouncing off from the resistance put up by the weekly R1, which is located at the 1.0672 level. It is most likely that the currency exchange rate will rebound against the Fibonacci retracement level and continue on its path higher. However, the strong resistance cluster just above it, near the 1.0680 mark, will hinder the rates surge.
Traders' Sentiment
Traders are almost neutral, as 51% of open positions are long. Meanwhile, 55% of set up orders are to sell the Euro.