
Sample Category Title
Foreign Exchange Market Commentary: EUR/USD, USD/JPY, GBP/USD, GOLD, WTI CRUDE, DJIA, FTSE 100, DAX
EUR/USD
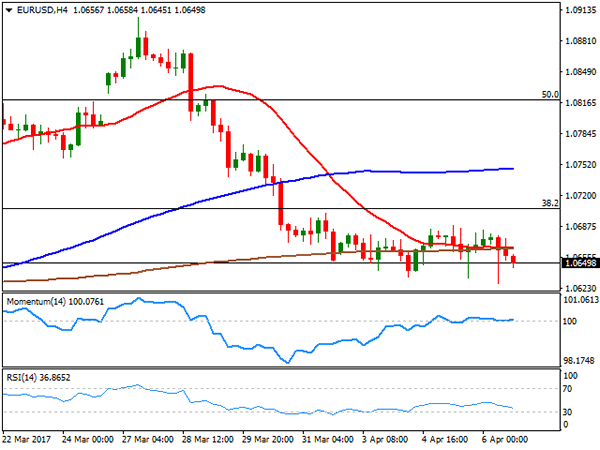
The EUR/USD pair continued trading uneventfully for a fourth consecutive day, settling around 1.0650 this Thursday, where it spent all of the week. The common currency came under moderate pressure early Europe, extending its weekly slide by a few pips, to 1.0628, following a press conference offered by ECB's Draghi, who dampened expectations of a tighter monetary policy, as he said, referring to policy makers, "we still need to build sufficient confidence that inflation will indeed converge to our aim over a medium-term horizon, and will remain there even in less supportive monetary policy conditions."
In the macroeconomic front, Germany released February factory orders, which rose by 3.4% in February, slightly below the 3.5% expected and better than a previously revised -6.8%. In the US, weekly unemployment claims for the week ending March 31st accounted 234K, better than the 250K expected, giving support to the greenback and Wall Street, ahead of the release of the US Nonfarm Payroll report this Friday. As usual lately, the market is heading into the report with high expectations, fueled by the ADP survey.
From a technical point of view, the pair maintains it’s the neutral-to-bearish stance, having traded within 60 pips ever since the week started. The 4 hours chart shows that the price settled below the 20 and 200 SMAs, both converging in the 1.0670 region, whilst the Momentum heads nowhere around its 100 level, and the RSI heading lower around 35. The immediate support comes at 1.0620, with a break below it on a strong Payroll exposing 1.0590 and 1.0565 later, whilst 1.0710 is the key resistance to surpass to see the common currency advancing further.
Support levels: 1.0620 1.0590 1.0565
Resistance levels: 1.0675 1.0710 1.0745
USD/JPY
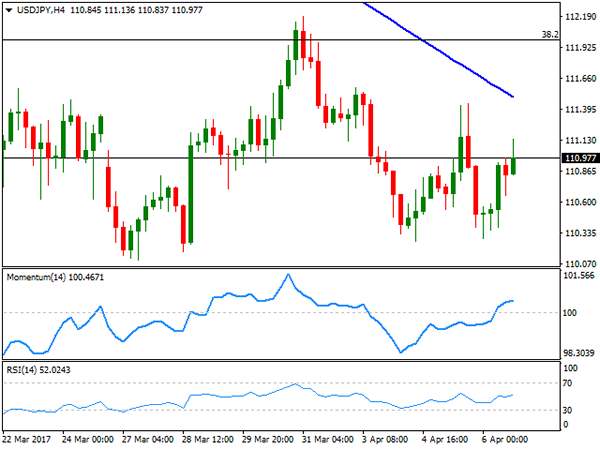
The USD/JPY pair recovered the ground lost post-Fed, rallying up to a daily high of 111.13, to settle around the 111.00. Nevertheless, the yen remains strong heading into the US Nonfarm Payroll report, amid softer US Treasury yields and the poor performance of equities during the Asian and European sessions. Japanese consumer confidence released during the past Asian session surged to its highest since September 2013, printing 43.9 from previous 43.1, also beating expectations of 43.5, although the news failed to affect the yen. Much of the upcoming direction of the pair depends on the outcome of the US employment report, as the safe-haven currency tends to be the most sensitive to US data. From a technical perspective, the upward potential remains limited according to the 4 hours chart, as the price remains below a bearish 100 SMA, currently around 111.50, whilst indicators in the mentioned time frame barely stand in positive territory with limited upward strength. The pair has a major Fibonacci resistance at 112.00, the 38.2% retracement of the late 2016 monthly rally, with an extension above it favoring additional gains for the following sessions.
Support levels: 110.95 110.50 110.10
Resistance levels: 111.60 112.00 112.50
GBP/USD
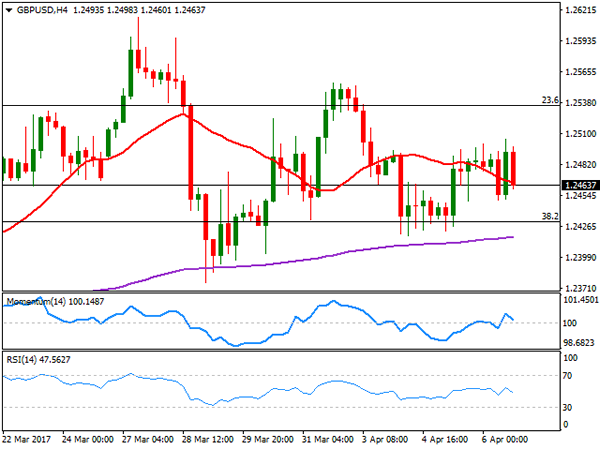
The GBP/USD pair is marginally lower at the end of the day, still contained by selling interest around 1.2500. The pair peaked at 1.2505, but retreated to current 1.2460 region, having hovered around it for the last three days. There were no macroeconomic releases in the UK, but on Friday, the kingdom will release multiple fundamental readings, including manufacturing and industrial production, the goods trade balance, and the Halifax house prices index. Although none of them is considered first-tier data, the reports may offer a clear picture of the health of the local economy. Soft readings, now that the Brexit has been officially triggered, could weigh further in the Pound. The pair bottomed at 1.2450 this Thursday, now the immediate support, although a more relevant one comes at 1.2410, and only below this last the pair can gain bearish momentum. Technical readings in the 4 hours chart present a neutral-to-bearish stance, as the price is holding around a modestly bearish 20 SMA, whilst technical indicators have turned lower around their mid-lines, with not enough directional strength to suggest the next move.
Support levels: 1.2450 1.2410 1.2370
Resistance levels: 1.2490 1.2540 1.2585
GOLD
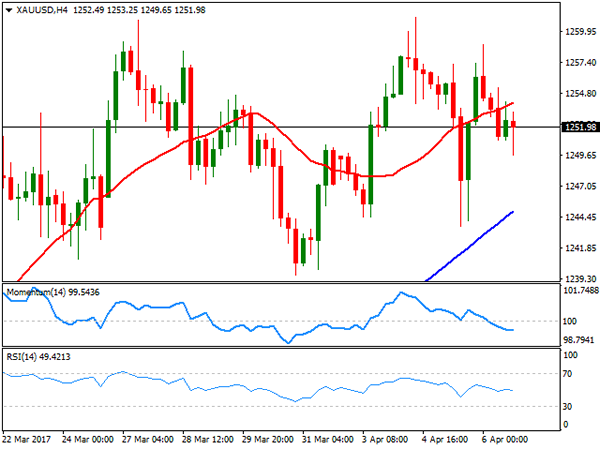
Spot gold closed the day marginally lower at $1,251.90 a troy ounce, as market's mood improved during the past American session, with stocks and the greenback higher. Softer physical demand in Asia affected prices at the beginning of the day, although the intraday decline was limited, amid the absence of strong clues. The price holds near its recent highs, but technical readings in the daily chart indicate that the upward potential keeps fading, given that technical indicators have extended their declines within positive territory. Still the price is holding above its 20 and 200 SMAs, with the shortest crossing above the largest for the first time this year, both around 1,242.30 and providing a strong dynamic support. In the 4 hours chart, the price is below a bullish 20 SMA, whilst technical indicators are entering negative territory with limited bearish slopes, not enough to confirm a bearish extension, but clearly indicating diminishing buying interest.
Support levels: 1,249.45 1.242.30 0 1,230.00
Resistance levels: 1,258.30 1,263.80 1,272.80
WTI CRUDE
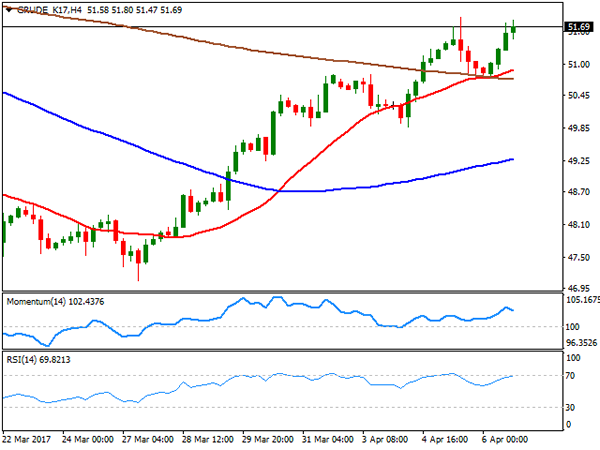
Crude oil prices resumed their advance this Wednesday, with West Texas Intermediate crude futures settling at $51.70 a barrel, not far from the near 1-month high reached this week at 51.88. There was no certain catalyst for the recovery, although expectations of strengthening demand in Asia and hopes the OPEC may extend its output cut deal, may have helped. Concerns over US increasing production, however, are still high and may affect the commodity in any sentiment swing. Technical readings in the daily chart indicate that futures may advance further, as technical indicators accelerated above their mid-lines now at fresh monthly highs, whilst the 20 DMA gained upward strength far below the current level. The 100 DMA still offers an intermediate resistance at 52.20. Shorter term, and according to the 4 hours chart, the price stands above all of its moving averages, with the 20 SMA extending above the largest ones and maintaining it bullish slope, whilst technical indicators have pared their advance near overbought readings, but are far from changing course, overall favoring a new leg higher on an advance beyond the mentioned 52.20.
Support levels: 51.30 50.80 50.30
Resistance levels: 52.20 52.90 53.60
DJIA
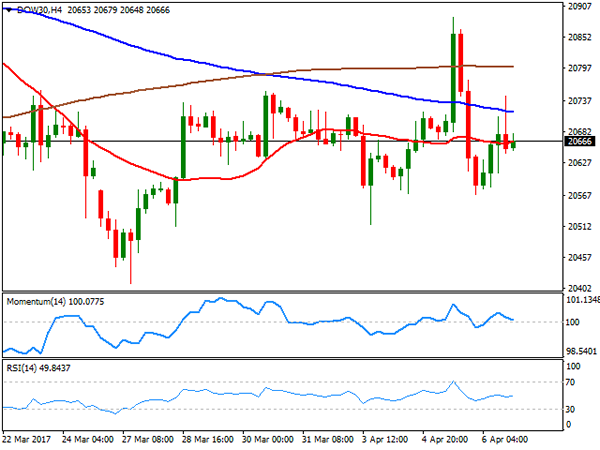
US indexes managed to post some modest daily gains this Thursday, with the Dow Jones Industrial Average adding 14 points to 20,662.95, while the S&P added 0.19%, to 2,357.49. The Nasdaq Composite gained 14 points and closed at 5,878.95. Stocks were on pause, ahead of the US Nonfarm Payroll report, and with President Trump going into a two-day meeting with his Chinese counterpart, Xi Jinping. Retailers led the advance, but within the DJIA, Caterpillar was the best performer, adding 1.62%, and followed by Exxon Mobil that gained 0.60%. Procter & Gamble led decliners, shedding 0.66%. The daily chart for the Dow shows that, once again, the index met selling interest on an advance towards a modestly bearish 20 DMA, currently at 20,720, although technical indicators have turned modestly higher, still holding within neutral territory and lacking enough strength to confirm a new leg higher. In the shorter term, and according to the 4 hours chart, the index maintains a neutral stance, standing below the 100 and 200 SMAs, but stuck around a horizontal 20 SMA, and with technical indicators heading nowhere around their mid-lines. The index will likely respond to the release of the US Nonfarm Payroll report better than the greenback, as a positive number will likely build confidence among stocks' traders.
Support levels: 20,616 20,562 20,515
Resistance levels: 20,720 20,754 20,790
FTSE 100
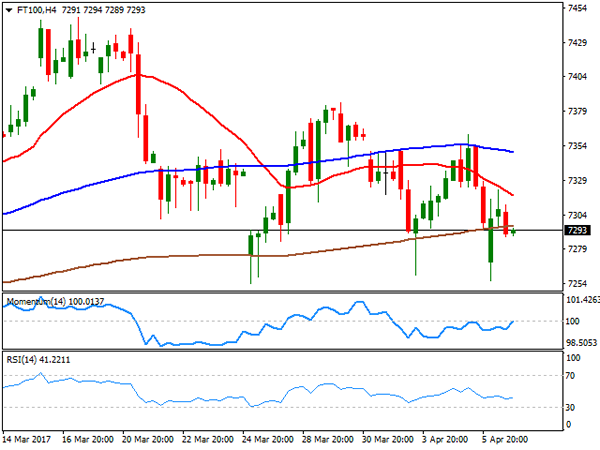
The FTSE 100 lost 28 points or 0.39%, and closed at 7,303.20, as FOMC Minutes dented market's sentiment, by indicating their will to shrink the balance sheet later this year. Risk aversion dominated the first half of the day, with the banking sector suffering the most across the region. Within the Footsie, EasyJet was the best performer, adding 4.23%, followed by British Land that gained 2.25% and Persimmon, up 2.14%. Shire led declines, shedding 1.91%, while Pearson lost 1.77% after going ex-dividend. The daily chart for the index shows that the risk remains towards the downside as its settled a lower low and a lower high daily basis, remaining below its 20 DMA and with indicators heading marginally lower within negative territory. In the 4 hours chart, the index is a few points below its 200 SMA, whilst a bearish 20 SMA capped the upside at the beginning of the day, and technical indicators hold below their mid-lines, with no directional strength.
Support levels: 7,254 7,210 7,173
Resistance levels: 7,349 7,387 7,415
DAX
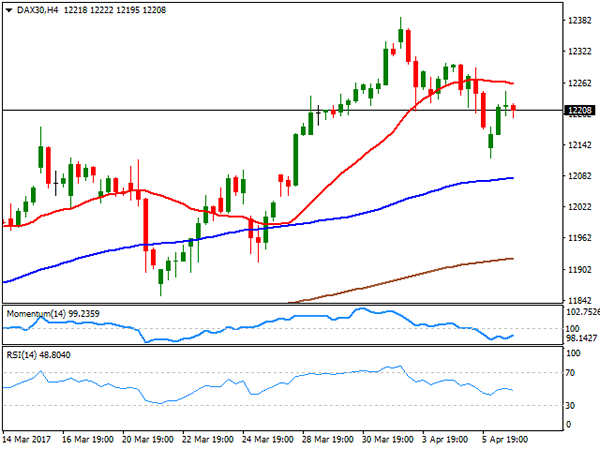
European major indexes closed mixed, as a dovish Draghi added to an already sour sentiment. The German DAX, however, managed to advance 13 points, to 12,230.89, despite ECB's head indicated that it's too early to consider tightening the monetary policy. Utilities and real estate stocks led the way higher in the region, and within the DAX, RWE AG was the best performer, ending 1.56% higher followed by Adidas that gained 1.14%. Commerzbank led decliners, shedding 0.84%, followed by Heidelberg Cement that closed 0.40% lower. The index posted a lower low for a fourth consecutive session, but bounced sharply from a bullish 20 DMA, whilst technical indicators also managed to recover from their mid-lines, limiting the downside. In the 4 hours chart, the index settled below a horizontal 20 SMA, whilst technical indicators present a soft tone within negative territory, indicating that in the short term, the benchmark may fall further. A recovery above 12,245, the daily high, would on the contrary favor a recovery, particularly if market's sentiment improves during the upcoming sessions.
Support levels: 12,195 12,137 12,096
Resistance levels: 12,245 12,290 12,341
Market Morning Briefing: The Risk Appetite Is A Bit Lower
STOCKS
News of US missile strike on Syria Airbase has possibly kept the Japanese stocks down today. Nikkei (18588.87, -0.04%) is trading low today, making a fresh 4-mnth low of 18517. As mentioned yesterday, in case the index breaks and sustains below 18600, we could possible see a gradual fall towards 18300-18200 levels in the medium term.
Dow (20662.95, +0.07%) was almost stable yesterday. A break above 20780 is needed to take it further towards 20980; else we could possible see a trade in the 20780-20410 zone in the near term.
Dax (12230.89, +0.11%) has moved up from levels near 12120 and is trading just above immediate support near 12200. Some more movement below 12400 is possible before moving up further in the medium term.
Shanghai (3282.50, +0.05%) continues to move up. Immediate resistance is visible just above current levels on the daily charts but in case that breaks on the upside, the potential rise towards 3400 would come into focus as indicated in the 3-day and weekly charts.
Nifty (9261.95, -0.03%) was almost stable yesterday and may remain stable today also. No major movement expected today. A test of 9280-9300 is possible in the near term.
COMMODITIES
The Resistance at 1237 mentioned in the morning has held well and Gold (1265) has indeed rose above 1260 and has chances of rising further towards 1289.
Silver (18.42) also continues to move up and close to our 18.75 target. We have to see if that Resistance breaks or holds. In case the Silver rises past 18.75, it can move up to 19.05 levels also.
Copper (2.66) is trading within a range of 2.57-2.70. Only above 2.70, higher resistances of 2.80 can come into consideration. In the medium term 2.55-57 are going to be a strong support now but a close below that could open up 2.55 and 2.49 levels respectively.
WTI (52.65) has broken the resistance of 52.50 sooner than expected and has opened the higher target/resistance of 54. Immediate support comes at 52.50 and 51. Brent (55.80) has also bounced from its monthly trend line support and trading within the range of 55-57 levels, though a strong resistance is poised at 56.20 levels.The bias will remain bullish in near term while WTI and Brent are trading above 51 and 53.5 levels respectively.
FOREX
The risk appetite is a bit lower after the first military strike of the Trump-era took place in Syria but till now, the markets haven’t moved much and the risk appetite may recover by the early part of the next week.
Dollar Index (100.64) has risen a bit but the 5-day long consolidation phase is yet to be over, which is expected to resolve to the higher side for 101.00-35 in the coming days. Bullish momentum may intensify on a break above 101.00.
The major downtrend in Euro (1.0643) remains intact but lacking downside momentum as the currency gradually declines towards our target of 1.0600-1.0580. The only relief for Euro can come from EURJPY (117.55) which is trading just above a major support of 117.30 which may hold in the near term.
On the other hand, a bounce in EURJPY will imply underperformance of Yen, which is already evident in Dollar Yen (110.44), as the pair has managed to hold our support of 110.10-109.90 despite the increased risk appetite after the US strike in Syria. As discussed yesterday, the signals are conflicting and the true picture may take a couple of sessions more to emerge. Till then, we prefer to wait and watch.
Pound (1.2469) keeps forming a Triangle pattern as discussed in this space yesterday. Repeat – it implies a major expansion of volatility coming by the end of the next week. But for a significant trending move, a breakout from the range of 1.2350-1.2600 is required.
Aussie (0.7527) has been testing our support zone 0.7530-00 repeatedly but the expected bounce is yet to materialize but till 0.7500 holds, the chances of a bounce to 0.7650-80 can’t be ruled out.
With a sharp crash in Dollar-Rupee (64.51) after the RBI meet yesterday, all our targets till 64.50 are achieved and 64.40, even 64.20 may be seen in a day or two. It remains to be seen if the very important support of 64.30-20 holds or not as a huge bout of capitulation goes on.
INTEREST RATES
The US yields are testing immediate support levels and could see a short bounce in the coming sessions. The 5yr 91.83%), 10Yr (2.31%) and the 30yr (2.96%) are down from 1.86%, 2.35% and 3.01% respectively.
The German yields are falling sharply. Some more fall may be expected in the near term. The 5yr (-0.45%), 10Yr (0.262%) and the 30yr (1.04%) have risen slightly yesterday by 1bps but could see some more downside before bouncing back sharply.
The Japan yields have come off from resistance as expected. The 5yr (-0.14%) may test levels near -0.15% while the 10YR (0.06%) and the 30Yr (0.84%) may come down towards 0.04% and 0.78% respectively.
Keep a close watch on the US-Japan 10YR (2.25%). If this breaks below current support levels, it could indicate fresh strength in Yen and a fall in Nikkei in the near term.
The 10YR GOI (7.0362 %) rose in line with our expectation yesterday. A rise to 7.10-7.15% is possible before a short dip from there.
Crude Oil Jumps Two Percent On Supply Disruption Threats
The U.S cruise missile strikes have seen crude oil jump over two percent in a straight line with both Brent and WTI testing resistance.
The situation remains fluid in Syria at the moment as the implications of the massive crude missile strike from the United States gets digested. Among the most pressing questions will be,
- Is this a one-off attack and are other nations going to join in?
- What will be the response of Iran and Russia? Two of the world’s largest oil producers and staunch allies of the Assad regime.
- What will be the response of the North Koreans and indeed the Chinese? This is a clear message to them as well.
All of this adds up to potential turmoil in the world and also to potential supply disruptions to crude which have reacted as expected and moved materially higher. We will have to wait for these answers as the day moves on, but unsurprisingly, it would be expected that both crudes will remain bid on any dips.
Brent spot is trading at 52.60 a barrel and has major resistance just above at 57.00, a daily close above here opening a possible technical move to the 60.00 area.
WTI spot is trading at 52.30 a barrel testing resistance right here. A break opens a technical move to the long-term resistance at the 54.50/55.00 level.
The market will be very much headline driven today, what is not in dispute is that safe-haven flows will be the theme of the day.
Spot Gold Spikes As U.S. Bombs Syria
Gold jumps 15 Dollars to a high of 1264 as the U.S. announces a major cruise missile strike on Syria.
Gold has jumped from 1250 to a high of 1264 as the United States announces a major surprise attack on Syria in retaliation for the chemical attacks on its citizens earlier this week.
MORE THAN 50 MISSILES FIRED FROM U.S. NAVY DESTROYERS IN THE EASTERN MEDITERRANEAN, STRIKING SEVERAL TARGETS ON BASE – SECOND U.S. OFFICIAL – RTRS
The timing is somewhat shocking as the Chinese President Xi is on a state visit to the United States at the moment. My initial thoughts are the new president is sending a big message to the Chinese about their willingness to act on North Korea as well with this strike.
Geopolitics aside, safe-haven risk aversion should be the theme of the day now with Gold and Silver the major beneficiaries. Gold has broken the 200-day moving average intra-day and has tested its upper resistance at 1264, the February 28th high. A daily close above these levels can open a technical move to 1300 with support now at the 1250 level.
Expect Gold to be bid on any dips now and for crude oil to move higher as well. We expect stocks and bonds to also move and will comment on these in due course.
President Trump is due to address the nation shortly and the street will also look to see the reaction of the Chinese as well.
Crude Oil – Retains Its Recovery Tone
CRUDE OIL - The commodity took back its Wednesday losses to close higher on Thursday. On the downside, support resides at the 51.00 level where a break will expose the 50.00 level. A cut through here will set the stage for a run at the 49.00 level. Further down, support resides at the 48.00 level. On the upside, resistance resides at the 52.00 level. Further out, resistance comes in at the 53.00 level. A break above here will aim at the 54.00 level and then the 55.00 level followed by the 56.00 level. Its daily RSI is bullish and pointing higher suggesting further strength. All in all, CRUDE OIL remains biased to the upside short term.
GBP/USD Wedge Resistance Tapped
We spoke yesterday about the GBP/USD wedge that saw price coiling up nicely, and I couldn't go past featuring the continued price action to end the week.
First up, let's take a look at what we said yesterday:
Zooming into any of the intraday charts, you can see that price is coiling into a wedge pattern:
GBP/USD 4 Hourly:
Seeing as though price is right smack bang in the middle of the daily range, the direction on which to trade this pattern isn't clear. Do you view it as a continuation pattern because price has rallied off support and this is merely a pause before a further push higher, or do you take the view that it is simply a turn as we get closer to the top of the range?
Yesterday's price action goes some way toward answering the question:
GBP/USD 4 Hourly:
As you can see, price shot up, tapped the upper trend line of the wedge and was rejected back down.
Zoom into an even lower time frame chart and you can see just how violent the rejection was.
China-US Meeting And US Jobs In The Spotlight
Dollar higher ahead of NFP
The US dollar is higher against most majors currency pairs before the China-US summit and the release of the US employment report. Chinese President Xi Jinping has landed in Florida to meet with US counterpart Donald Trump to hold bilateral talks where trade and North Korea will be on the agenda. The two day meeting is sure to bring some market direction with the other driver being the US jobs report.
The U.S. non farm payrolls (NFP) will be released on April 7, at 8:30 am EDT (12:30 GMT). The forecast calls for a print of over 170,000 new jobs added to the US economy even after an impressive 235,000 announced last month. Although the headline number has shown consistent growth market watchers will be focusing on the average hourly earning for signs of higher pay leading to higher spending form US consumers. Analysts anticipate the hourly earning to gain 0.2 percent and allow the Fed to be patient on rates.
US employment has been the strongest pillar of the economic recovery and has kept pace with the US Federal Reserve two rate hikes in December (2015 and 2016) and the 25 basis point interest rate rise in March with the promise of more coming this year if the economy grows as expected. The Trump administration has struggled to recapture the optimism of the post election victory when the pro-growth policies were announced, but so far have not been delivered. Minutes from the March FOMC meeting showed internal debate on inflation and growth that could make the central bank rethink their hawkish view on the number of rate hikes this year.
The EUR/USD lost 0.06 in the last 24 hours. The single currency is trading at 1.0642 as political risk is one of many factors dragging it downwards. French elections anxiety has been dampened after the latest televised debate, but situations in Italy and elections later in the year in Germany have not painted an encouraging scenario for European unity.
Mario Draghi said on Thursday that the policies of the European Central Bank (ECB) remain appropriate and even despite positive signs of recovery it is too soon to talk about reducing stimulus. This means that the divergence between the Fed and the ECB will only grow as the Fed slowly but surely continues on a tightening path while the ECB is still unsure when it will abandon its expansionary policies. The German central bank governor does not agree in full with the ECB and would rather see and end to stimulus sooner rather than later.
The price of energy gained 1.33 percent during the Thursday trading session. West Texas is trading at $51.50 in a week that has seen the price of crude rising despite a larger than expected buildup of inventories in the US. Oil started the week barely above $50 and broke under that price level as inventory data started to be published hinting that despite all the effort from the Organization of the Petroleum Exporting Countries (OPEC) to stabilize prices. US crude inventories showed a buildup of 1.6 million barrels last week when the market had forecasted a drawdown of 100,000.
Fundamentals don’t fully explain the move as there is ample evidence of oversupply in the market, yet the price is still rising even as there are more US producers waiting to ramp up production. Asian markets that have been limited by the OPEC cut, have turned to US oil which reduces the overall negative impact of increased US crude. China has surpassed Canada as the main destination of US oil.
A disruption in Canadian supplies after the shutdown of the Syncrude oilseeds facility in Alberta has also helped WTI march higher.
The USD/CAD gained 0.186 percent in the last 24 hours. The pair is trading at 1.3408 ahead of employment data for both the US and Canada. The private payroll report published on Wednesday in the US has boosted optimism around the NFP to be published on Friday. The ADP had two massive data points back to back that have analysts improving their forecast for the NFP that is coming of a 235,000 jobs added and is now expected to deliver above 170,000. Canadian job gains are anticipated to be around 5,700 after a strong 15,300 last month. The data for both will go out at the same time with the market focusing on the US data before digesting the Canadian employment report.
The Canadian dollar has not fully taken advantage of the rise in oil prices as investors are anxious about macro events around the globe. The meeting between Presidents Trump and Xi in Florida could have far reaching implications for trade ahead of any Nafta renegotiation talks with Canada and Mexico. Risks are offsetting the rise in commodities with analysts also expecting the Bank of Canada (BoC) to remain in the sidelines as the U.S. Federal Reserve slowly hikes rates and as evidenced by the minutes released this week start trimming their balance sheet.
Market events to watch this week:
Wednesday, April 5
4:30am GBP Services PMI
8:15am USD ADP Non-Farm Employment Change
10:00am USD ISM Non-Manufacturing PMI
10:30am USD Crude Oil Inventories
2:00pm USD FOMC Meeting Minutes
Thursday, April 6
7:30 am EUR ECB Meeting Minutes
8:30am USD Unemployment Claims
Friday, April 7
4:30am GBP Manufacturing Production m/m
8:30am CAD Employment Change
8:30am USD Average Hourly Earnings m/m
8:30am USD Non-Farm Employment Change
British Pound Steady as US Jobless Claims Sparkles
GBP/USD is showing little movement in the Thursday session. In North American trade, GBP/USD is trading at 1.2480. On the release front, there are no major British indicators. In the US, unemployment claims dropped sharply to 234 thousand, easily beating the forecast of 251 thousand. On Friday, the UK publishes Manufacturing Production. Across the pond, US job numbers will be in focus, with the release of three key indicators – Nonfarm Employment Change, Average Hourly Earnings and the unemployment rate.
Although the Bank of England proved to be overly pessimistic about the Brexit vote back in June, policymakers continue to sound the alarm about the negative impact that Brexit will have on the British economy. On Wednesday, Gertjan Vlieghe, a member of the BoE Monetary Policy Committee, warned that that consumer spending in the UK was weakening and the situation was likely to worsen. Vlieghe weighed in on the discussion over monetary policy, as he cautioned the BoE against raising interest rates. The BoE, which has adapted a neutral stance towards a rate move, is not expected to raise rates before 2018, and lengthy Brexit negotiations could delay a rate hike even further. Although inflation levels have moved higher, wage growth and consumer spending remain soft, so there isn't much pressure on the BoE to raise rates in the near future.
The Federal Reserve released the minutes of its March policy meeting on Wednesday. At that meeting, the Fed raised rates a quarter-point to 0.75%, but the dovish rate statement disappointed the markets, triggering broad losses for the US dollar. In the minutes, policymakers noted upside risk to the US economy, but remained divided on whether inflation will rise to the Fed target of 2.0%. Most policymakers were in favor of taking steps to trim the $4.5 trillion balance, which has ballooned since the Fed implemented its aggressive quantitative easing program back in 2008. So what's next for the Fed? According to the CME's Fed Watch, the odds of a rate hike at the May meeting are just 5 percent, while the likelihood of a rate hike in June stand at 63 percent. Fed policymakers appear divided on how many more times the Fed will press the rate trigger. Last week, FOMC member Eric Rosengren called for three more hikes, saying the Fed should raise rates in June, September and December. Rosengren said that employment and inflation levels were close to the Fed's targets, and that three additional hikes were needed in order to prevent the US economy from overheating. However, a majority of FOMC members are in favor of just two more hikes this year.
Elliott Wave Analysis: S&P500 Intraday View
S&P500 is making an intra-day rally from around the 2340 mark, where support may have been found for a flat correction. Ideally we will now see a five wave movement to the upside follow and hopefully a breach above the 2378 level.
S&P500, 1H
Japanese Yen Dips as US Jobless Claims Dives
USD/JPY has posted gains in the Thursday session, as the pair trades just below the 111 level in the North American session. On the release front, Japanese Consumer Confidence improved to 43.9, above the forecast of 43.5 points. In the US, unemployment claims dropped to 234 thousand, its lowest level in five weeks. On Friday, US job numbers will be in focus, with the release of three key indicators – Nonfarm Employment Change, Average Hourly Earnings and the unemployment rate.
The Japanese consumer remains pessimistic about the economy, as the latest consumer confidence survey came in at 43.9 points for March. Although this reading improved over the February release of 43.1, a release below the 50-point level points to pessimism. There are some bright points in the economy, as manufacturing and export numbers are pointing higher. At the same time, domestic consumption remains soft and inflation levels remain well below the BoJ's target of 2.0% percent. The BoJ's preferred inflation indicator, BoJ Core CPI, remains weak and dipped to 0.1 percent. With inflation at low levels, the Bank of Japan is in no rush to tighten monetary policy.
There were no surprises from the minutes of the Fed March policy meeting. At that meeting, the Fed raised rates a quarter-point to 0.75%, but the dovish rate statement disappointed the markets, triggering broad losses for the US dollar. In the minutes, policymakers noted upside risk to the US economy, but remained divided on whether inflation will rise to the Fed target of 2.0%. Most policymakers were in favor of taking steps to trim the $4.5 trillion balance, which has ballooned since the Fed implemented its aggressive quantitative easing program back in 2008. So what's next for the Fed? According to the CME's Fed Watch, the odds of a rate hike at the May meeting are just 5 percent, while the likelihood of a rate hike in June stand at 63 percent. Fed policymakers appear divided on how many more times the Fed will press the rate trigger. Last week, FOMC member Eric Rosengren called for three more hikes, saying the Fed should raise rates in June, September and December. Rosengren said that employment and inflation levels were close to the Fed's targets, and that three additional hikes were needed in order to prevent the US economy from overheating. However, a majority of FOMC members are in favor of just two more hikes this year.