
Sample Category Title
US: Better Than Expected Trade Deficit in February
A large $4.3 billion decrease in the imports of goods, coupled with a small $0.4 billion increase in exports, were the reasons for the narrowing of the deficit in February.
Lower Automotive and Consumer Goods Imports Helped Trade
A large drop in the importation of automotive and consumer goods products was the culprit of the decline in imports of goods in February. Automotive imports declined $2.6 billion and consumer goods imports dropped $3.1 billion after an increase of $0.9 billion and $2.4 billion in January, respectively. Overall, imports of goods and services declined 1.8 percent in February after an increase of 2.3 percent in January. But what is more important for U.S. GDP growth during the first quarter of the year is that real imports of goods declined by a larger 2.6 percent during the month after increasing 2.0 percent in January.
Meanwhile, exports of goods and services increased 0.2 percent during the second month of the year after increasing 0.8 percent in January. In real terms, exports of goods increased 0.3 percent after increasing 0.4 percent in January.
February Deficit Consistent with Weak Q1 Consumer Demand
The improvement in the February trade deficit is consistent with the softness we have seen in U.S. consumer demand. Furthermore, yesterday's release of a very weak Wards automobile sales report for March could put further downward pressure on the deficit if this weakness extends into the third month of the quarter.
Lower imports of automotive and consumer goods in February helped to bring down the trade deficit in February. They also help in improving the prospects of a lessened negative effect from the trade deficit on real GDP growth during the first quarter of the year. However, the lower deficit cannot hide the fact that U.S. consumer demand has remained very weak during the first two months of 2017 after a very strong performance by the consumer during the last quarter of 2016.
Strong Decline in the Trade Deficit Versus Asia and Europe
Another salient characteristic of February's trade deficit was a large drop in the trade deficit with the Pacific Rim countries, specifically with China, and a smaller decline in the deficit versus Europe. The trade deficit with the Pacific Rim countries declined to $26.8 billion in February from $38.6 billion in January. The bulk of the decline came from China, with the deficit coming down to $23 billion in February from $31.3 billion in January.
Meanwhile, the trade deficit with Europe declined from $13.9 billion in January to $10.7 billion in February. At the same time, the deficit with Mexico increased from $3.9 billion in January to $5.8 billion in February while the deficit with Canada declined from $3.4 billion in January to $2.1 billion in February.
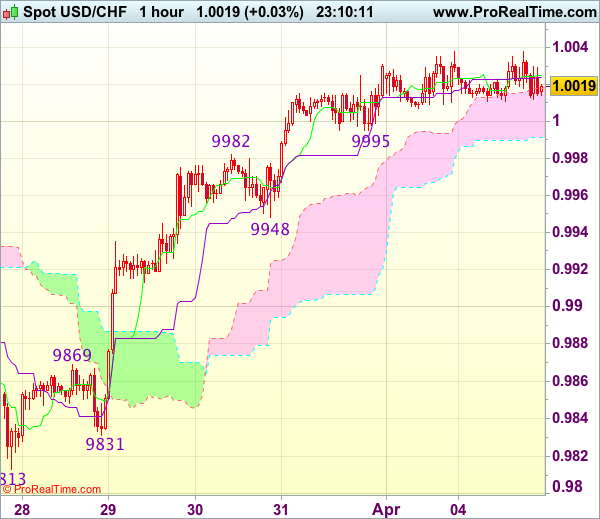
Trade Idea Wrap-up: USD/CHF – Buy at 0.9950
USD/CHF - 1.0017
Most recent candlesticks pattern : N/A
Trend : Near term up
Tenkan-Sen level : 1.0025
Kijun-Sen level : 1.0024
Ichimoku cloud top : 1.0018
Ichimoku cloud bottom : 0.9992
Original strategy :
Buy at 0.9950, Target: 1.0050, Stop: 0.9915
Position : -
Target : -
Stop : -
New strategy :
Buy at 0.9950, Target: 1.0050, Stop: 0.9915
Position : -
Target : -
Stop : -
As the greenback has maintained a firm undertone after last week’s rally above 1.0003 resistance, suggesting recent rise from last week’s low at 0.9813 is still in progress and bullishness remains for this move to extend gain to previous support at 1.0060 (now resistance), however, loss of upward momentum should prevent sharp move beyond resistance at 1.0109, risk from there has increased for a retreat to take place later.
In view of this, would not chase this rise here and would be prudent to buy dollar on pullback as said support at 0.9948 should limit downside. Below 0.9931 (50% Fibonacci retracement of 0.9831-1.0031) would abort and signal top is formed instead, bring correction to 0.9905-10 (61.8% Fibonacci retracement) but reckon previous resistance at 0.9869 would hold from here.
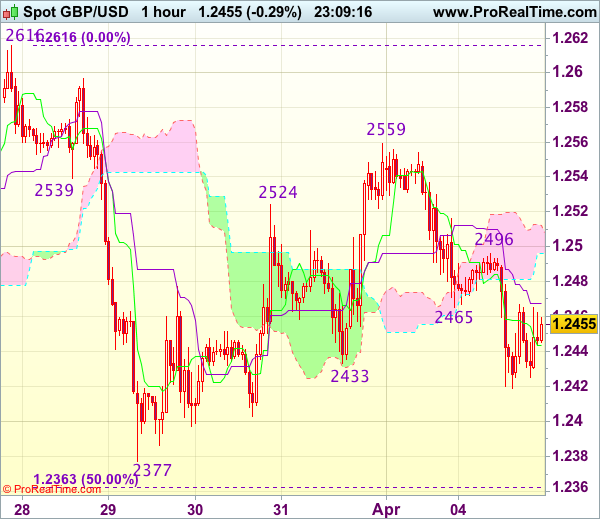
Trade Idea Wrap-up: GBP/USD – Hold short entered at 1.2465
GBP/USD - 1.2451
Most recent candlesticks pattern : N/A
Trend : Near term down
Tenkan-Sen level : 1.2443
Kijun-Sen level : 1.2468
Ichimoku cloud top : 1.2512
Ichimoku cloud bottom : 1.2496
Original strategy :
Sold at 1.2465, Target: 1.2365, Stop: 1.2500
Position : - Short at 1.2465
Target : - 1.2365
Stop : - 1.2500
New strategy :
Hold short entered at 1.2465, Target: 1.2365, Stop: 1.2500
Position : - Short at 1.2465
Target : - 1.2365
Stop : - 1.2500
Although cable has rebounded after finding support at 1.2419 and minor consolidation above this level would be seen, reckon the Kijun-Sen (now at 1.2475) would limit upside and bring another decline later, below said support at 1.2419 would extend weakness to 1.2400, break there would add credence to our view that the rebound from 1.2377 has ended at 1.2559, bring further fall towards support at 1.2377. Looking ahead, only a drop below 1.2377 would confirm the fall from 1.2616 is still in progress for subsequent decline towards key support at 1.2335.
In view of this, we are holding on to our short position entered at 1.2465 but one should exit on such decline. Only break of said resistance at 1.2496 would abort and suggest an intra-day low is formed instead, risk a stronger rebound to 1.2525-30.
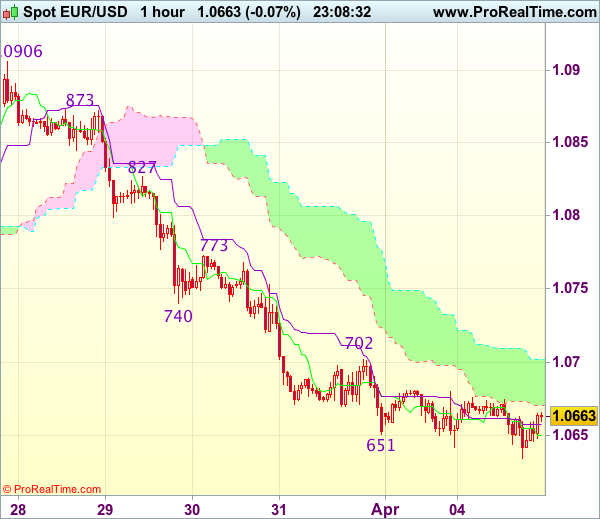
Trade Idea Wrap-up: EUR/USD – Sell at 1.0730
EUR/USD - 1.0659
Most recent candlesticks pattern : N/A
Trend : Near term down
Tenkan-Sen level : 1.0651
Kijun-Sen level : 1.0658
Ichimoku cloud top : 1.0702
Ichimoku cloud bottom : 1.0671
Original strategy :
Sell at 1.0730, Target: 1.0610, Stop: 1.0765
Position : -
Target : -
Stop : -
New strategy :
Sell at 1.0730, Target: 1.0610, Stop: 1.0765
Position : -
Target : -
Stop : -
As the single currency has remained under pressure after falling to 1.0642 yesterday, adding credence to our bearish view that the decline from 1.0906 top is still in progress and bearishness remains for this fall to extend further weakness to 1.0620-25, then test of previous chart support at 1.0600, however, a sustained breach below the latter level is needed to retain downside bias for subsequent selloff to 1.0570-75 first, otherwise, risk from there is seen for a rebound later.
In view of this, would not chase this fall here and would be prudent to sell dollar on recovery as 1.0730-40 should limit upside. Only a firm break above resistance at 1.0773 would suggest low is formed instead, bring a stronger rebound to 1.0800 but resistance at 1.0827 should remain intact.
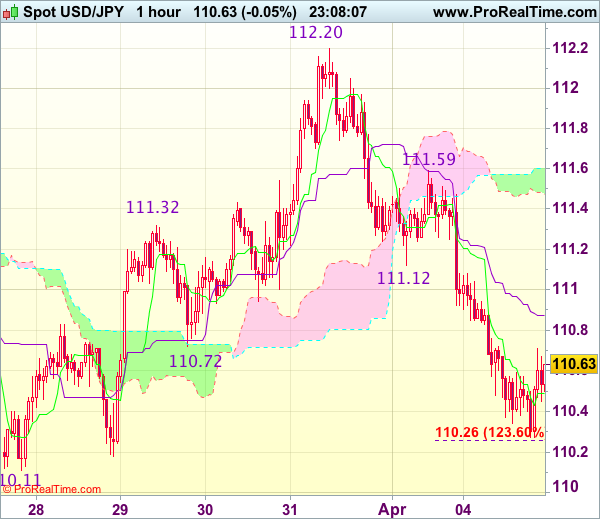
Trade Idea Wrap-up: USD/JPY – Sell at 110.95
USD/JPY - 110.57
Most recent candlesticks pattern : N/A
Trend : Near term down
Tenkan-Sen level : 110.50
Kijun-Sen level : 110.87
Ichimoku cloud top : 111.60
Ichimoku cloud bottom : 111.47
Original strategy :
Sell at 110.95, Target: 109.95, Stop: 111.30
Position : -
Target : -
Stop : -
New strategy :
Sell at 110.95, Target: 109.95, Stop: 111.30
Position : -
Target : -
Stop : -
As the greenback has recovered after falling to 110.27, suggesting minor consolidation above this level would be seen and test of the Kijun-Sen (now at 110.87) cannot be ruled out, however, reckon upside would be limited and resistance at 111.12 should remain intact, bring another decline later to 110.26-27 (1.236 times projection of 112.20-111.12 measuring from 111.59 and said intra-day support), break there would extend the fall from 112.20 to last week’s low at 110.11. Looking ahead, break there is needed to retain downside bias and confirm medium term decline has resumed for further subsequent fall to 109.80-85 (1.618 times projection of 112.20-111.12 measuring from 111.59) which is likely to hold on first testing.
In view of this, would not chase this fall here and would be prudent to sell dollar on recovery as 110.90-95 should limit upside. Above previous support at 111.12 (now resistance) would defer but only break of resistance at 111.59 would abort and signal the fall from 112.20 has ended instead.
Currencies: USD Continues Indecisive Trading Pattern
Headlines
Most European stock markets trade near opening levels in an uneventful trading session. US stock markets also started unchanged ahead of the key US eco data later this week.
The US trade deficit shrank sharply in February, from -$48.2B to -$43.6B, as overseas customers snapped up American products and services, the latest sign US factories are benefiting from global economic stability.
The largest South-African trade union federation Cosatu, which is in a political alliance with the ANC, called for the president to resign over his "inattentive leadership" and failure to consult on last Friday's cabinet reshuffle. President Zuma tried to ease market concerns by saying that the country's policy orientation remains the same.
Euro zone sales increased by more than expected in February (0.7% m/m) as shoppers bought far more clothing than in January in a sign that consumers are still spending despite higher inflation.
Growth in Britain's construction industry slowed slightly in March, adding to signs that the economy has lost some of its strong momentum of late last year when it defied the shock of the Brexit vote. The construction PMI declined from 52.5 to 52.2 while consensus expected a stabilisation.
A surge in consumer lending means British banks are at risk of incurring losses, the BoE said, warning that some might be letting credit standards slide as they compete to offer debt to households.
Rates
German bonds eke out more gains
German bonds continued their rally, albeit at a slower pace in a session with little eco data or events. Equities traded with a small negative bias, oil was a bit higher and peripheral spreads narrowed with the exception of Greece and Portugal. So, it is a stretch to call it a risk-off session. US Treasuries whose yields were marginally up also contradicted the risk-off character of the session. The euro area retail sales printed stronger than expected, but were ignored. The US trade deficit narrowed more than expected in February. Technicals may have played some role today. In the previous week, US Treasury yields fell substantially more than German ones and the 10-yr Treasury yield arrived at key 2.30% yield support. The Bund 10-yr yield on the contrary had still more space to decline, as it is still a bit further away from the key 0.20% yield support. So, technicals may explain the outperformance of German bonds versus US Treasuries. At the time of writing, the German yield curve bull flattened with yields 0.4 bp (2-yr) to 3.9 bps lower. US yields are 1.6 bps (2-yr) and 2.7 bps (30- yr). In the EMU bond markets, 10-yr yield spreads barely changed, with the exception of Portuguese and Greek 10-yr yield spreads which rose 5 and 8 bps. Regarding Greece, there were signals that the review of the Greek bailout would not be concluded at the next Eurogroup meeting.

Currencies
USD continues indecisive trading pattern
Today, FX trading was initially driven by a cautious risk-off sentiment. USD/JPY declined to the 110.30 area, but a real test of the recent low didn't occur. In the risk off move, European yields declined more than US ones, weighing slightly on the euro. EUR/JPY touched a new correction low. However, for now, there is no strong enough driver to guide a uniform USD move. Markets await clear signs from key eco data expected later this week. USD/JPY is trading in the 110.55 area. EUR/USD hovers in the mid 1.0650 area.
Overnight, Asian equities showed a cautious picture after yesterday's losses in the US. Japanese equities underperformed the region as the yen extended yesterday's rebound. USD/JPY dropped to the mid 110 area. EUR/USD showed no clear trend. Euro weakness and USD softness kept each other in balance. EUR/USD hovered in the 1.0665/70 area.
European equities even opened with modest gains, but doubts lingered as equity futures signaled potential further losses in the US. Global core bond also suggested global investors caution. In this move, the decline in European yields contrasted with slightly higher US yields. It widened the interest rate differential in favour of the dollar. At least for now, widening interest rate differentials weighed on the euro. EUR/USD dropped to the 1.0636 area around noon. Selling pressure from EUR/JPY (USD/JPY) probably also weighed on the EUR/USD headline pair. USD/JPY filled bid in the 110.30 area, but last week's low (110.11) stayed out of reach.
The intra-day correction eased as US traders joined the fray. The US trade deficit narrowed a bit more than expected. USD/JPY rebounded after the publication of the report. No reaction of EUR/USD. So, the reaction of USD/JPY was probably mostly driven by another factor (intraday decline of core yields slowed) rather than by the trade data. USD/JPY trades currently in the 110.55 area, well off the intraday low. EUR/USD is going nowhere in the 1.0650 area. We continue to keep a close eye at the US (10-y) yield which is testing key support levels (2.30% area). The fate of this this might also be important for the next move in the dollar (especially USD/JPY).

Sterling rally shows tentative signs of topping out
Today, the downward correction of sterling continued. Sterling faced heavy selling pressure at the onset of European trading. EUR/GBP jumped to the 0.8587 area. Cable dropped to the 1.2420 area. However, with only few eco data on the agenda, the move soon met resistance. The UK construction PMI was marginally softer than expected, but without impact on sterling. After the early morning repositioning sterling didn't go anywhere. Cable hovered in the mid 1.24 big figure. EUR/GBP traded close to, mostly slightly north of 0.8550. Sterling shows tentative signs of a topping out process. Especially, for EUR/GBP confirmation is needed that a bottom is really in place.

US Trade Deficit Narrows More than Expected in February
The U.S. international trade deficit narrowed by $4.6bn, or more than $1bn more than expected, declining to $43.6bn from January's downwardly revised $48.2bn.
Goods exports increased by 0.2% m/m in February, with a sharp uptick in consumer goods (+4.0%) and automotive (+1.4%) nearly offset by a decline in food & beverage (-6.0%) and capital goods (-1.4%). Services exports were largely unchanged in February from the month prior.
Imports declined -1.8% m/m in February, on lower automotive (-8.3%) and consumer goods (-5.9%) imports. Imports of other categories were more robust. Petroleum imports were up as the effect of higher prices was offset by lower import volumes.
After adjusting for price fluctuations, the rise in merchandise exports was far more apparent, with real goods exports up a stronger 0.3% on the month. The decline in goods imports was also more accentuated in volume terms, down by 2.6% in February.
Most of the goods improvement was related to the trade deficit narrowing vis-à-vis Europe (-$12.0bn vs. -$13.4bn in January). On the other hand, the trade deficit with China (-$31.7.0bn vs. -$30.1bn in January) continued to expand. The goods trade deficit with North America also widened slightly, as the wider gap with Mexico (-$6.2 vs. -$5.5bn in January) was compounded by a slight widening of the Canadian one (-$2.4bn vs. -$1.8bn in January).
Key Implications
This was a relatively decent report. Exports saw a small uptick, following outsized gains in the previous two months, while imports declined after a four month expansion. Still, despite the narrowing this month from an elevated January gap, the U.S. trade deficit remains sizeable.
Despite vows to bring it down, it's unlikely that the new administration's policies will be able to alter the course of the trade balance, which is buttressed by the high dollar and comparatively strong U.S. demand vis-à-vis the rest of the world. Moreover, any policies that serve to disrupt global trade may result in unintended negative consequences for the American economy.
Neither the high dollar nor subdued global growth are likely to go away anytime soon, but the backdrop has become somewhat more supportive recently, with global growth strengthening and the dollar paring back gains in light of the very gradual pace of rate increases by the Fed.
After subtracting 1.8 percentage points in the last quarter of 2016, net-trade looks to be more even keeled at the start of 2017. Ultimately, we expect only modest drag on economic activity. Still, in light of the expected drawdown in inventory investment, the U.S. economy appears to have expanded by only 1% in the first quarter of the year.
Canada’s Trade Balance Slips into Deficit in February
Canada's trade balance moved back into deficit (-$972 million) in February, ending three months in surplus territory. Exports fell 2.4%, while imports rose 0.6%.
The weakness in exports was broad-based, with eight of eleven segments declining. The rise in imports was less broad, mainly focused in motor vehicles and parts, agriculture and special transactions trade.
The decline was mostly a volume story. In inflation-adjusted terms, real exports fell 2.5%, while imports rose 0.3%.
The widening in Canada's trade deficit was entirely with countries outside of the United States where it rose to $5.4 billion (from $4.0 billion in January). Meanwhile, the surplus with the U.S. widened slightly to $4.5 billion (from $4.4 billion previously).
Key Implications
The pullback in exports is disappointing and overall net-exports will subtract as much as 2 percentage points from economic growth in the first quarter of this year. Nonetheless, with a string of strong releases and positive signals for domestic demand, we are still comfortable with our expectation for real GDP growth of 3.4% in the first quarter.
February's weakness notwithstanding, the outlook for export growth in Canada remains solid. One of the brightest spots in the U.S. outlook over recent months has been manufacturing activity, which exhibits a sturdy and leading relationship with Canadian exports.
Potential changes to NAFTA continue to make headlines and will be a point of concern for Canadian policymakers. Still, given the depth of the two-way trading relationship between the two countries and encouraging comments from the U.S Commerce Secretary, we do not expect to see major changes to the agreement between the two countries.
US Trade Gap Improved in February But Size of Deficit Will Draw Attention
Highlights:
- The US trade deficit in goods and services narrowed to $43.6 billion in February from January's $48.2 billion shortfall that was the largest in nearly two years.
- Imports declined 1.8% on lower auto and consumer goods imports while exports edged up slightly.
- Today's report is consistent with our forecast for net trade to provide a modest lift to growth in Q1/17.
- Our GDP monitoring is unchanged at 1.7% in Q1/17
Our Take:
Today's report shows a welcomed improvement in the trade deficit after months of deterioration although that is unlikely to placate the new Administration that has made the US trade gap a central issue. The deficit in goods with NAFTA partners widened relative to last year; while that was largely due to a return to deficits with Canada (averaging $2.6 billion over the last three months), it is the more sizeable gap with Mexico ($4.7 billion) that will likely continue to draw attention. These figures will remain in the spotlight in the coming months as the Trump administration seeks to renegotiate NAFTA. Outside North America, China is likely to remain a focal point as the US is running a $27.3 billion trade deficit with that country even if that is no worse than year ago figures. Given the Trump Administration's discomfort with these deficits, the threat of protectionist trade measures continues to loom large. Our forecast does not assume any major disruptive trade policies will be implemented though the risks are not insignificant.
Canadian Net Trade Balance Back in Deficit in February
Highlights:
- The merchandise trade balance returned to deficit in February, posting a $1.0 billion shortfall following three-consecutive surpluses November through January.
- Nominal exports declined 2.4%, led by a 2.5% decline in the volume of shipments. Imports rose 0.6% in nominal terms and 0.5% in volume terms.
- Regionally, the return to a nominal trade deficit was led by deterioration in the balance of trade with countries other than the U.S. The Canadian goods trade surplus with the U.S. was little-changed in February.
- Export volumes are tracking little growth in Q1 alongside a jump in imports that leaves the real net trade balance tracking a 3 percentage point drag from Q1 annualized GDP growth.
Our Take:
A deterioration in the 'real' international trade balance in February (which occurred alongside the first nominal trade deficit in four months) suggests that net trade will likely provide a larger-than-expected subtraction from economic growth in Q1/17 than we previously assumed. We're currently tracking a ~3 percentage point drag versus the 0.9% subtraction expected ahead of the report. A monthly pull-back in export volumes (led by an almost 3% drop in non-energy exports) also provides the first evidence that the three-month run of outsized monthly GDP gains November through January came to an end in February. Nonetheless, earlier strength - a 0.6% jump in GDP in January left the level of activity in that month already an annualized 4.1% above its Q4 average - still leaves GDP tracking in line with our monitoring for a 3.8% jump in Q1 as a whole and a silver lining in the recent trade data is that much of a sizeable import boost Q1 to-date has come from rising equipment imports that bode well for domestic equipment investment to bounce back into positive growth territory in Q1. Looking through monthly and quarterly data volatility, our view remains that underlying economic activity continues to improve at a modestly above-potential pace as weakness in oil & gas sector investment eases and the rest of the economy continues to grow.