Sample Category Title
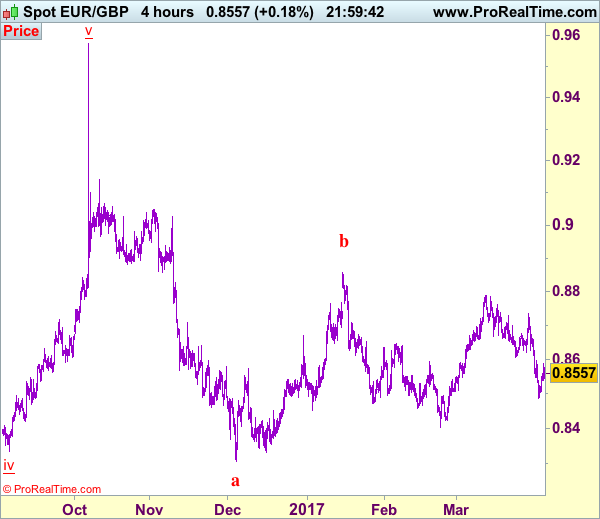
Trade Idea: EUR/GBP – Sell at 0.8620
EUR/GBP - 0.8557
Recent wave: Major double three (A)-(B)-(C)-(X)-(A)-(B)-(C) is unfolding and 2nd (A) has possibly ended at 0.6936.
Trend: Near term down
Original strategy :
Sell at 0.8620, Target: 0.8520, Stop: 0.8660
Position : -
Target : -
Stop : -
New strategy :
Sell at 0.8620, Target: 0.8520, Stop: 0.8660
Position : -
Target : -
Stop : -
Although euro’s recovery after falling to 0.8485 has retained our view that consolidation above this level would be seen, reckon upside would be limited to 0.8590-00 and renewed selling interest should emerge around 0.8620-25, bring another decline later, below said support at 0.8485 would add credence to our view that top has been formed at 0.8788 and bearishness remains for this fall from there to bring retracement of early upmove, hence further weakness to 0.8470 would be seen, however, oversold condition should prevent sharp fall below 0.8450, risk from there has increased for a rebound to take place later.
In view of this, we are looking to sell euro on recovery as 0.8620-25 should limit upside. Only above 0.8660-65 would defer and suggest low is possibly formed, risk rebound to 0.8680, then 0.8700 but price should falter below said resistance at 0.8735, bring further choppy trading later.
Our preferred count is that, after forming a major top at 0.9805 (wave V), (A)-(B)-(C) correction is unfolding with (A) leg ended at 0.8400 (A: 0.8637, B: 0.9491 and 5-waver C ended at 0.8400. Wave (B) has ended at 0.9413 and impulsive wave (C) has either ended at 0.8067 or may extend one more fall to 0.8000 before prospect of another rally. Current breach of indicated resistance at 0.9043 confirms our view that the (C) leg has ended and bring stronger rebound towards 0.9150/54, then towards 0.9240/50.
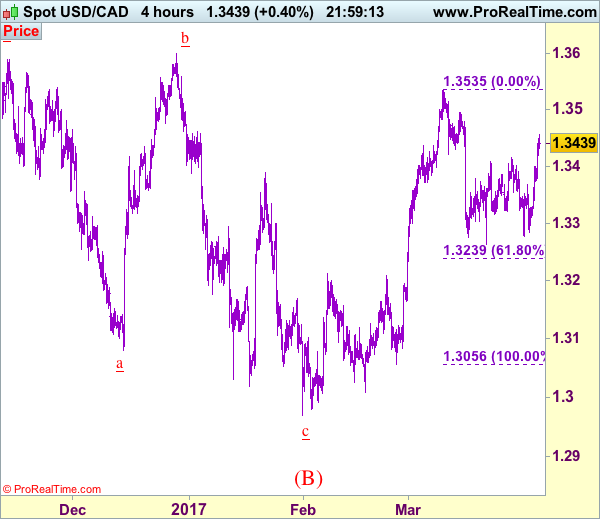
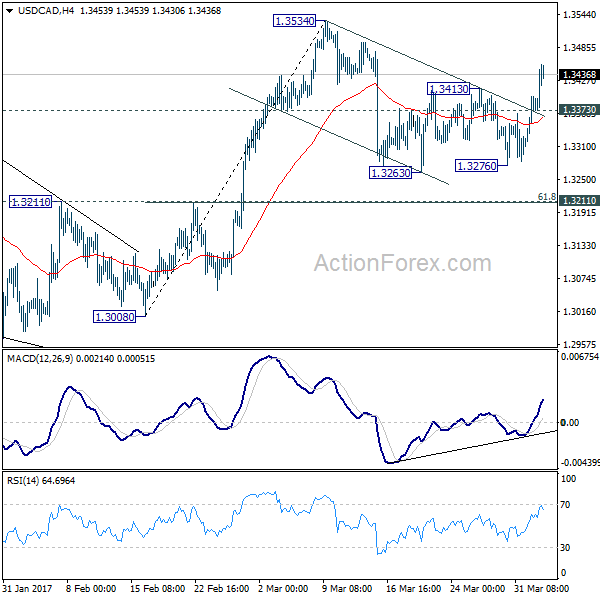
Trade Idea: USD/CAD – Buy at 1.3375
USD/CAD - 1.3443
Recent wave: Only wave v of c has ended at 0.9407 and wave C of major A-B-C correction is underway for headway to 1.4700
Trend: Near term up
Original strategy :
Exit short entered at 1.3340,
Position: - Short at 1.3340
Target: -
Stop: -
New strategy :
Buy at 1.3375, Target: 1.3550, Stop: 1.3315
Position: -
Target: -
Stop:-
As the greenback has surged again today and broke above indicated resistance at 1.3415, suggesting the correction from 1.3535 has possibly ended and consolidation with mild upside bias is seen for further gain to 1.3495-00 but break there is needed to signal upmove has resumed for retest of 1.3535, once this level is penetrated, this would extend recent upmove from 1.2969 to 1.3575-80 but previous chart resistance at 1.3599 should hold on first testing.
In view of this, we are looking to buy on pullback as 1.3370-80 should limit downside and bring another rise. Below 1.3340 would abort and suggest the rebound from 1.3264 has ended instead, bring further fall to 1.3300-10 but said support at 1.3264 should remain intact. Only a break below this level at 1.3264 would shift risk back to downside for the fall from 1.3535 to extend weakness to 1.3235-40 (61.8% Fibonacci retracement of 1.3056-1.3535) and then 1.3200-10.
To recap, wave B from 1.3066 is unfolding as an a-b-c and is sub-divided as a: 1.2192, b: 1.2716 and wave c is a 5-waver with i: 1.1983, ii: 1.2506, extended wave iii with minor iii at 1.0206, wave iv ended at 1.0781 and wave v as well as wave iii has ended at 0.9931, hence the subsequent choppy trading is the wave iv which is unfolding as (a)-(b)-(c) with (a) leg of iv ended at 1.0854, followed by (b) leg at 1.0108 and (c) leg as well as the wave iv ended at 1.0674. The wave v is sub-divided by minor wave (i): 0.9980, (ii): 1.0374, (iii): 0.9446, (iv): 0.9913 and (v) as well as v has possibly ended at 0.9407, therefore, consolidation with upside bias is seen for major correction, indicated target at 1.3700 and 1.4000 had been met and further gain to 1.4700 would be seen later.
British Pound Posted Losses as Construction PMI Softens
GBP/USD has posted losses in the Tuesday session. In the North American trade, GBP/USD is trading at 1.2430. On the release front, British Construction PMI dipped to 52.2, missing the estimate of 52.5 points. In the US, the trade deficit narrowed to $43.6 billion, better than the forecast of $46.0 billion. On Wednesday, all eyes will be on the Federal Reserve, which will publish the minutes of its March policy meeting. As well, the US will release ADP Employment Change and ISM Non-Manufacturing PMI. The UK will release Services PMI.
Britain has entered a new phase in the Brexit saga, as Prime Minister Theresa May gave formal notice its intent to leave the EU last week. The negotiations over the breakup are supposed to be conducted over a two-year period, and are likely to be difficult. The EU has no intention of giving Britain a better deal than it had within the club, and wants the first item of business to be "exit bill" for Britain's share of debts, pensions and other payments, which could run as high as EUR 60 billion. The British government will be under pressure to show the British public that it has reached a good deal, and has threatened to leave the EU without a deal if the EU is intransigent in the negotiations. That scenario, labeled "hard Brexit", would likely take a toll on the British economy and could send the pound downward. Negotiations are unlikely to commence for several months, but we're likely to have plenty of tough talk between the parties in the meantime, which could create volatility for the struggling pound.
The US economy hasn't missed a beat in 2017, and the markets are expecting strong data for the first quarter. The CB consumer confidence report soared to 125.6 in March, and strong consumer confidence levels should translate into increased consumer spending, a key component of economic growth. GDP for the fourth quarter was revised to 2.1%, up from 1.9% in the previous GDP report. With the economy headed in the right direction, the discussions around the monetary policy tables are not whether the Fed will raise rates, but will it press the rate trigger two or three more times in 2017. The markets will be paying close attention to the minutes of the March meeting, when the Fed raised rates by a quarter-point, to a range of 0.75-1.00%. Any hints about the timing of the next hike, as well as the tone of the minutes are factors which could move the currency markets on Wednesday. The markets considered the rate statement overly cautious, and this sentiment sent the US dollar broadly lower. If the reaction to the minutes is one of disappointment, the dollar could again head downwards.
Gold Almost Unchanged, Fed Minutes Loom
Gold is almost unchanged in the Tuesday session. In North American trade, gold is trading at $1255.87 per ounce. On the release front, the trade deficit narrowed to $43.6 billion, better than the forecast of $46.0 billion. On Wednesday, the spotlight will be on the Federal Reserve, which will publish the minutes of its March policy meeting. As well, the US will release ADP Employment Change and ISM Non-Manufacturing PMI.
The US economy hasn't missed a beat in 2017, and the markets are expecting strong data for the first quarter. The CB consumer confidence report soared to 125.6 in March, and strong consumer confidence levels should translate into increased consumer spending, a key component of economic growth. GDP for the fourth quarter was revised to 2.1%, up from 1.9% in the previous GDP report. With the economy headed in the right direction, the discussions around the monetary policy tables are not whether the Fed will raise rates, but will it press the rate trigger two or three more times in 2017. The markets will be paying close attention to the minutes of the March meeting, when the Fed raised rates by a quarter-point, to a range of 0.75-1.00%. Any hints about the timing of the next hike, as well as the tone of the minutes are factors which could move the currency markets on Wednesday. The markets considered the rate statement overly cautious, and this sentiment sent the US dollar broadly lower. If the reaction to the minutes is one of disappointment, gold prices could move higher.
Elliott Wave Analysis: German DAX Intraday View
DAX is trading nicely lower today, probably in the second sub-wave b of a minimum three wave correction that may unfold in wave iv. As such we may see DAX go a little further to the downside, specifically to the 12186 region, before bulls may again bounce higher into final wave v.
German DAX, 1H
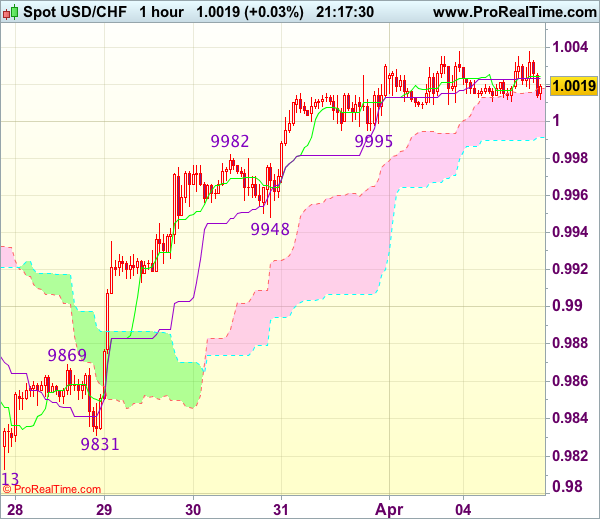
Trade Idea Update: USD/CHF – Buy at 0.9950
USD/CHF - 1.0025
Original strategy :
Buy at 0.9950, Target: 1.0050, Stop: 0.9915
Position : -
Target : -
Stop : -
New strategy :
Buy at 0.9950, Target: 1.0050, Stop: 0.9915
Position : -
Target : -
Stop : -
As the greenback has maintained a firm undertone after last week’s rally above 1.0003 resistance, suggesting recent rise from last week’s low at 0.9813 is still in progress and bullishness remains for this move to extend gain to previous support at 1.0060 (now resistance), however, loss of upward momentum should prevent sharp move beyond resistance at 1.0109, risk from there has increased for a retreat to take place later.
In view of this, would not chase this rise here and would be prudent to buy dollar on pullback as said support at 0.9948 should limit downside. Below 0.9931 (50% Fibonacci retracement of 0.9831-1.0031) would abort and signal top is formed instead, bring correction to 0.9905-10 (61.8% Fibonacci retracement) but reckon previous resistance at 0.9869 would hold from here.
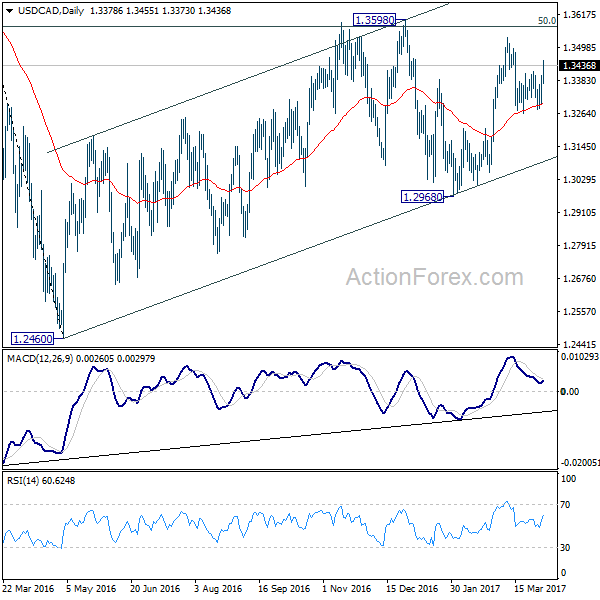
USD/CAD Mid-Day Outlook
Daily Pivots: (S1) 1.3314; (P) 1.3356; (R1) 1.3425; More....
USD/CAD's strong rally today and break of 1.3413 resistance indicates that corrective fall from 1.3534 has completed already. Intraday bias is turned back to the upside for retesting 1.3534 first. Break will extend whole rise from 1.2698 to 1.3598 resistance. Overall, medium term rebound form 1.2460 is still expected to extend through 1.3598. On the downside, below 1.3373 minor support will turn bias back to the downside and could extend the correction from 1.3534 with another fall. But we'd expect strong support from 1.3211 cluster level (61.8% retracement of 1.3008 to 1.3534 at 1.3209) to contain downside and bring rebound.
In the bigger picture, price actions from 1.4689 medium term top are seen as a correction pattern. The first leg has completed at 1.2460. The second leg from 1.2460 is likely still in progress and could target 61.8% retracement of 1.4689 to 1.2460 at 1.3838. We'd look for reversal signal there to start the third leg. Break of 1.2968 will argue that the third leg has already started and should at least bring at retest of 1.2460 low. However, sustained trading above 1.3838 would pave the way to retest 1.4689 high.
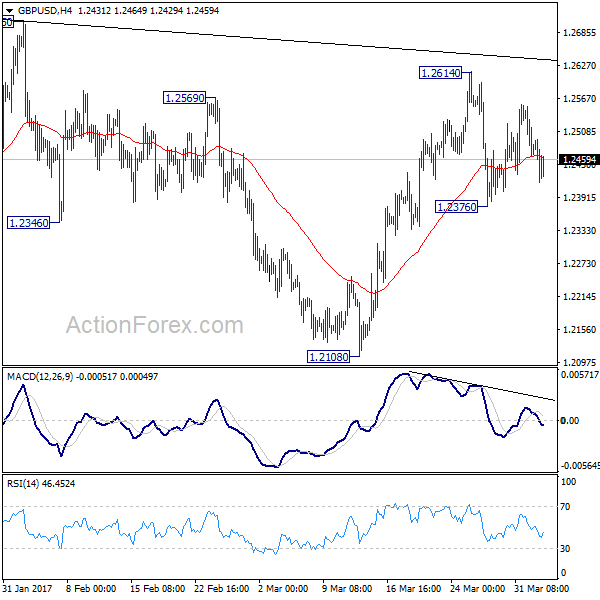
GBP/USD Mid-Day Outlook
Daily Pivots: (S1) 1.2448; (P) 1.2501; (R1) 1.2538; More...
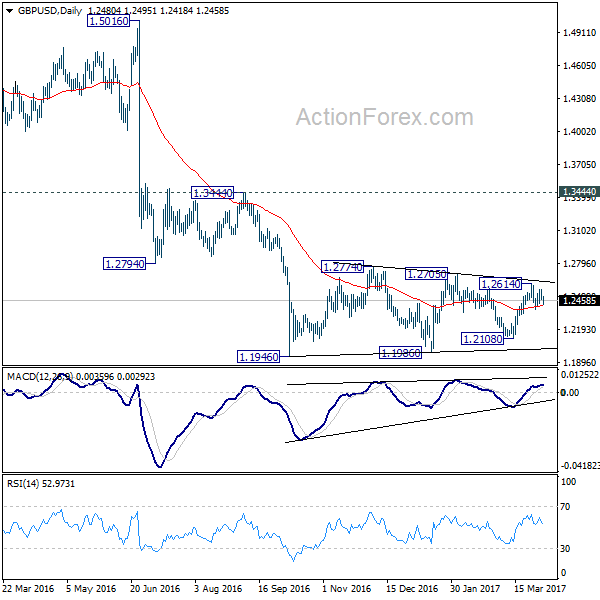
Intraday bias in GBP/USD remains neutral as it's staying in range of 1.2376/2614. Overall, price actions from 1.1946 are viewed as a consolidation pattern pattern. On the downside, break of 1.2376 will turn bias to the downside for 1.2108 support. Decisive break there will be an early sign of larger down trend resumption. On the upside, break of 1.2614 will extend the rise from 1.2108. But upside should be limited by 1.2705/2774 resistance zone to bring larger down trend resumption eventually.
In the bigger picture, fall from 1.7190 is seen as part of the down trend from 2.1161. There is no sign of medium term reversal yet. Sustained trading below 61.8% projection of 2.1161 to 1.3503 from 1.7190 at 1.2457 will target 100% projection at 0.9532. Overall, break of 1.3444 resistance is needed to confirm medium term bottoming. Otherwise, outlook will remain bearish.
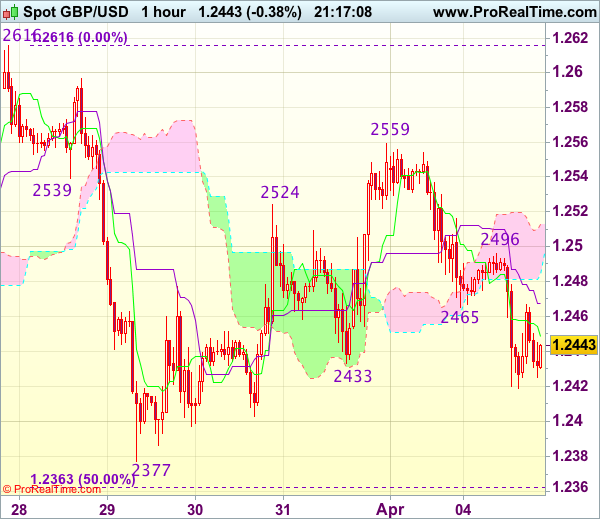
Trade Idea Update: GBP/USD – Hold short entered at 1.2465
GBP/USD - 1.2460
Original strategy :
Sold at 1.2465, Target: 1.2365, Stop: 1.2500
Position : - Short at 1.2465
Target : - 1.2365
Stop : - 1.2500
New strategy :
Hold short entered at 1.2465, Target: 1.2365, Stop: 1.2500
Position : - Short at 1.2465
Target : - 1.2365
Stop : - 1.2500
Although cable has rebounded after finding support at 1.2419 and minor consolidation above this level would be seen, reckon the Kijun-Sen (now at 1.2475) would limit upside and bring another decline later, below said support at 1.2419 would extend weakness to 1.2400, break there would add credence to our view that the rebound from 1.2377 has ended at 1.2559, bring further fall towards support at 1.2377. Looking ahead, only a drop below 1.2377 would confirm the fall from 1.2616 is still in progress for subsequent decline towards key support at 1.2335.
In view of this, we are holding on to our short position entered at 1.2465 but one should exit on such decline. Only break of said resistance at 1.2496 would abort and suggest an intra-day low is formed instead, risk a stronger rebound to 1.2525-30.
EUR/USD Mid-Day Outlook
Daily Pivots: (S1) 1.0647; (P) 1.0664 (R1) 1.0686; More....
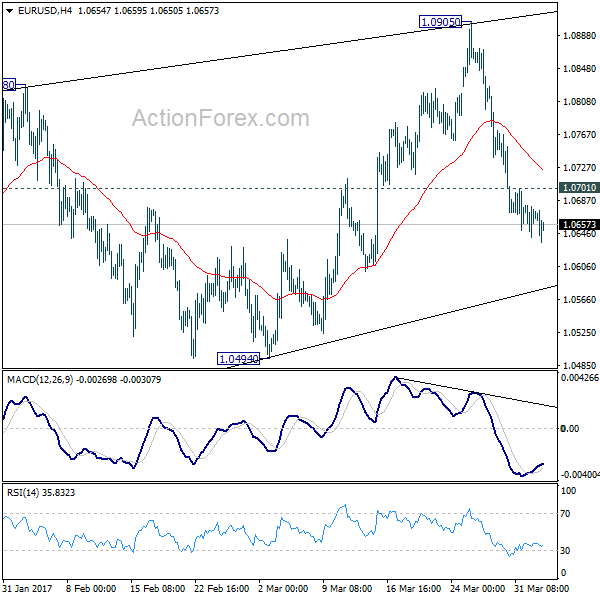
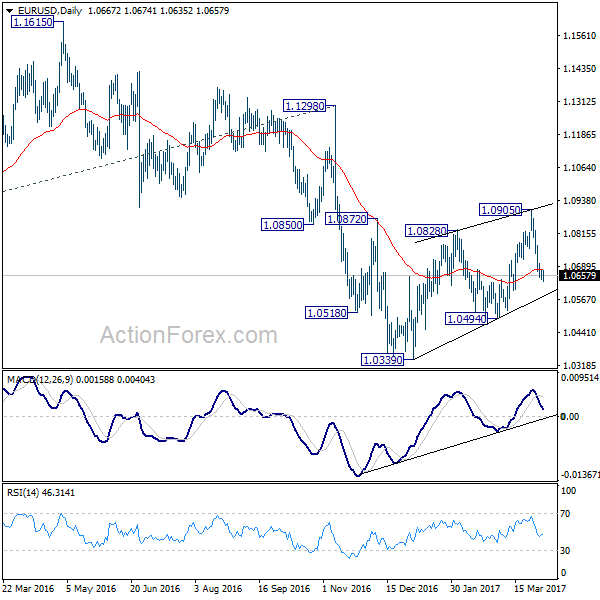
Intraday bias in EUR/USD remains on the downside for 1.0494 support despite diminishing downside momentum. Our view is unchanged that corrective rise from 1.0339 is completed at 1.0905. And more importantly, larger down trend is probably resuming. Break of 1.0494 should confirm this bearish case and target 1.0339 low. Further break of 1.0339 will target parity next. On the upside, above 1.0701 will bring consolidations first before staging another decline.
In the bigger picture, as long as 1.1298 key resistance holds, whole down trend from 1.6039 (2008 high) is still expected to continue. Break of 1.0339 low will send EUR/USD through parity to 61.8% projection of 1.3993 to 1.0461 from 1.1298 at 0.9115. However, considering bullish convergence condition in weekly MACD, break of 1.1298 will indicate term reversal. this would also be supported by sustained trading above 55 week EMA.