Sample Category Title
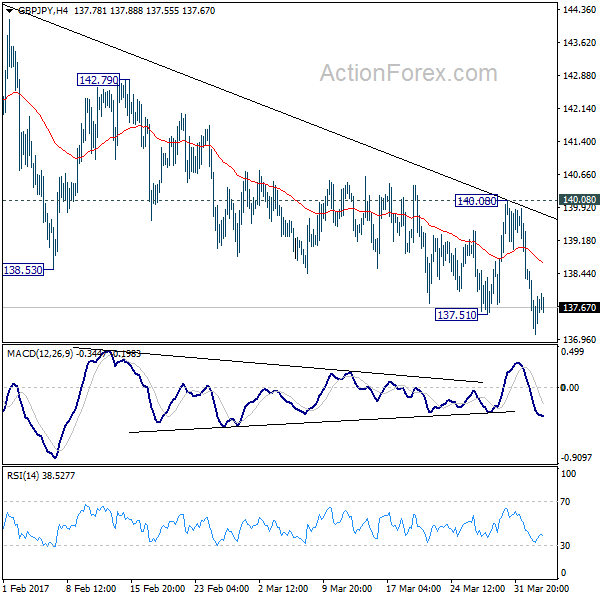
GBP/JPY Daily Outlook
Daily Pivots: (S1) 137.06; (P) 137.77; (R1) 138.46; More...
Intraday bias in GBP/JPY remains on the downside for the moment. The choppy decline from 144.77 is still in progress and should target medium term fibonacci level at 135.39. Overall, price action from 148.42 are seen as a consolidation pattern. We'll look for bottoming around 135.39. Meanwhile, break of 140.08 resistance is needed to indicate short term reversal. Otherwise, outlook will remain bearish in case of recovery.
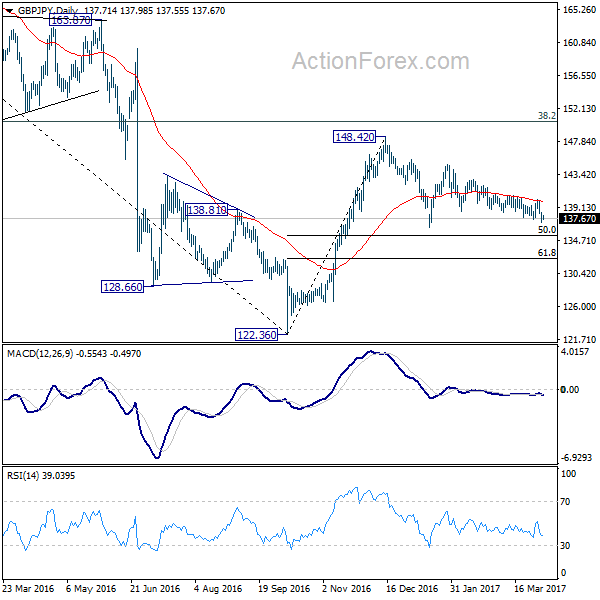
In the bigger picture, price actions from 122.36 medium term bottom are still seen as a corrective pattern. Main focus is on 38.2% retracement of 195.86 to 122.36 at 150.42. Rejection from there will turn the cross into medium term sideway pattern. Or, sustained break of 50% retracement of 122.36 to 148.42 at 135.39 will turn outlook bearish for a test on 122.36 low. Though, sustained break of 150.42 will extend the rebound towards 61.8% retracement of 195.86 to 122.36 at 167.78.
EUR/JPY Daily Outlook
Daily Pivots: (S1) 117.62; (P) 117.99; (R1) 118.55; More...
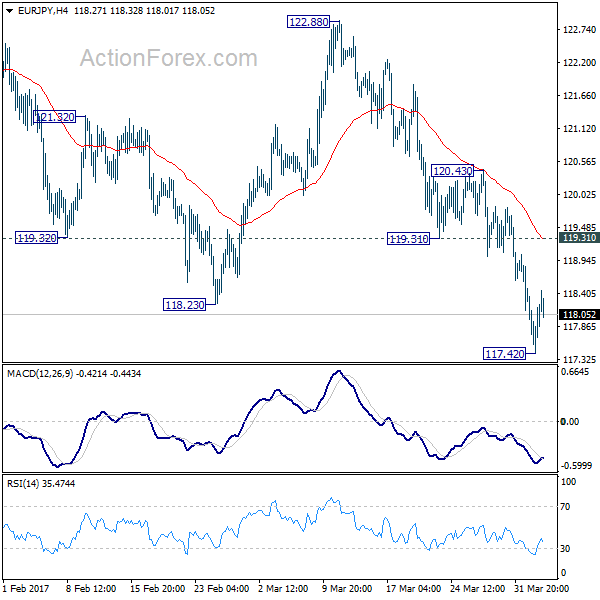
EUR/JPY recovered after forming a temporary low at 117.42 and intraday bias is turned neutral first. Some consolidations would be seen but upside should be limited by 119.31 support turned resistance and bring another decline. Current development suggests that medium term rise from 109.20 has completed at 124.08 already. Below 117.42 will target 61.8% retracement of 109.20 to 124.08 at 114.88 next. Nonetheless, sustained break of 119.31 will turn focus back to 120.43 resistance instead.
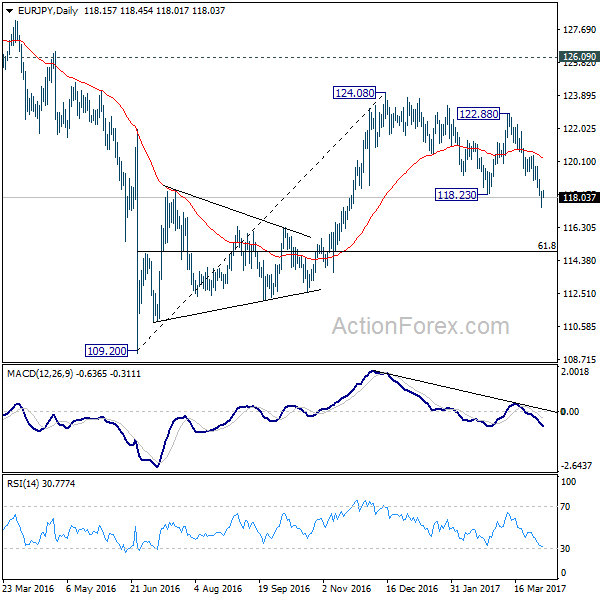
In the bigger picture, the firm break of 38.2% retracement of 109.20 to 124.08 at 118.39 indicates that medium term rise from 109.20 is completed at 124.08. That's well below 126.09 key support turned resistance. Also, EUR/JPY failed to sustain above 55 week EMA. Deeper decline would now be seen back to 109.20 low. Overall, the down trend from 149.76 (2014 high) is not completed yet. Break of 109.20 will resume such down trend towards 94.11 low. In any case, break of 126.09 is needed needed to confirm medium term reversal.
Euro Steady after French Election Debate, Markets Calm after Another North Korea Missile Test
The forex markets are pretty steady in Asian session today. Commodity currencies remain generally soft on mild risk aversion. Traders are cautious ahead of the meeting between US President Donald Trump and China President Xi Jinping. Yet, they are calm in spite of the news that North Korea fired another ballistic missile. Euro is also staying in range after French presidential election TV debate. Yen pares back some gains after treasury yields stabilized but more upside is still favored. In other markets, both gold and WTI crude oil extended recent rally but momentum is not too strong so far.
Le Pen targeted in chaotic TV debate
Eleven candidate joined the marathon French presidential election debate overnight. In a somewhat chaotic situation, far right candidate Marine Le Pen seemed to be the most targeted by the others. Front runner centrist Emmanuel Macron criticized that Le Pen's proposal of reverting to franc was a "reduction in French people's spending power". Conservative François Fillon criticized that Le Pen had no economic plan other than Frexit. Meanwhile, Socialist Benoit Hamon accused Le Pen of benefiting from Isis terrorists.
According to an Elabe poll, 25% said leftist Jean-Luc Melenchon was the most convincing performer in the debate. Fillon got 15% followed by Le Pen's 11%. An OpinionWay poll had Macron, Macron and Fillon tied at 18% and Le Pen at 11%.
North Korea fired another missile ahead of Trump-Xi meeting
It's reported the North Korea fired another ballistic missile into waters off its east coast into the sea of Japan. That came just before the summit between China President Xi Jinping and US President Donald Trump. The US department of state responded by said that "the United States has spoken enough about North Korea. We have no further comment".
North Korea is believed to be one of the top issues at the two-day meeting between Xi and Trump. And Trump has also said that China should use its "great influence" to resolve the issue of North Korea. And, Trump said that "if China is not going to solve North Korea, we will".
Richmond Fed president Lacker abruptly quit
Richmond Fed President Jeffery Lacker abruptly resigned yesterday as he disclosed confidential information to a Wall Street analyst of Medley Global Advisors back in 2012. Lacker said in a statement that he "crossed the line". He admitted that when the Medley analyst brought up confidential information, he "should have declined to comment and perhaps have ended the phone call". Early information regarding Fed's quantitative easing program was passed to the analysts and gave her clients an unfair advantage.
Lacker's lawyer said that the investigation was complete and there was no charge on Lacker. Fed's Office of Inspector General also said that investigation was now complete too.
On the data front...
UK BRC shop price index dropped -0.8%. UK PMI services will be a main focus in European session while Eurozone will release PMI services final. From US, ISM non-manufacturing composite and FOMC minutes will be released.
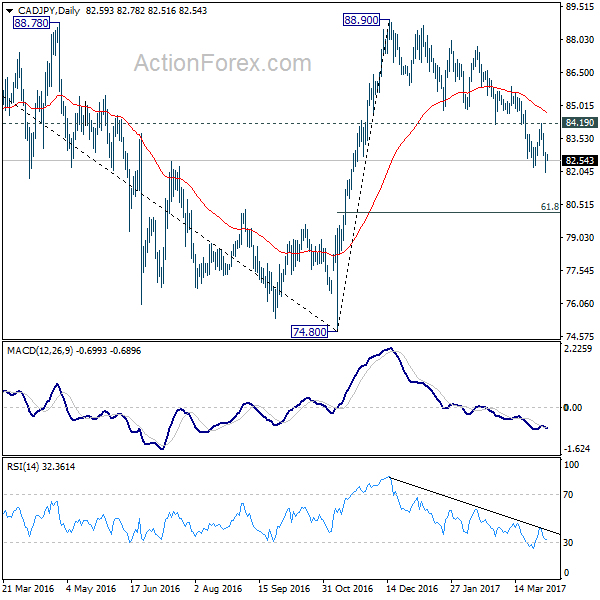
CAD/JPY heading to 80.18
CAD/JPY is one of the biggest losers for the week despite rise in oil price. WTI crude oil extended recent rally overnight and strength carries on in Asian session, hitting as high as 51.36. But that provides little support to the Loonie. Commodity currencies are generally lower this week ahead of the meeting between US Trump and China Xi, as well as non-farm payroll report from US. Yield and stocks stabilized but will face the first test of ADP employment today.
Technically, the fall from 88.90 is clearly corrective looking, especially in comparison to the rise from 74.80 to 88.90. But at this point, it's likely that such correction will go deeper to 61.8% retracement of 74.80 to 88.90 at 80.18. This will be the favored case as long as 84.19 near term resistance holds.
EUR/JPY Daily Outlook
Daily Pivots: (S1) 117.62; (P) 117.99; (R1) 118.55; More...
EUR/JPY recovered after forming a temporary low at 117.42 and intraday bias is turned neutral first. Some consolidations would be seen but upside should be limited by 119.31 support turned resistance and bring another decline. Current development suggests that medium term rise from 109.20 has completed at 124.08 already. Below 117.42 will target 61.8% retracement of 109.20 to 124.08 at 114.88 next. Nonetheless, sustained break of 119.31 will turn focus back to 120.43 resistance instead.
In the bigger picture, the firm break of 38.2% retracement of 109.20 to 124.08 at 118.39 indicates that medium term rise from 109.20 is completed at 124.08. That's well below 126.09 key support turned resistance. Also, EUR/JPY failed to sustain above 55 week EMA. Deeper decline would now be seen back to 109.20 low. Overall, the down trend from 149.76 (2014 high) is not completed yet. Break of 109.20 will resume such down trend towards 94.11 low. In any case, break of 126.09 is needed needed to confirm medium term reversal.
Economic Indicators Update
| GMT | Ccy | Events | Actual | Forecast | Previous | Revised |
|---|---|---|---|---|---|---|
| 23:01 | GBP | BRC Shop Price Index Y/Y Mar | -0.80% | -1.00% | ||
| 7:45 | EUR | Italy Services PMI Mar | 54.3 | 54.1 | ||
| 7:50 | EUR | France Services PMI Mar F | 58.5 | 58.5 | ||
| 7:55 | EUR | Germany Services PMI Mar F | 55.6 | 55.6 | ||
| 8:00 | EUR | Eurozone Services PMI Mar F | 56.5 | 56.5 | ||
| 8:30 | GBP | Services PMI Mar | 53.5 | 53.3 | ||
| 12:15 | USD | ADP Employment Change Mar | 189K | 298K | ||
| 14:00 | USD | ISM Non-Manufacturing Composite Mar | 57 | 57.6 | ||
| 14:30 | USD | Crude Oil Inventories | 0.9M | |||
| 18:00 | USD | FOMC Meeting Minutes |
Market Morning Briefing: Fed And ECB Minutes Today
STOCKS
Almost all stocks look bullish for the medium term except Nikkei. Dax may consolidate in the near term before rising up sharply.
Dow (20689.24, +0.19%) is trying to rise above 20800 while above support near 20450. A failure to rise past 20800 could see a consolidative phase with some downside possibilities; else a break above 20800 is needed to take it to higher levels near 21200-21250.
Dax (12282.34, +0.21%) has played out exactly as expected. A rise to 12375 before falling off to 12220. Now while support at 12220 holds, it would try to rise back towards 12400 levels. The next 2-3 sessions could trade within 12400-12220 region.
Nikkei (18861.68, +0.27%) may test support near 18650 before again bouncing back to higher levels. Immediate resistance is seen near 19070 which if holds could keep the index in the 19070-18650 region for the next few sessions.
Shanghai (3257.64, +1.09%) opened with a gap up and could be headed towards 3275-3280 levels in the near term while support near 3200 holds.
Nifty (9237.85, +0.70%) had moved up quite a bit on Monday and could easily head towards our initial target of 9280 in the coming sessions. Momentum seems to be strongly bullish and a rise towards 9400-9500 levels in the longer term would not be a surprise if 9280 breaks in the initial testing.
COMMODITIES
As seen most of the times in the last few days, Gold (1253) and Silver (18.25) remained indifferent to the global cues and closed below their respective resistances levels of 1263 and 18.50, indicating a complete absence of directional clarity. . We have been expecting 1237 for gold and 17.90 for silver to hold for some time and gradual buying at lower levels can’t be ruled as buyers are taking every dip as a further opportunity for buying.
Copper (2.64) is trading within a range of 2.57-2.70. Only above 2.70, higher resistances of 2.80 can come into consideration. In the medium term 2.55-57 are going to be a strong support now but a close below that could open up 2.55 and 2.49 levels respectively.
Both Brent (52.83) and WTI(51.21) have found support and trading within the range of 52.09-53.45 and 50.30-51.7, though the possibility of a decline towards supports can’t be ruled out. We have US crude oil inventory data at 8.00 pm IST and the U.S. data forecast is -0.1M, decrease in weekly inventory. But a lower than expected decrease or an increase in inventory could open up 50 levels for Brent and 48.25 for WTI respectively.
FOREX
Absolutely no movement in Dollar this week so far but some volatility can be expected after the Fed and ECB minutes release today. Rupee may see some adjustment to the existing positions before the RBI meet tomorrow.
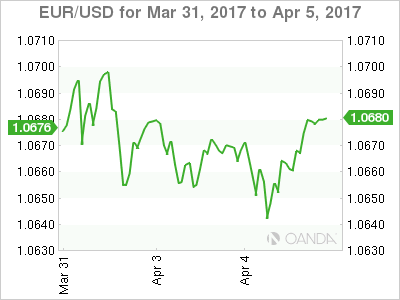
Dollar Index (100.50) has been trading in the narrowest range seen in a long time and this thin range of 100.35-70 may be resolved soon, probably to the higher side. Similar inertial is seen in Euro (1.0676) too, where the risk of further decline to 1.0580 levels remain still open.
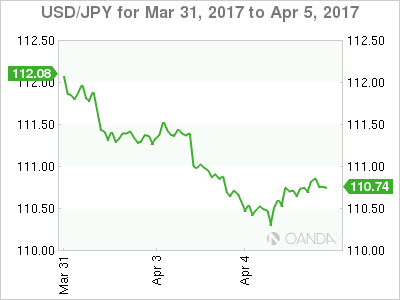
Dollar-Yen (110.74) has broken the support of 110.90-75 and the chances of the upside being capped to 112.00-20 for the week are much higher now with the bears staying in control and immediate support coming near 110.10-109.90.
Pound (1.2440) is in a gradual contracting phase inside our range of 1.2350-1.2600 which may continue for the rest of the week.
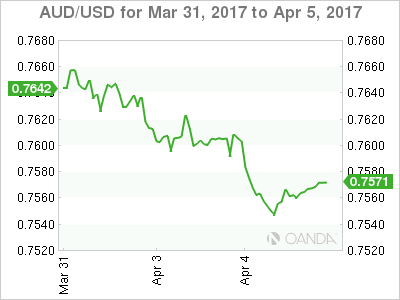
Aussie (0.7567) has registered the weekly low so far at 0.7541, marginally higher from our target/support of 0.7530 and now may bounce towards 0.7650-80 in the coming days if 0.7530-00 holds.
The closing above the immediate resistance of 65.00 has opened up 65.20 for Dollar Rupee (65.02) but the chances of the resistance 65.20 holding and pushing Dollar Rupee down once again remain strong at the moment. Even in the best case scenario, the upside may be limited to 65.50-60 in the near term with the downside still open.
INTEREST RATES
The US-Japan 10YR (2.28%) has broken below the support near 2.3% which may now act as an immediate resistance for the coming sessions. In case the yield spread remains below 2.3%, it could possibly come down towards 2.25-2.20% in the near term. That could possibly indicate a fall in Dollar-yen in the next 2-3 sessions.
The US yields have risen slightly. The 5YR (1.88%), 10yr (2.35%) and the 30Yr (2.99%) are up 2-3bps and could rise some more in the near term.
The UK-US 10YR (-1.30%) is headed downwards and if it moves down further towards -1.33%, Pound could extend some more losses in the near term.
The German-US 10YR (-2.10%) is trading just above support levels and could bounce from there. Also watch out for a bounce in Euro in the coming sessions.
Elliott Wave View: EURJPY Correction In progress
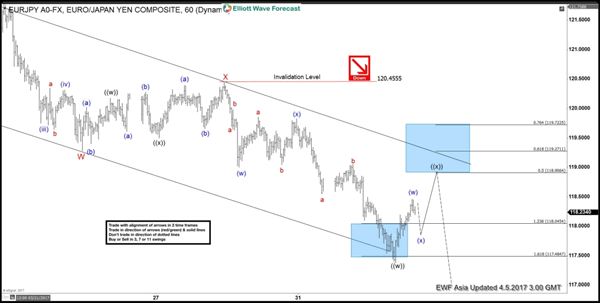
Short term Elliott Wave view in EURJPY suggests that cycle from 3/12 peak (122.89) is unfolding as a double three Elliott wave structure where Minor wave W ended at 119.28 and Minor wave X ended at 120.45. Minor wave Y is in progress and the internal is unfolding also as a double three Elliott wave structure where Minute wave ((w)) ended at 117.38 and wave ((x)) bounce is in progress to correct cycle from 3/28 peak (120.445) towards 118.9 – 119.72 area before pair turns lower. As pair is showing a 5 swing bearish sequence from 3/12 peak as well as from 12/14/2016 peak, more downside is expected in the pair. We don’t like buying the proposed bounce and expect sellers to appear at the above area once wave ((x)) bounce is complete in 3, 7, or 11 swing provided that pivot at 3/28 high stays intact in the first degree.
EURJPY 1 Hour Elliott Wave Chart
US ADP Payrolls Report And FOMC Minutes To Guide Markets
The USD is higher against most major pairs as investors are reducing their appetite for risk and flock to safe havens. The JPY is the only of the majors to gain against the dollar on Tuesday's trading session ahead of the release of the first US employment report of the week and the much awaited minutes from the Fed policy meeting in March.
ADP payrolls report will be published at 8:15 am EDT (12:15 pm GMT). The number of jobs added to employers excluding the government and farming industry is forecasted at 191,000. A slowdown of more than 100,000 form last month's giant gain of 298,000, but still a healthy trend for US employment.
The US Institute for Supply Management (ISM) will pots its non-manufacturing index at 10:00 am EDT (2:00 pm GMT). The ISM non-manufacturing index is expected to come in slightly slower than last month at 57.1. The US crude inventories will be released at 10:30 am EDT (2:30 pm GMT). Oil prices have climbed in anticipation of a drawdown in US inventories last week.
The minutes from the March Federal Open Market Committee (FOMC) meeting will be published at 2:00 pm EDT (6:00 pm GMT). Analysts and investors will be looking through the notes looking for more insight into the Fed's balance sheet and their plan to wind it down going forward. The US central bank wants to avoid another 'taper tantrum' like in 2013 so it will carefully pick what gets communicated to markets.
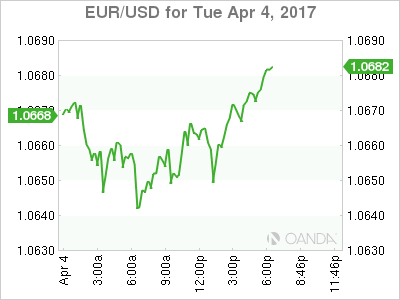
The EUR/USD gained 0.101 in the last 24 hours. The single currency is trading at 1.0661 as the USD gained against most major pairs after risk aversion has gripped the market and made some currencies a safer haven than others. The main topic on the global agenda is the meeting between the Chinese President and US President Donald Trump. Trade and currency manipulation could be part of the discussions, although the market expects a more amicable meeting.
European data will be scarce this week offering little support for the EUR. Last week German confidence was steady at 112.3 and this week PMIs were almost unchanged except a drop in Spanish manufacturing being offset by a gain in Italian data. Retail sales in the EU came in higher than the forecast at 0.7 percent but given the political risk due to the upcoming French elections the EUR will continue to be under pressure as investors look for safe havens.
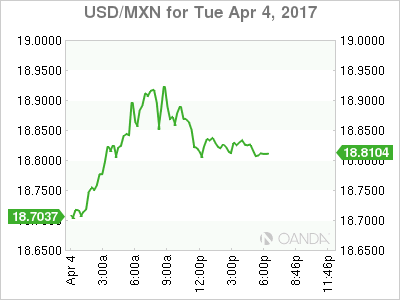
The USD/MXN gained 0.736 in the Tuesday trading session. The pair is trading at 18.6803 as the peso fell alongside LatAm currencies. The USD gained as risk aversion gripped investors ahead of the China-US meeting in Florida and the employment data in the US to be released on Friday. US economic cada has been mixed with manufacturing slowing down as data released on Monday showed (54.2 vs 55.1 forecasted)but the trade balance deficit shrinking more than expected on Tuesday (–43.6B vs –46.0B forecasted).
The private payroll report from the ADP will mark the start of employment releases in the US with a forecasted 191,000 jobs added to the economy. The NFP at the end of the week is anticipated to bring another addition of 150,000 jobs to the economy as a whole, which could boost the USD higher specially if there is anxiety about the China-US meeting and the aftermath of the terrorist attacks in Russia.
Mexico will release its consumer confidence data on Wednesday at 9:00 am EDT and is expected to improve upon last month's drop as the main negative factor was the Trump administration policies that could impact the Mexican economy. The tone towards Mexico has softened while at the same time other trade deals have been explored to offset the possible scenario of a hard breakup of Nafta, although in the past weeks that scenario has lost traction given the comments from the Trump administration. Timing wise the first round of $20 billion forex hedges set by the Mexican central bank will expire tomorrow.
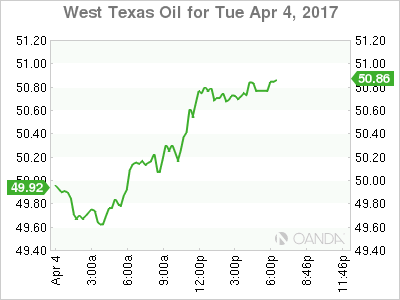
The price of energy rose 1.078 percent during the Tuesday trading session. West Texas is trading at $50.45 as the market is expecting a drawdown in US inventories to be released tomorrow at 10:30 am EDT by the Energy Information Administration (EIA). US production is a higher concern than global supply as even the end of disruptions in Libya has not impacted crude on the downside.
Oil has managed to remain stable thanks to the efforts of the Organization of the Petroleum Exporting Countries (OPEC) and some non-OPEC members who agreed to limit production seeking to bring crude from the lows seen in 2016. The strategy so far has worked, but oil producers not part of the deal, like the US, have started to ramp up production which is offsetting the boost from the OPEC deal. The production cut agreement is for six months and there have been some signs that some members would be willing to extend if it means price stability given the high compliance seen by the nations that are taking part in the deal.
Market events to watch this week:
Wednesday, April 5
4:30am GBP Services PMI
8:15am USD ADP Non-Farm Employment Change
10:00am USD ISM Non-Manufacturing PMI
10:30am USD Crude Oil Inventories
2:00pm USD FOMC Meeting Minutes
Thursday, April 6
7:30 am EUR ECB Meeting Minutes
8:30am USD Unemployment Claims
Friday, April 7
4:30am GBP Manufacturing Production m/m
8:30am CAD Employment Change
8:30am USD Average Hourly Earnings m/m
8:30am USD Non-Farm Employment Change
*All times EDT
APAC Morning: Waiting For Godot, China Offshore CNH.
Another sideways overnight session on currencies and indices as traders look forward to the return of the Chinese market from holiday today.
The New York session fizzled out across most asset classes with stock indices broadly flat and currencies for the most part trading within their defined ranges. The market has a definite waiting for Godot look about it as we look forward to tonight’s ADP Employment and FOMC Minutes to spark some life into things. Locally the China bloc returns from holiday today which may spark some life into USD/CNH and commodities.
Euro
Draghi was a fizzer overnight, but we will get another bite of the cherry tomorrow when he speaks again. We will see a frenzy of Eurozone PMI’s released around 4 pm Singapore this afternoon, with traders looking for signals that the QE driven recovery remains on track. Euro itself continues to mark time in the 1.0630/1.07000 range of the last week. A break of either level most likely bringing some stop-loss action out of the woodwork. In the bigger picture, the key level remains 1.0500.
Australian Dollar
The AUD picked itself up off the floor from 7545 to 7575 in New York trading, following yesterday’s tepid trade data and a dovish RBA. With China back today, it will be interesting to see if the AUD can pick up a tailwind from commodities as China reacts to Cyclone Debbie induced supply disruptions in iron ore and especially coal. The breakdown level at 7590 forms resistance this morning with key support around the 7500 area.
Japanese Yen
Like the AUD, USD/JPY picked itself up off the floor as the Cross/Yen selling noted in Asia yesterday seemed to have run its course. U.S. yields also ticked up in New York giving support to USD/JPY. We will probably have to wait until Friday’s non-farm payrolls to gain more clarity on Yen’s direction if this week’s price action is anything to go by. 110 remains the pivotal support level with the 112.00 area resistance. Expect choppy trading in this range in the meantime.
China offshore CNH
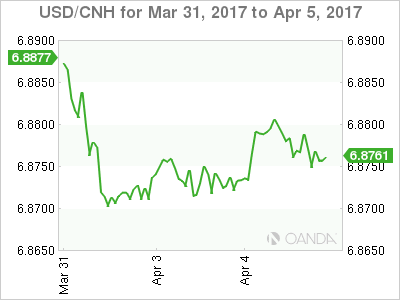
China comes back from two days holiday today, and we may see USD/CNH tick higher to reflect USD strength over the last two days. All eyes will be on President’s Trump and Xi’s meeting in Florida. Having said that, EM flows have been quite strong this week, and any topside in USD/CNH should run into plenty of offers above 6.9000. The chances of CNH/CNY being allowed to trade materially weaker while Mr XI is visiting the U.S. will be almost zero I would think. USD/CNH has well-defined support at 6.8400 with resistance at 6.9000. The action will more likely be in the commodity space today with all eyes on the China iron ore futures.
Does The Herd Still Want To Short Gold?
We asked the question right at the end of March, whether we should short gold. A question that thanks to a retest of resistance is back being asked today.
Price was testing the resistance level shown in the charts on the previous blog post that I've included the link to above and then again quite clearly below:
XAU/USD Daily:
No matter how you handled the setup in that first blog, you should either have taken profit, taken break-even or as the higher time frame resistance level continues to hold, at the very least still be in the trade.
For the sake of this blog post, lets look for another entry, or confirmation that any existing shorts should be safely held onto.
On your own MT4 charts, I'm going to let you zoom in and look for potential retests of short term support turned resistance. Try to compare the chart in the previous gold short blog post and look for similiar setups underneath the higher time frame resistance level that continues to hold.
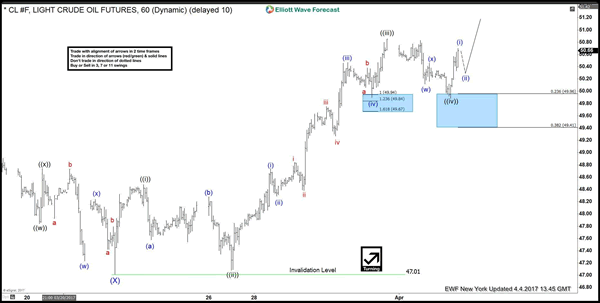
Elliott Wave View: Crude Oil (CL_F) 5 Wave Impulse
Crude Oil (CL_F) started rallying from 03/22 low in a bullish structure which still needs another leg higher to become 5 impulsive waves. The instrument ended the minute wave (( iv )) at the 23.6% Fibonacci retracement area 49.96 from which it managed to bounce higher to resume the move to the upside looking to reach the minimum target of minute wave (( v )) at the inverse 1.236 – 1.618 Fibonacci extension of minute wave (( iv )) that will be at 51.02 – 51.37 area. An other methods for calculating the 5th wave is by measuring (( v )) = (( i )) which gives us a target around the equal legs area at 51.27 – 51.61 and the last methods would be the 61.8 Fibonacci extension of waves (( i )) + (( iii )) that gives us a higher target around 52.19 area.
After ending 5 waves up, Crude Oil should make a 3 wave pull back and extend higher provided 5 waves up from 03/22 low is not part of an expanded FLAT. In either case, from one of the above mentioned area, we can see Crude Oil pulling back in 3 waves at least. We don't like selling it even after wave ((v)) up has completed as we don't pick tops or bottoms and instrument has a bullish 5 swings sequence in the daily chart also.
Crude Oil (CL_F) 1 Hour Elliott Wave Chart 4.4.2017
US: Factory Orders Gain More Ground in February
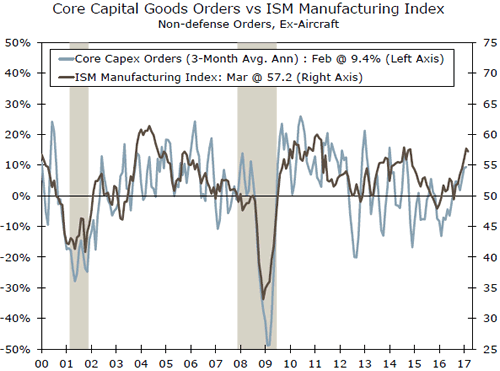
Another surge in aircraft led factory orders 1.0 percent higher in February. Orders for January were revised up from a 1.2 percent increase to a 1.5 percent gain on stronger core capital goods orders. While nondefense capital goods orders ex-aircraft slipped 0.1 percent in February, the trend remains solidly upward with core orders rising at a 9.4 percent three-month average annualized rate.
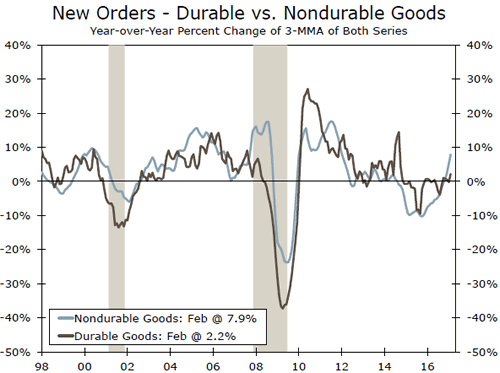
Factory orders rose 1.0 percent in February, supported by a jump in aircraft orders. The trend in core capital goods orders looks a bit better after upward revisions to January. Nondurable goods continue to trek higher.
Ex-Aircraft, Moderate Rise in Factory Orders
Another surge in aircraft led factory orders 1.0 percent higher in February. Orders for January were revised up from a 1.2 percent increase to a 1.5 percent gain on stronger core capital goods orders. While nondefense capital goods orders ex-aircraft slipped 0.1 percent in February, the trend remains solidly upward with core orders rising at a 9.4 percent three-month average annualized rate.
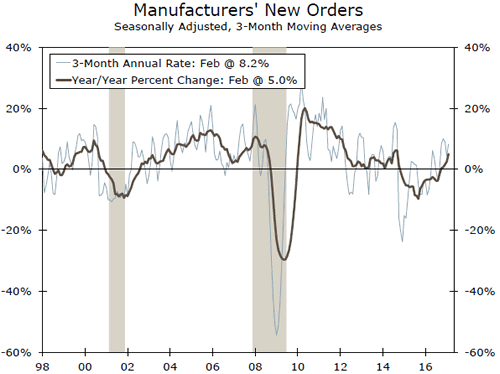
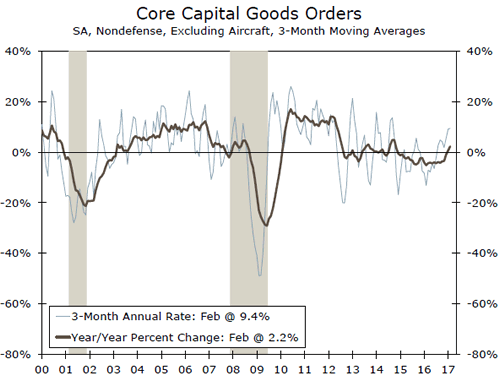
Business Spending on the Mend
Nondurable goods, which were not previously reported, increased 0.2 percent on chemical products. In addition to strengthening demand, a rebound in prices has helped nondurables rise ahead of durable goods over the past year.
Although orders still look weak relative to recent purchasing managers' indices, today's report offers additional evidence that business spending has improved over the first quarter.