Sample Category Title
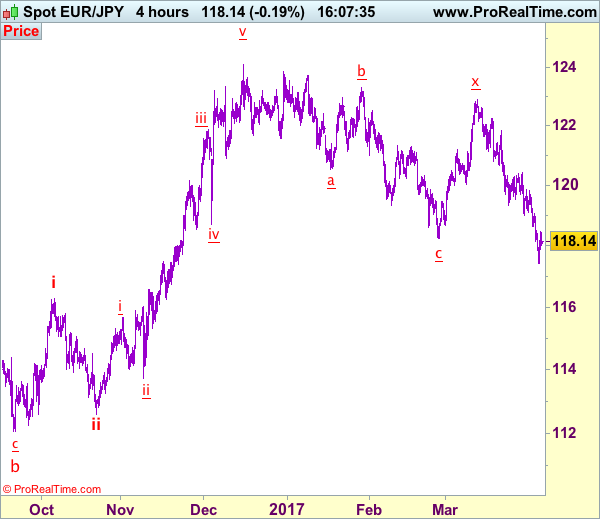
Trade Idea: EUR/JPY – Sell at 118.85
EUR/JPY - 118.13
Recent wave: wave v of (C) ended at 94.12 and major correction in wave A has ended at 149.79
Trend: Near term down
Original strategy:
Sell at 118.60, Target: 116.60, Stop: 119.20
Position: -
Target: -
Stop: -
New strategy :
Sell at 118.85, Target: 116.60, Stop: 119.45
Position: -
Target: -
Stop:-
As the single currency has recovered after falling to 117.43, suggesting consolidation above this level would be seen and corrective bounce to 118.50 is likely, however, reckon upside would be limited to 118.90-00 and bring another decline later. A break of said support at 117.43 would add credence to our bearish view that the decline from 124.10 top (2016 high) is still in progress and further weakness to 117.00-10 would be seen but oversold condition should prevent sharp fall below 116.50-60 and reckon 116.15-20 would hold from here, bring rebound later.
In view of this, would not chase this fall here and would be prudent to sell euro on subsequent rebound as 118.90-00 should limit upside. Above 119.06 resistance would defer and suggest a temporary low is possibly formed, risk rebound to 119.40-50 but price should falter below resistance at 119.85, bring another selloff.
Our latest preferred count is that wave (ii) is ABC-X-ABC which ended at 123.33 and wave (iii) is unfolding with wave iii ended at 100.77, followed by wave iv at 111.57 and wave v as well as the wave (iii) has ended at 97.04, followed by wave (iv) at 111.43 and wave (v) has ended at 94.12 which is also the end of the larger degree v, this also implied the major wave (C) has also ended there, hence major correction has commenced from there with (A) leg unfolding in its lower degree wave c which has possibly ended at 145.69. Under this count, A-B-C wave (B) has commenced with A leg ended at 136.23, wave B at 143.79 and wave C has possibly ended at 149.79.
Our larger degree count is that the decline from 139.26 is wave (C) and is sub-divided into a diagonal triangle i-ii-iii-iv-v with wave i - 105.44, wave ii- 123.33, wave iii - 97.03, wave iv - 111.43, followed by the final wave v as well as the end of wave (C) at 94.12, this also mark the bottom of larger degree wave B. Under this count, major rise in wave C has commenced as an impulsive wave with minor wave III ended at 145.69, wave V is still in progress for further gain to 150.00. Having said that, this so-called wave V could well be the first leg of larger degree 5-waver wave C and this wave C should bring at least a retest of wave A top at 169.97 (July 2008).
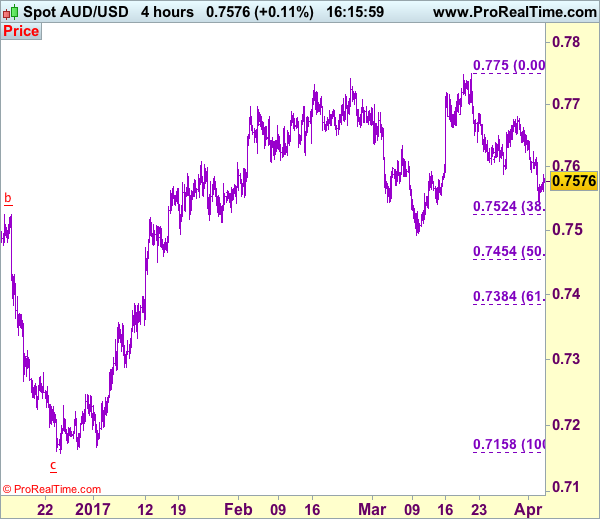
Trade Idea: AUD/USD – Sell at 0.7605
AUD/USD – 0.7577
Recent wave: Wave 5 ended at 1.1081 and major correction has commenced for fall to 0.7000 and then towards 0.6500-10
Trend: Near term up
Original strategy :
Sell at 0.7595, Target: 0.7400, Stop: 0.7655
Position: -
Target: -
Stop: -
New strategy :
Sell at 0.7605, Target: 0.7410, Stop: 0.7665
Position: -
Target: -
Stop:-
As aussie has recovered after falling to 0.7545, suggesting consolidation above this level would be seen and corrective bounce to 0.7600-05 cannot be ruled out, however, reckon upside would be limited to resistance at 0.7625 and bring another decline later, below said support would extend the fall from 0.7750 to 0.7520-25 (38.2% Fibonacci retracement of 0.7158-0.7750) but a break below indicated support at 0.7491 is needed to retain bearishness and bring further subsequent decline to 0.7450-55 (50% Fibonacci retracement), however, near term oversold condition should limit downside to 0.7380-85 (61.8% Fibonacci retracement), risk from there is seen for a rebound later.
In view of this, would not chase this fall here and would be prudent to sell aussie on recovery as 0.7600-05 should limit upside and bring another decline later. Above 0.7625-30 would defer and risk a stronger rebound to 0.7650 but still reckon resistance at 0.7680-85 would limit upside and bring another decline later.
On the 4-hour chart, the move from 0.8066 is the wave 5 with i: 0.8860, ii: 0.8315, wave iii is an extended move ended at 1.0183, iv: 0.9706 and wave v has ended at 1.1081 (also the top of entire wave 5). The subsequent selloff is the major correction which is unfolding as ABC-X-ABC and 2nd A leg has ended at 0.8848, followed by a-b-c wave B which ended at 0.9758, hence, 2nd C wave is now in progress and indicated downside target at 0.7000 and 0.6950 had been met, so further fall to 0.6710-20 cannot be ruled out.
US ADP Employment For March Is Due Out Today
Market movers today
Later today, we are due to get the minutes from the 14-15 March FOMC meeting. We will in particular look for discussions on t he Fed's desire t o begin shrinking it s balance sheet, as Fed Chair Janet Yellen said at the press conference that the FOMC members discussed it at the meeting.
As a warm-up for Fri day's labour market report in the US, ADP employment for March is due out today. Although not a perfect predictor, ADP tends to give a relat ively good idea of what to expect from the official jobs report.
The UK PMI service index released later today will attract attention after it declined in both January and February, suggest ing GDP growth slowed in Q1 17 to around 0.3 -0.4% q/q – down from 0.7% q/q. The service confidence indicator suggests the PMI service index could have moved up marginally to 53.7 in March, which, however, would not change the impression we have that growth slowed at the beginning of 2017.
Selected market news
Yesterday was the second day where the ECB QE purchases of bonds were reduced from EUR80bn a month in Q1 to EUR60bn a month. As it was the case on Monday, it did not change the recent st rong fixed income sent iment and the 10-year German government benchmark bond yield dropped to around 25bp. In addit ion, the market cont inued to price out ECB rate hikes in 2018. The ECB QE data for March was released yesterday and it confirmed a cont inued st rong presence in the short end of the German curve, with an average maturity of German PSPP purchases of 4.7 years.
Yesterday in the UK, PMI const ruct ion fell marginally to 52.2 in March from 52.5 in February. The figures have been quite stable at this level since September 2016.
T wo snap polls aft er yest erday's four-hour French President ial Elect ion debate rated only the Nat ional Front candidate, Marine Le Pen, the fourth most convincing candidate, with roughly half the endorsement of front -runner Emmanuel Marcon, see Bloomberg. Emmanuel Macron and Le Pen are st ill head to head in the polls for the first round (Bloomberg Composite of pools around 25% for both) and Emmanuel Macron's Oddschecker-implied probability indicator of winning the run-off remains above 60%. Current ly, the 10-year French government benchmark bond yield spread to Germany is around 66bp.
It has been a calm session in global financial markets this morning. Asian stock markets have been moving sideways mainly and in fixed income markets, changes in the US 10-year government benchmark bond yield have been subdued since yesterday. Brent oil has climbed to around USD54.4/bbl at the t ime of writ ing. Overnight , Markit PMI service figures for March in Japan came out at 52.9, which is the sixth consecut ive month of expansion and the highest reading since August 2015.
Daily Technical Analysis: EUR/USD Double Divergence Appears After 300 Pip Decline
Currency pair EUR/USD
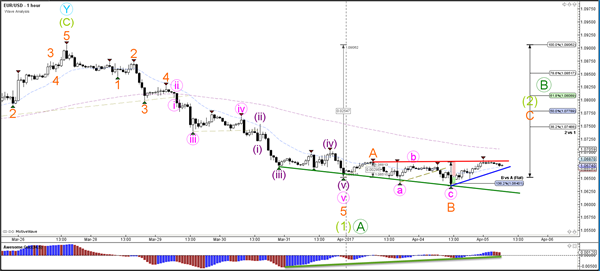
The EUR/USD is struggling to show momentum in either direction and has decided to move sideways. When looking at the divergence visible on the hourly chart, it seems more likely that a wave 2 or B retracement will occur but a break above resistance is needed to confirm.
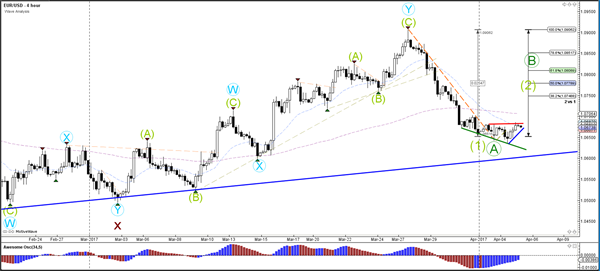
The EUR/USD 1 hour chart is showing a heavy double divergence between the bottoms of price and the oscillator (green lines). The downtrend has lasted 300 pips but could now be in serious danger of a retracement if price manages to break above resistance (red). The wave count could still be in a wave ABC (orange) because it did not break below the 138.2% Fibonacci level of wave B vs A (orange). A break below that level indicates a downtrend continuation whereas a break above resistance (red) could spark a wave C (orange).
Currency pair GBP/USD
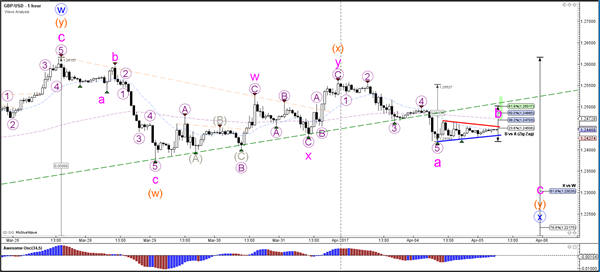
The GBP/USD broke below the support trend line (dotted green) and is now building a small contracting triangle (red/blue lines). A break above resistance (red) could see price challenge a higher resistance trend line (red). A break below support (blue) could see price challenge the 61.8% Fibonacci level of wave X vs W (blue).
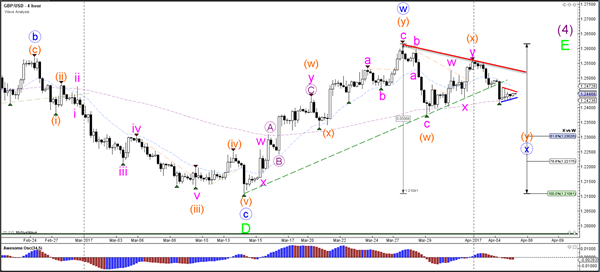
The GBP/USD could be building a larger ABC zigzag (pink) within wave X (blue). A bullish break above the trend line (red) could be short lived as price hits resistance Fibonacci levels of wave B vs A.
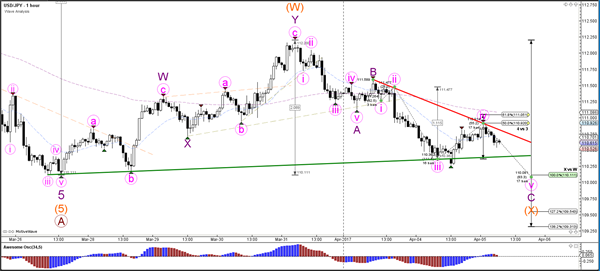
Currency pair USD/JPY
The USD/JPY challenged the support trend line (green) but did manage to break below it. USD/JPY could be in an expanded WXY (orange) of wave B (brown), which seems more likely if price manages to break above resistance (red). The alternative is that the wave B (brown) has already been completed (green B) and price is completing the bearish wave C (brown).
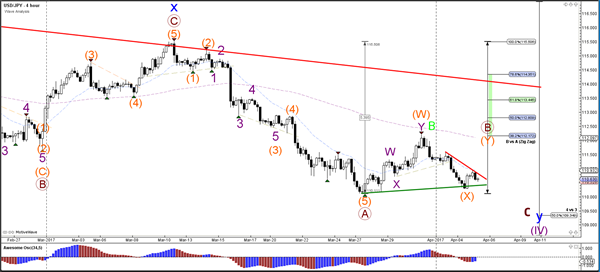
If the USD/JPY is part of a wave C (brown) then price could be building a 5 wave pattern (pink). Price should not retrace deeper than the 50% Fib of wave 4 vs 3 (pink) and a break above the 61.8% Fib and trend line (red) invalidates the 5 waves (pink).
Daily Technical Analysis: EURUSD, GBPUSD, USDJPY, USDCHF
EURUSD
The EURUSD had another indecisive movement yesterday. The bias is neutral in nearest term probably with a little bullish bias but as long as stay below 1.0750 price is still in a bearish phase as a part of the “shooting star” bearish scenario (daily chart) targeting 1.0600 region. A clear break and daily close below that area would expose 1.0500 area. On the upside, a clear break and daily close above 1.0750 would expose 1.0825/73 area. Fundamental focus this week will be on the FOMC meeting minutes and US NFP number which expected to be a catalyst to move the market. Overall I remain neutral.
GBPUSD
The GBPUSD continued its bearish momentum yesterday bottomed at 1.2419. As you can see on my H1 chart below price broke below the bullish channel and moved back below the H1 EMA 200 suggests a potential short-term bearish view. The bias remains bearish in nearest term testing 1.2375. A clear break and daily close below that area would expose 1.2300 or lower. Immediate resistance is seen around 1.2470. A clear break above that area could lead price to neutral zone in nearest term testing 1.2515 area. Fundamental focus this week will be on the FOMC meeting minutes and US NFP number which expected to be a catalyst to move the market.Overall I remain neutral.
USDJPY
The USDJPY attempted to push lower yesterday bottomed at 110.26 but closed higher at 110.73. Price formed another “hammer” formation after a rejection to break below 110.10 key support as you can see on my daily chart below suggests an intense struggle between buyers and sellers around that key level. The bias is neutral in nearest term probably with a little bullish bias testing 111.30. A clear break and daily close back above that area would expose 112.00 or higher. On the downside, a clear break and daily close below 110.10 would expose 108.50 region this week and establish a longer term bearish trend with 111.30 – 112.00 as key resistance. Fundamental focus this week will be on the FOMC meeting minutes and US NFP number which expected to be a catalyst to move the market.

USDCHF
The USDCHF had another indecisive movement yesterday. The bias is neutral in nearest term. Immediate resistance is seen around 1.0060. A clear break and daily close above that area would expose 1.0120 or higher. Immediate support is seen around 0.9990. A clear break and daily close below that area would expose 0.9950 or lower. Fundamental focus this week will be on the FOMC meeting minutes and US NFP number which expected to be a catalyst to move the market.Overall I remain neutral.
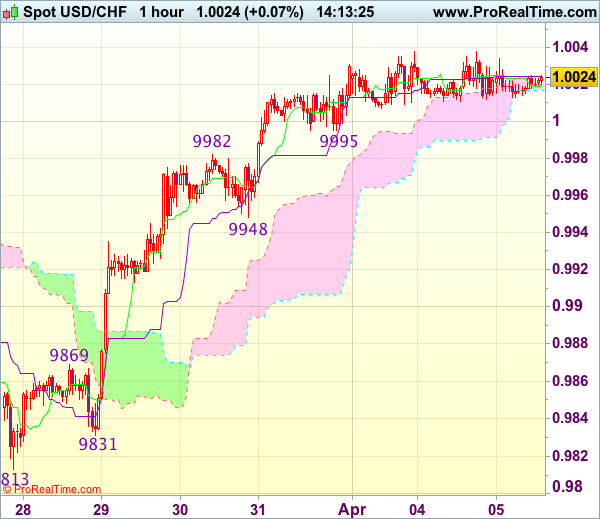
Trade Idea : USD/CHF – Buy at 0.9950
USD/CHF - 1.0027
Most recent candlesticks pattern : N/A
Trend : Near term up
Tenkan-Sen level : 1.0021
Kijun-Sen level : 1.0025
Ichimoku cloud top : 1.0020
Ichimoku cloud bottom : 1.0017
Original strategy :
Buy at 0.9950, Target: 1.0050, Stop: 0.9915
Position : -
Target : -
Stop : -
New strategy :
Buy at 0.9950, Target: 1.0050, Stop: 0.9915
Position : -
Target : -
Stop : -
As the greenback has continued trading with a firm undertone after last week’s rally above 1.0003 resistance, suggesting recent rise from last week’s low at 0.9813 is still in progress and bullishness remains for this move to extend gain to previous support at 1.0060 (now resistance), however, loss of upward momentum should prevent sharp move beyond resistance at 1.0109, risk from there has increased for a retreat to take place later.
In view of this, would not chase this rise here and would be prudent to buy dollar on pullback as said support at 0.9948 should limit downside. Below 0.9931 (50% Fibonacci retracement of 0.9831-1.0031) would abort and signal top is formed instead, bring correction to 0.9905-10 (61.8% Fibonacci retracement) but reckon previous resistance at 0.9869 would hold from here.
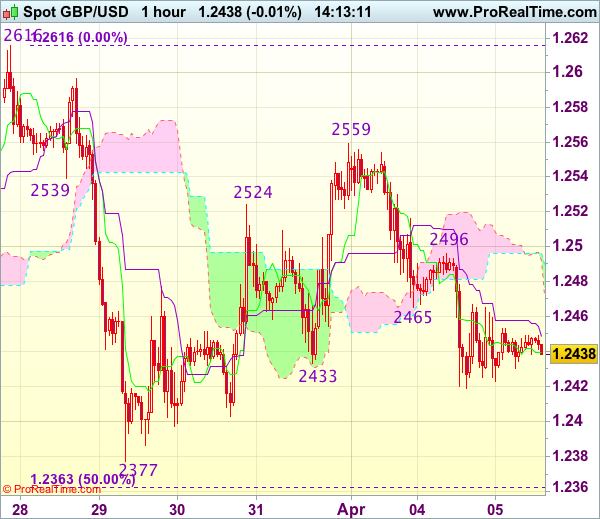
Trade Idea : GBP/USD – Hold short entered at 1.2465
GBP/USD - 1.2445
Most recent candlesticks pattern : N/A
Trend : Near term down
Tenkan-Sen level : 1.2438
Kijun-Sen level : 1.2449
Ichimoku cloud top : 1.2496
Ichimoku cloud bottom : 1.2492
Original strategy :
Sold at 1.2465, Target: 1.2365, Stop: 1.2500
Position : - Short at 1.2465
Target : - 1.2365
Stop : - 1.2500
New strategy :
Hold short entered at 1.2465, Target: 1.2365, Stop: 1.2500
Position : - Short at 1.2465
Target : - 1.2365
Stop : - 1.2500
Outlook remains mildly bearish for the fall from 1.2559 to extend weakness to 1.2400, however, break there i needed to add credence to our view that the rebound from 1.2377 has ended at 1.2559, bring further fall towards support at 1.2377. Looking ahead, only a drop below 1.2377 would confirm the fall from 1.2616 is still in progress for subsequent decline towards key support at 1.2335.
In view of this, we are holding on to our short position entered at 1.2465 but one should exit on such decline. Only break of said resistance at 1.2496 would abort and suggest an intra-day low is formed instead, risk a stronger rebound to 1.2525-30.
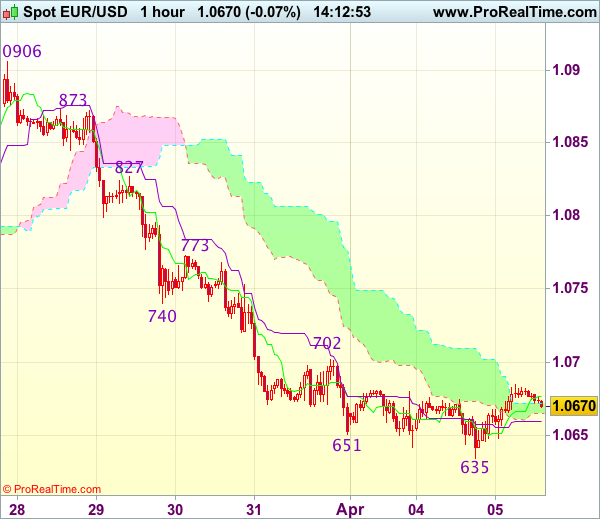
Trade Idea : EUR/USD – Sell at 1.0730
EUR/USD - 1.0670
Most recent candlesticks pattern : N/A
Trend : Near term down
Tenkan-Sen level : 1.0677
Kijun-Sen level : 1.0660
Ichimoku cloud top : 1.0672
Ichimoku cloud bottom : 1.0666
Original strategy :
Sell at 1.0730, Target: 1.0610, Stop: 1.0765
Position : -
Target : -
Stop : -
New strategy :
Sell at 1.0730, Target: 1.0610, Stop: 1.0765
Position : -
Target : -
Stop : -
As the single currency has recovered after falling to 1.0635 yesterday, suggesting minor consolidation above this level would be seen and corrective bounce to 1.0702 cannot be ruled out, however, reckon 1.0730-40 would limit upside and bring another decline, below said support at 1.0635 would add credence to our bearish view that the decline from 1.0906 top is still in progress and extend further weakness to 1.0620, then test of previous chart support at 1.0600, however, a sustained breach below the latter level is needed to retain downside bias for subsequent selloff to 1.0570-75 first.
In view of this, would not chase this fall here and would be prudent to sell dollar on recovery as 1.0730-40 should limit upside. Only a firm break above resistance at 1.0773 would suggest low is formed instead, bring a stronger rebound to 1.0800 but resistance at 1.0827 should remain intact.
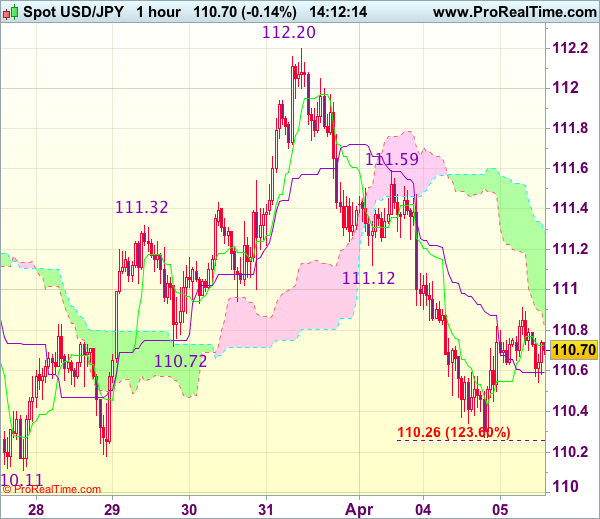
Trade Idea : USD/JPY – Sell at 111.10
USD/JPY - 110.68
Most recent candlesticks pattern : N/A
Trend : Near term down
Tenkan-Sen level : 110.73
Kijun-Sen level : 110.59
Ichimoku cloud top : 111.29
Ichimoku cloud bottom : 110.82
Original strategy :
Sell at 110.95, Target: 109.95, Stop: 111.30
Position : -
Target : -
Stop : -
New strategy :
Sell at 111.10, Target: 110.00, Stop: 111.45
Position : -
Target : -
Stop : -
Dollar’s recovery after falling to 110.27 yesterday suggests minor consolidation above this level would be seen and test of 111.00 cannot be ruled out, however, reckon upside would be limited and resistance at 111.12 should remain intact, bring another decline later to 110.26-27 (1.236 times projection of 112.20-111.12 measuring from 111.59 and said intra-day support), break there would extend the fall from 112.20 to last week’s low at 110.11. Looking ahead, break there is needed to retain downside bias and confirm medium term decline has resumed for further subsequent fall to 109.80-85 (1.618 times projection of 112.20-111.12 measuring from 111.59) which is likely to hold on first testing.
In view of this, would not chase this fall here and would be prudent to sell dollar on recovery as 110.90-95 should limit upside. Above previous support at 111.12 (now resistance) would defer but only break of resistance at 111.59 would abort and signal the fall from 112.20 has ended instead.
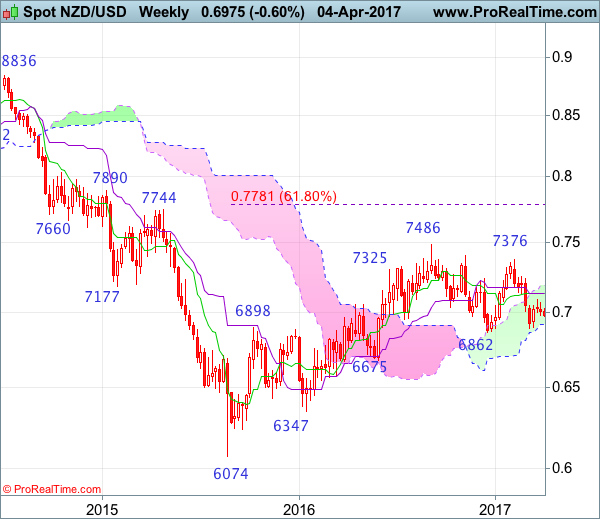
NZD/USD Candlesticks and Ichimoku Analysis
Weekly
- Last Candlesticks pattern: Shooting star
- Time of formation: 5 Sep 2016
- Trend bias: Down
Daily
- Last Candlesticks pattern: Hammer
- Time of formation: 14 Mar 2017
- Trend bias: Near term up
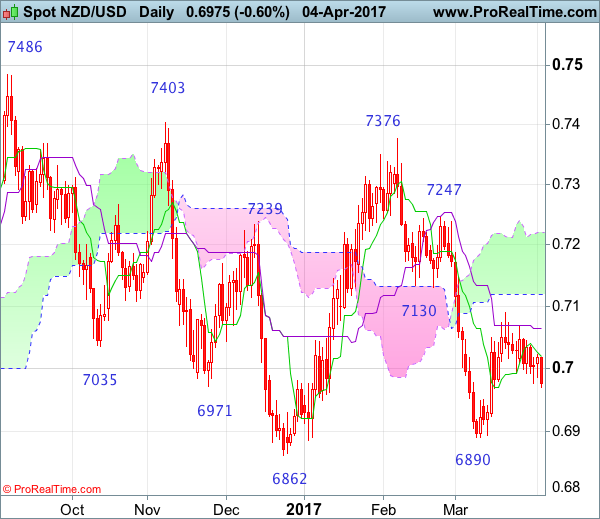
NZD/USD – 0.6974
Although kiwi met resistance at 0.7090 and has retreated since latter part of March and marginal weakness from here cannot be ruled out, as long as support at 0.6890 holds, further consolidation would be seen with mild upside bias for another rebound, above 0.7045-50 would bring test of said resistance at 0.7090 but break there is needed to signal another leg of rebound from 0.6890 low is underway for at least a retracement of recent decline from 0.7376 to the lower Kumo (now at 0.7119), however, break of previous support at 0.7130 is needed to retain bullishness and encourage for further subsequent rise to 0.7185-90 but resistance at 0.7247 should remain intact.
On the downside, whilst marginal weakness from here cannot be ruled out, reckon downside would be limited to 0.6930-40 and said support at 0.6890 should remain intact, bring another rebound later. Only a break below 0.6890 would revive bearishness and extend the fall from 0.7376 top to 0.6862, then towards 0.6775-80 (50% Fibonacci retracement of 0.6074-0.7486) but price should stay well above previous chart support at 0.6675.
Recommendation: Hold long at 0.6980 for 0.7180 with stop below 0.6880
On the weekly chart, as kiwi has retreated after meeting resistance at 0.7090 last month and initial downside risk is seen, reckon indicated support at 0.6890 would hold and bring another rebound later, above 0.7045-50 would bring test of said resistance at 0.7090, break there would suggest low is possibly formed but a weekly close above Kijun-Sen (now at 0.7133) is needed to add credence to this view and encourage for further gain towards resistance at 0.7247. Having said that, as broad outlook remains consolidative, reckon upside would be limited to 0.7300-10 and price should falter below said resistance at 0.7376, bring retreat later.
On the downside, expect pullback to be limited to 0.6930-40 and bring another rebound. Only below said support at 0.6890 would abort and bring test of previous support at 0.6862, however, a breach of latter level is needed to retain bearishness and extend the erratic decline from 0.7486 top to 0.6780 (50% Fibonacci retracement of 0.6074-0.7486) and later towards previous chart support at 0.6675 which is likely to hold from here.