Sample Category Title
Spot GOLD – Correction Is Expected To Reverse Above Daily Cloud Top
Spot Gold is holding near fresh ten-day low at $1239, posted on Friday in extension of previous day’s sharp fall, when the yellow metal lost nearly 1%, driven by stronger dollar.
Pullback from fresh high at $1261 (posted on 27 Mar) is seen as correction ahead of renewed attack at cracked 200SMA ($1259) and final push towards 27 Feb peak at $1263.
The notion is supported by persisting safe-haven demand on political uncertainty.
Bullish daily studies also favor fresh upside, as thick daily cloud (spanned between $1233 and $1193) continues to underpin recovery from $1197 (15 Mar low).
Extended pullback should find support at $1236/33 zone (Fibo 38.2% of $1197/$1261 rally / daily cloud top) to keep bullish structure intact.
Alternative scenario sees risk of deeper correction on penetration into daily cloud and violation of daily Kijun-sen line ($1229) that would expose $1221 (Fibo 61.8%).
Res: 1245, 1250, 1255, 1259
Sup: 1239, 1236, 1233, 1229
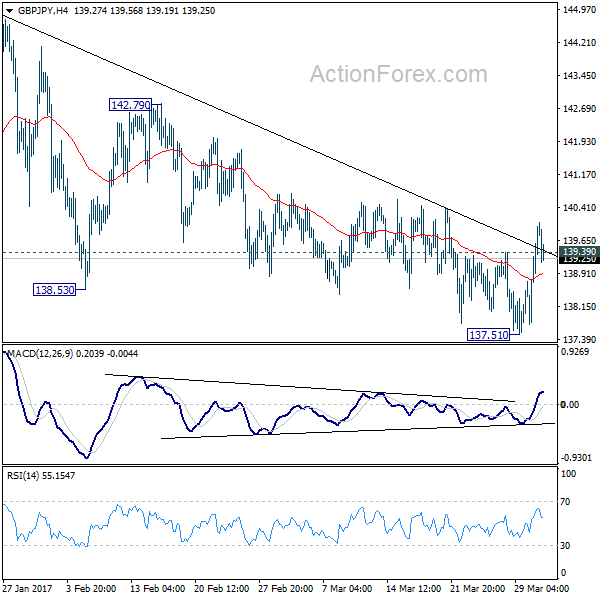
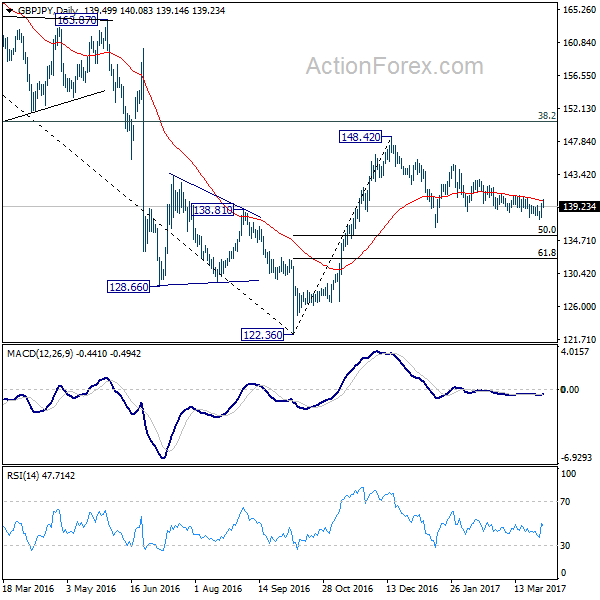
GBP/JPY Daily Outlook
Daily Pivots: (S1) 138.33; (P) 138.96; (R1) 140.19; More...
GBP/JPY's rebound and break of 139.39 minor resistance suggests short term bottoming at 137.51. Fall from 144.77 is possibly completed already. Intraday bias is turned back to the upside for 142.79 resistance first. Break will send GBP/JPY through 144.77 to 148.42 high. Overall, price actions from 148.42 are seen as forming a consolidation pattern. In case of another fall, we'd expect support from 50% retracement of 122.36 to 148.42 at 135.39 to contain downside and bring rebound.
In the bigger picture, price actions from 122.36 medium term bottom are still seen as a corrective pattern. Main focus is on 38.2% retracement of 195.86 to 122.36 at 150.42. Rejection from there will turn the cross into medium term sideway pattern. Or, sustained break of 50% retracement of 122.36 to 148.42 at 135.39 will turn outlook bearish for a test on 122.36 low. Though, sustained break of 150.42 will extend the rebound towards 61.8% retracement of 195.86 to 122.36 at 167.78.
EUR/USD Weakening, GBP/USD Bullish Pressures, USD/JPY Renewed Bullish Pressures.
EUR/USD Weakening.
EUR/USD is getting lower. The pair is heading lower since the pair failed to hold above former resistance given at 1.0874 (08/12/2017 high). Hourly support given at 1.0719 (21/03/2017 low) has been broken. Stronger support can be found at 1.0493 (22/02/2017 low). The short-term technical structure indicates further weakness..
In the longer term, the death cross late October indicated a further bearish bias. The pair has broken key support given at 1.0458 (16/03/2015 low). Key resistance holds at 1.1714 (24/08/2015 high). Expected to head towards parity.
GBP/USD Bullish pressures.
GBP/USD's bullish pressures increase again after the pair exited short-term uptrend channel. Hourly resistance is located at 1.2615 (27/03/2017 high). Hourly support is given at 1.2324 (03/17/2017 low). Expected to show strengthening towards resistance at 1.2771 (05/10/2016 high).
The long-term technical pattern is even more negative since the Brexit vote has paved the way for further decline. Long-term support given at 1.0520 (01/03/85) represents a decent target. Long-term resistance is given at 1.5018 (24/06/2015) and would indicate a long-term reversal in the negative trend. Yet, it is very unlikely at the moment.
USD/JPY Renewed bullish pressures.
USD/JPY's bearish pressures are fading. Hourly resistance can be located at 113.57 (16/03/2017 high) while support is given at 110.11 (27/03/2017 low).
We favor a long-term bearish bias. Support is now given at 96.57 (10/08/2013 low). A gradual rise towards the major resistance at 135.15 (01/02/2002 high) seems absolutely unlikely. Expected to decline further support at 93.79 (13/06/2013 low).
EUR/JPY Daily Outlook
Daily Pivots: (S1) 119.08; (P) 119.46; (R1) 119.84; More...
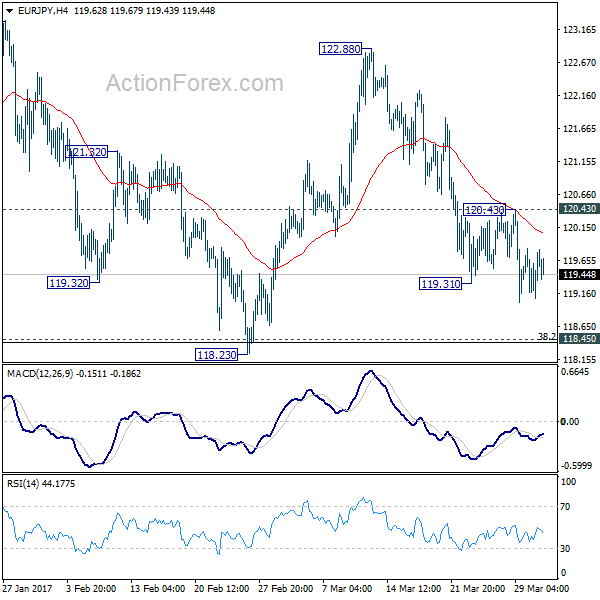
Intraday bias in EUR/JPY remains mildly on the downside as the fall from 122.88 should target 118.23 support. At this point, we're holding on to the view that price actions from 124.08 are forming a consolidation pattern. There, strong support is expected around 118.45 key cluster support level (38.2% retracement of 109.20 to 124.08 at 118.39) to contain downside and bring rebound. On the upside, above 120.43 minor resistance will turn bias back to the upside for 122.88 resistance.
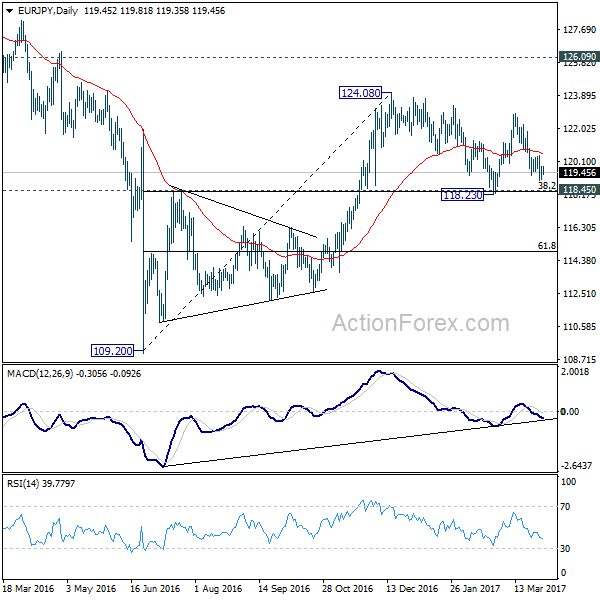
In the bigger picture, we're holding on to the view that medium term rise from 109.20 is still in progress. Focus is on 126.09 key resistance level. Sustained break will confirm completion of the whole decline from 149.76. And rise from 109.20 is of the same degree as the fall from 149.76. In such case, further rally would be seen to 104.04 resistance and possibly above before topping. Meanwhile, rejection from 126.09, or firm break of 118.45 cluster support, will likely extend the fall from 149.76 through 109.20 low.
EUR/AUD Daily Outlook
Daily Pivots: (S1) 1.3924; (P) 1.3992; (R1) 1.4034; More...
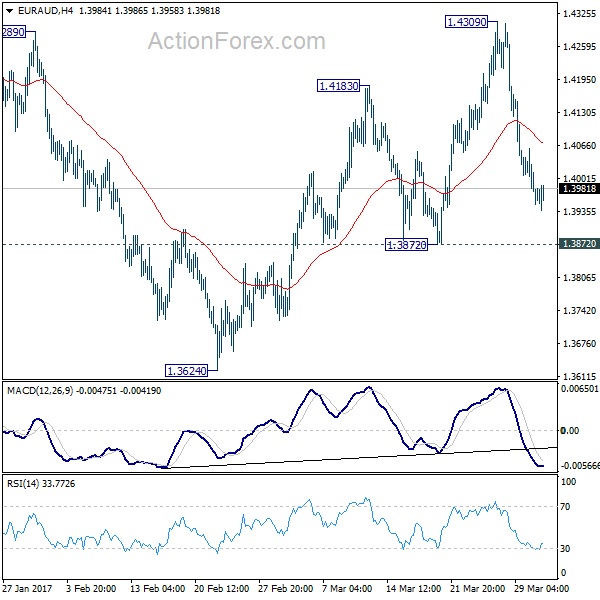
Intraday bias in EUR/AUD remains neutral for the moment. At this point, we're still mildly favoring the case of trend reversal. And, another rise is expected as long as 1.3872 support holds. Above 1.4309 should send the cross through channel resistance (now at 1.4364) to 1.4721 key resistance. However, break of 1.3872 will dampen our bullish view and bring retest of 1.3642 low instead.
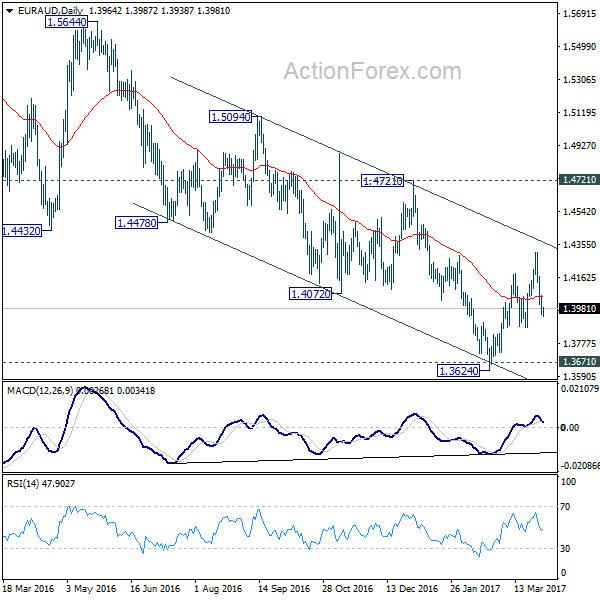
In the bigger picture, price actions from 1.6587 medium term top are viewed as a corrective pattern. Such correction could be completed after testing 1.3671 support. Break of 1.4721 cluster resistance (38.2% retracement of 1.6587 to 1.3624 at 1.4756) should confirm this case and target 61.8% retracement at 1.5455 and above. Overall, we'd expect the up trend from 1.1602 to resume later. However, sustained break of 1.3671 will invalidate our bullish view and would turn focus back to 1.1602 long term bottom.
EUR/GBP Daily Outlook
Daily Pivots: (S1) 0.8523; (P) 0.8592; (R1) 0.8628; More...
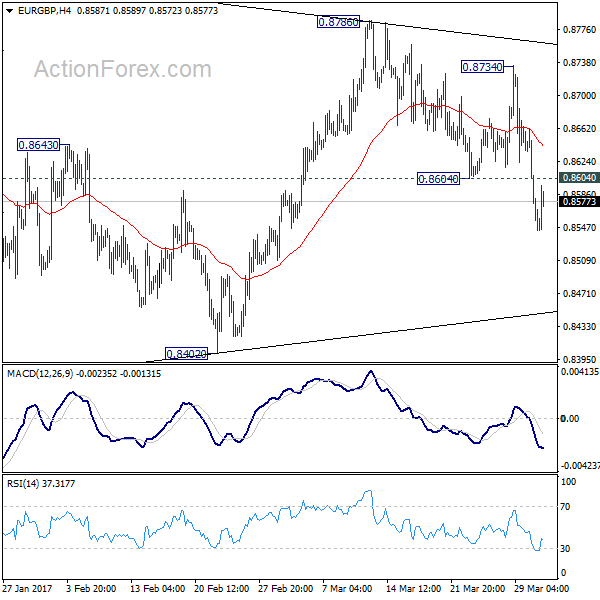
Intraday bias in EUR/GBP remains on the downside for 0.8402 support. Break of 0.8402 will extend the correction from 0.9304 with the third leg. In that case, we'd expect strong support from 0.8116 cluster support to contain downside and bring rebound. On the upside, though, above 0.8604 minor resistance will turn bias neutral first.
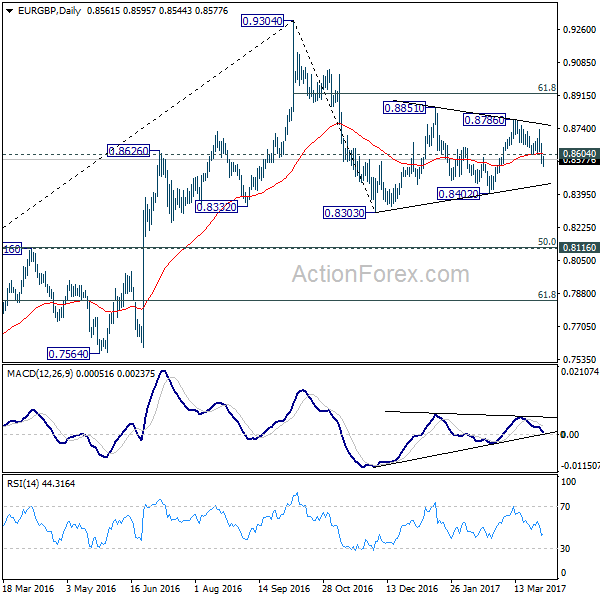
In the bigger picture, price actions from 0.9304 are viewed as a medium term corrective pattern. Deeper fall cannot be ruled out yet. But we'd expect strong support from 0.8116 cluster support (50% retracement of 0.6935 to 0.9304 at 0.8120) to contain downside. Overall, the corrective pattern would take some time to complete before long term up trend resumes at a later stage. Break of 0.9304 will pave the way to 0.9799 (2008 high).
EUR/CHF Daily Outlook
Daily Pivots: (S1) 1.0672; (P) 1.0700; (R1) 1.0715; More...
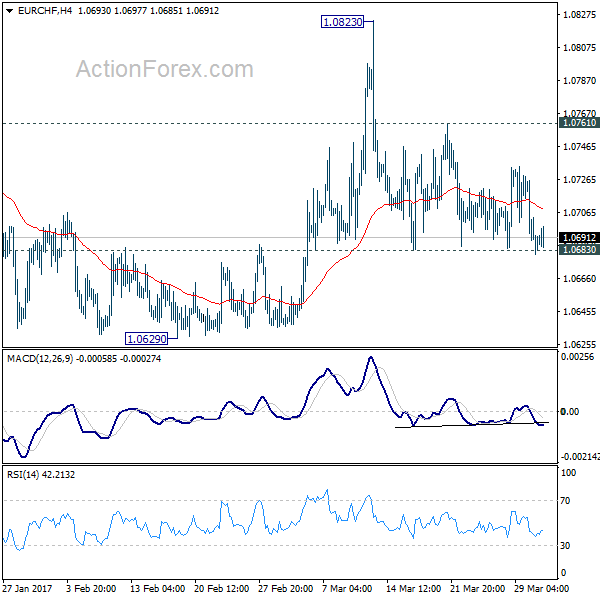
EUR/CHF is still holding on to 1.0683 minor support despite brief breach. Intraday bias stays neutral first. We'd slightly favoring the case of trend reversal on bullish convergence condition in daily MACD. And, further rise is mildly in favor as long as 1.0683 minor support holds. Above 1.0761 minor resistance will turn bias to the upside for 1.0823 resistance first. Break will re-affirm the case of trend reversal and target 1.0897 resistance next. However, firm break of 1.0683 minor support will turn bias to the downside for 1.0620 key support level again.
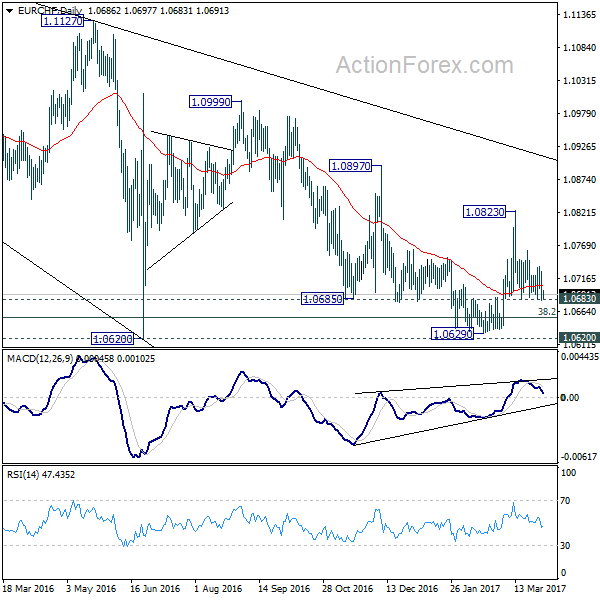
In the bigger picture, the decline from 1.1198 is seen as a corrective move. Decisive break of 1.0897 resistance should confirm that it's completed. And in that case, larger up trend is resuming for another high above 1.1198. Meanwhile, sustained trading below 38.2% retracement of 0.9771 to 1.1198 at 1.0653 will target 50% retracement at 1.0485.
Official China PMI Points To Continued Strength In March
Chinese official PMI manufacturing surprised on the upside, rising to 51.8 (consensus 51.7, previous 51.6). It points to still strong growth at the end of Q1. Caixin PMI manufacturing is due to be released on Monday and we believe this is likely to paint a similar picture.
The biggest strength in the number today was in the export orders index, which rose from 50.8 to 51.0, which is the highest level since 2012. The stronger global economy and effects of the weaker CNY are giving strong support to the export sector currently (see Chart 2).
The overall new orders index also rose from 53.0 to 53.3. It is close to the level at the end of 2016 and probably reflects some moderation in domestic order growth compensated by the strong export growth (see Chart 3). The order-inventory index also increased but is below the peak from December (see Chart 4).
The bottom line is that Chinese growth continued to be strong throughout Q1. Our leading indicators point to a slowdown in 2017, as policy is tighter and investment plans are lower than in 2016. However, the strength of the housing market at the start of 2017 is likely to have postponed the slowdown. We expect the People’s Bank of China (PBoC) to embark on further tightening to cool the housing market, as this is the main concern in China today, together with the rising leverage in the financial system. We believe the PBoC will continue tightening until it sees visible signs that housing is slowing. Investment plans and electricity generation are two of the indicators that suggest softer growth.
With continued strength in China, emerging markets assets and global risk sentiment continue to get support from this front. Some moderation in PMI in coming quarters should weaken the picture but not cause great turmoil. For emerging markets’ assets, carry and valuation have moved to the fore as investment drivers, as there are no imminent risks and the global backdrop is fairly positive. On the China front, the coming meeting between Donald Trump and Xi Jinping is key. Trump continues to highlight the significant US-China deficit as a big problem
AUD/USD Daily Outlook
Daily Pivots: (S1) 0.7628; (P) 0.7653; (R1) 0.7667; More...
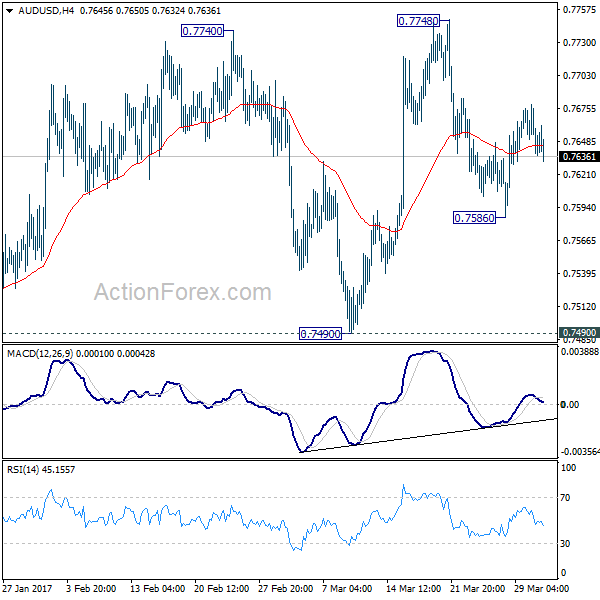
Intraday bias in AUD/USD stays neutral for the moment. On the upside, break of 0.7748 will extend the rally from 0.7158. In that case, we'd expect strong resistance from long term retracement level at 0.7849 to limit upside. On the downside, below 0.7586 will turn bias back to the downside for 0.7490 support. Firm break there will confirm completion of rise from 0.7158. In such case, near term outlook will be turned bearish for 0.7158 support next.
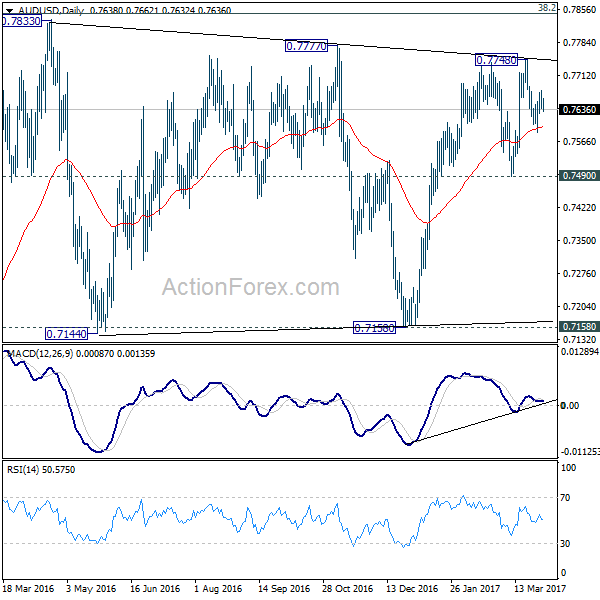
In the bigger picture, we're still treating price actions from 0.6826 low as a correction. And, as long as 38.2% retracement of 0.9504 to 0.6826 at 0.7849 holds, long term down trend from 1.1079 is expected to resume sooner or later. Break of 0.6826 low will target 0.6008 key support level. However, firm break of 0.7849 will indicate that rise from 0.6826 is developing into a medium term rebound, rather than a sideway pattern. In such case, stronger rise should be seen to 55 month EMA (now at 0.8169) and above.
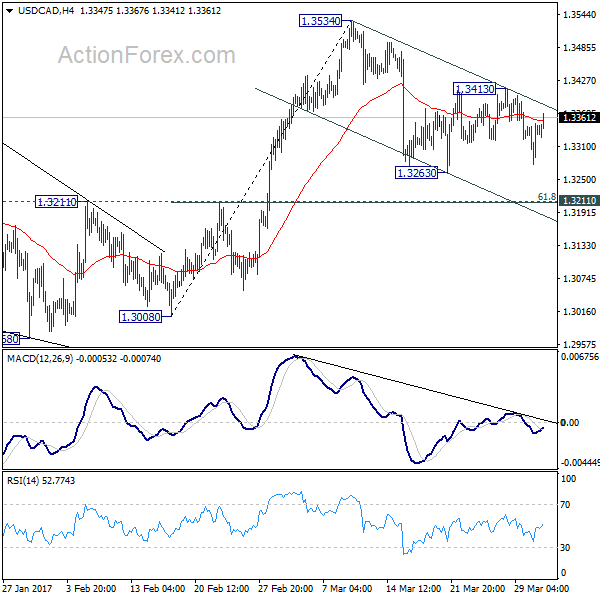
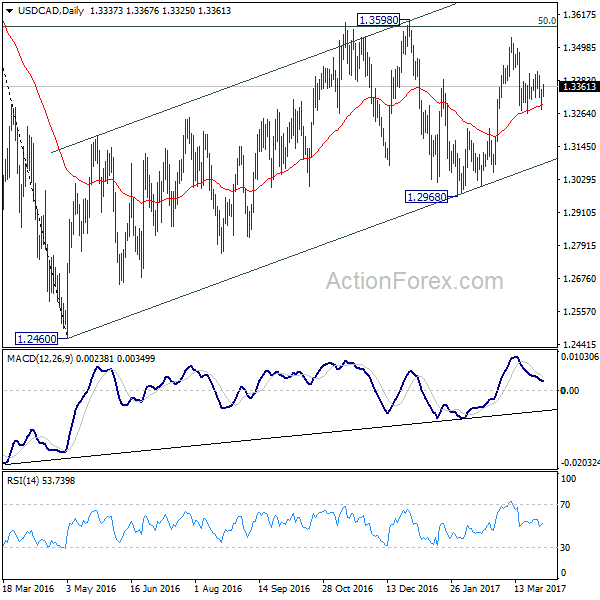
USD/CAD Daily Outlook
Daily Pivots: (S1) 1.3299; (P) 1.3325; (R1) 1.3373; More....
USD/CAD was supported above 1.3263 and recovered. Intraday bias is turned neutral again. Overall, fall from 1.3534 is seen as a correction. Below 1.3263 will bring deeper decline. But we'd expect strong support from 1.3211 cluster level (61.8% retracement of 1.3008 to 1.3534 at 1.3209) to contain downside and bring rebound. On the upside, above 1.3413 will target a test on 1.3534 resistance first. Rise from 1.2968 is expected to resume later to extend through the whole medium term rise from 1.2460 through 1.3598.
In the bigger picture, price actions from 1.4689 medium term top are seen as a correction pattern. The first leg has completed at 1.2460. The second leg is likely still in progress and could target 61.8% retracement of 1.4689 to 1.2460 at 1.3838. We'd look for reversal signal there to start the third leg. Break of 1.2968 wold at least bring at retest of 1.2460 low. However, sustained trading above 1.3838 would pave the way to retest 1.4689 high.