Sample Category Title
USDCHF Making A Strong Bullish Case
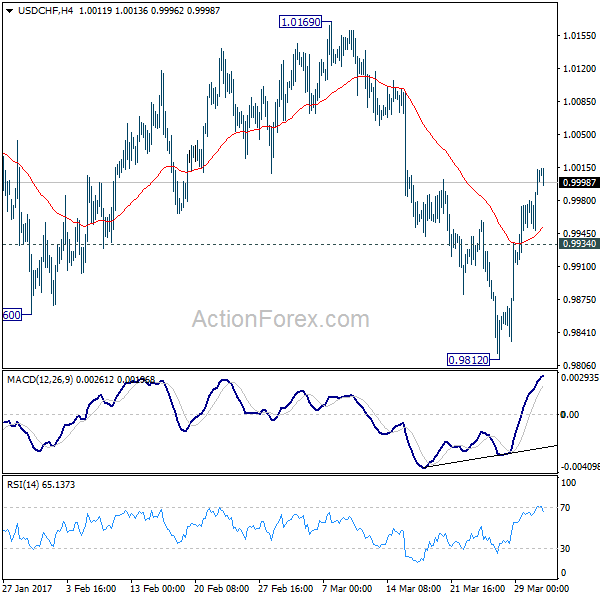
On the updated chart of USDCHF, we see price undergoing a nice sharp and strong rally to the upside, probably as an indication for a reversal. If that is the case, then recent big three wave pattern to the downside is completed and more gains may follow in the near-term. At the moment we see price trading in the first wave 1), that may in sessions ahead find a potential top and make a minimum three wave reversal to the downside. Possible support for the following wave 2) may later then be around the middle channel line.
USDCHF, 4H
USD Extends Its Recent Gains
The US dollar extended its recent gains on Thursday, and during the Asian morning Friday. The move may have been fueled by some relatively optimistic comments from New York Fed President William Dudley, who noted that fiscal policy is likely to shift to a more stimulative setting over time and that the risks for both growth and inflation over the medium-longer term may be shifting gradually to the upside. The market may have paid extra attention to his comments, considering that a couple of weeks ahead of the March FOMC gathering, his remarks boosted dramatically expectations with regards to a hike. The upward revision in the nation's final estimate of Q4 GDP may have helped the dollar as well.
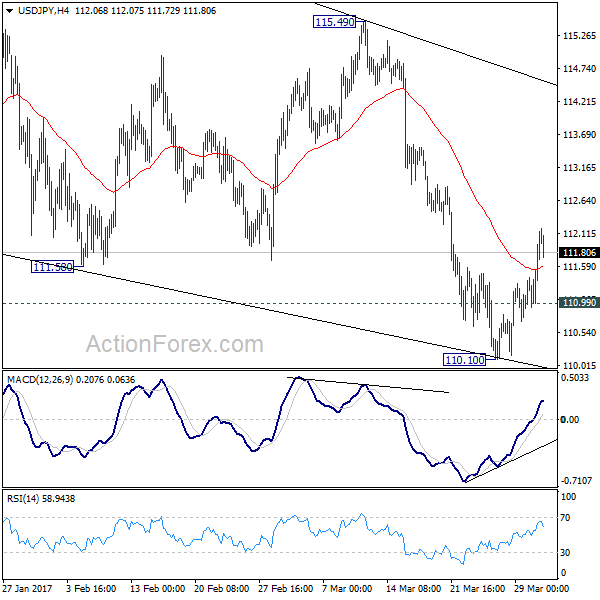
USD/JPY surged yesterday, breaking back above the key obstacle of 111.60 (S2). That move signals the return of the rate back within the sideways range between that hurdle and the 115.50 zone, which contained the price action from the 11th of January until the 22nd of March. If the pair manages to close the week within that range, then we may experience further advances, at least in the days to come. We would expect the rate to challenge the 112.45 (R1) resistance first, where a break may set the stage for the next one, at 112.90 (R2).
Today, the focus of USD traders will probably turn to the core PCE price index for February, as it is the Fed's favorite inflation measure (see below). Another point of interest today may be that President Trump is expected to sign an executive order aimed at identifying trade abuses that contribute to the US trade deficit. In our view, this could reignite market concerns regarding increased global protectionism and may have an impact on the rhetoric of central banks such as the RBNZ and the RBA, considering that both of those economies are heavily export-oriented.
Euro investors lock their gaze on inflation data
Today, during the European morning, we get Eurozone's preliminary CPI data for March. The forecast is for the headline CPI rate to have slid to +1.8% yoy from +2.0%, while the core rate is expected to have remained unchanged. We see the risks surrounding the headline rate as skewed to the downside, considering the disappointing German print, as well as the slowdown in the yearly change of oil prices.
Nonetheless, following repeated signals from ECB policymakers, we expect investors to focus primarily on the core rate. In case the headline rate declines but the core stays unchanged as anticipated, we may see a modest negative reaction in EUR. That said, any surprise in the core rate could fuel a much bigger reaction in the currency, as investors adjust their expectations regarding the next ECB move.
EUR/USD continued its tumble yesterday to find support slightly above the 1.0665 (S1) barrier. The short-term sentiment towards this pair has shifted negative on Wednesday following the Reuters report on the ECB's signals. Our view remains the same as yesterday. The pair is possible to continue drifting lower in the short run, but it is too early to call for a bearish medium-term outlook. The possibility for a higher low on the daily chart still exists and as such, although we see a negative short-term picture, we remain flat on a longer-term perspective.
As for the rest of today's highlights
In the UK, the final estimate of Q4 GDP for 2016 is due out. Given that these data will be released on the final day of Q1 2017, we will view them as being outdated. The reaction in GBP may remain limited.
From the US, we also get the core PCE price index for February, though no forecast is available. Our own view is that the core PCE rate may have remained unchanged with risks skewed to the downside. We base this view on the ISM manufacturing and non-manufacturing surveys for the same month, as well as the downtick in the core CPI rate. We also get personal income and spending data for February. Expectations are for both income and spending to have risen at the same pace as the previous month, but given that retail sales slowed notably during the month, there is the possibility for spending print to follow suit. Bearing all these in mind, we think that the reaction in USD may be negative at these releases. We also get the Chicago PMI for March.
From Canada, we get GDP data for January.
As for the speakers, we have Minneapolis Fed President Neel Kashkari, St. Louis Fed President James Bullard, and BoE Chief Economist Andy Haldane on the agenda.
USD/JPY
Support: 111.90 (S1), 111.60 (S2), 111.00 (S3)
Resistance: 112.45 (R1), 112.90 (R2), 113.50 (R3)
EUR/USD
Support: 1.0665 (S1), 1.0630 (S2), 1.0600 (S3)
Resistance: 1.0700 (R1), 1.0725 (R2), 1.0770 (R3)
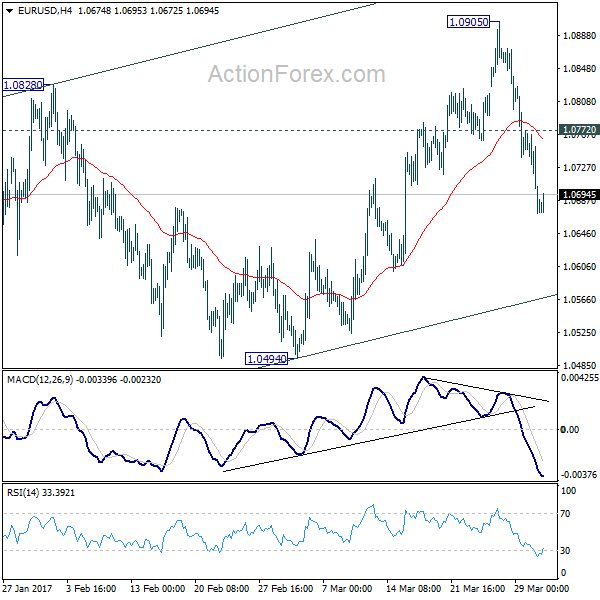
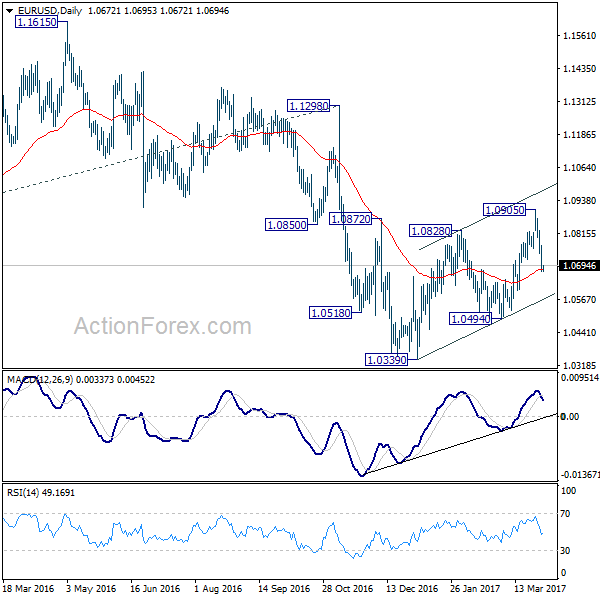
EUR/USD Daily Outlook
Daily Pivots: (S1) 1.0727; (P) 1.0777 (R1) 1.0814; More.....
Intraday bias in EUR/USD remains on the downside as fall from 1.0905 continues. Corrective rise from 1.0339 could be completed at 1.0905. Sustained trading below 55 day EMA (now at 1.0682) will affirm this view and target 1.0494 resistance for confirmation. On the upside, above 1.0798 minor resistance will turn bias back to the bias up to the upside for 1.0905 instead.
In the bigger picture, as long as 1.1298 key resistance holds, whole down trend from 1.6039 (2008 high) is still expected to continue. Break of 1.0339 low will send EUR/USD through parity to 61.8% projection of 1.3993 to 1.0461 from 1.1298 at 0.9115. However, considering bullish convergence condition in weekly MACD, break of 1.1298 will indicate term reversal. this would also be supported by sustained trading above 55 week EMA.
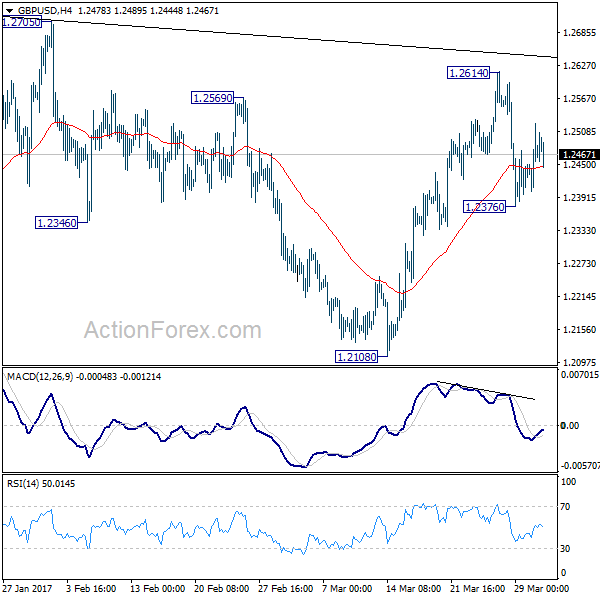
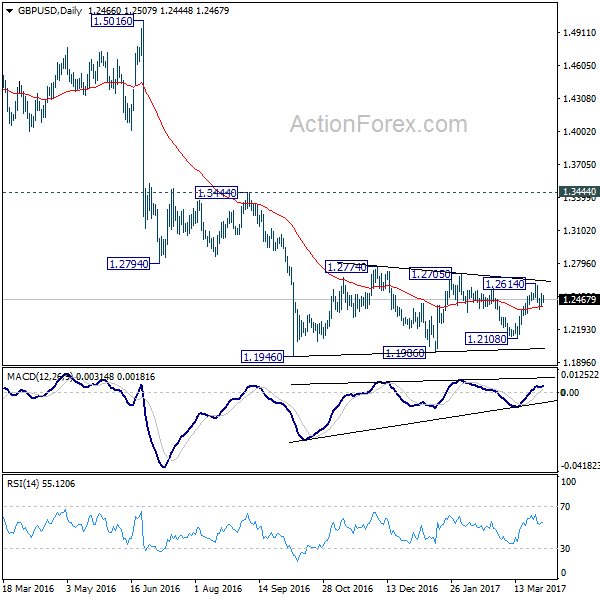
GBP/USD Daily Outlook
Daily Pivots: (S1) 1.2405; (P) 1.2465; (R1) 1.2527; More...
GBP/USD's recovery from 1.2376 is weak so far and intraday bias is turned neutral first. Break of 1.2614 will extend the rise from 1.2108. Overall, price actions from 1.1946 are viewed as a consolidation pattern pattern. Upside should be limited by 1.2705/2774 resistance zone to bring larger down trend resumption eventually. On the downside, below 1.2376 will target 1.2108 support next. Break there will be an early sign of larger down trend resumption.
In the bigger picture, fall from 1.7190 is seen as part of the down trend from 2.1161. There is no sign of medium term reversal yet. Sustained trading below 61.8% projection of 2.1161 to 1.3503 from 1.7190 at 1.2457 will target 100% projection at 0.9532. Overall, break of 1.3444 resistance is needed to confirm medium term bottoming. Otherwise, outlook will remain bearish.
USD/CHF Daily Outlook
Daily Pivots: (S1) 0.9969; (P) 0.9990; (R1) 1.0033; More.....
Intraday bias in USD/CHF remains on the upside as rebound from 0.9812 short term bottom continues. Sustained trading above 55 day EMA (now at 1.0021) will argue that whole decline from 1.0342 has completed. Further rise should then be seen to 1.0169 resistance for confirmation. On the downside, below 0.9934 minor support will turn bias back to the downside for 0.9812 instead.
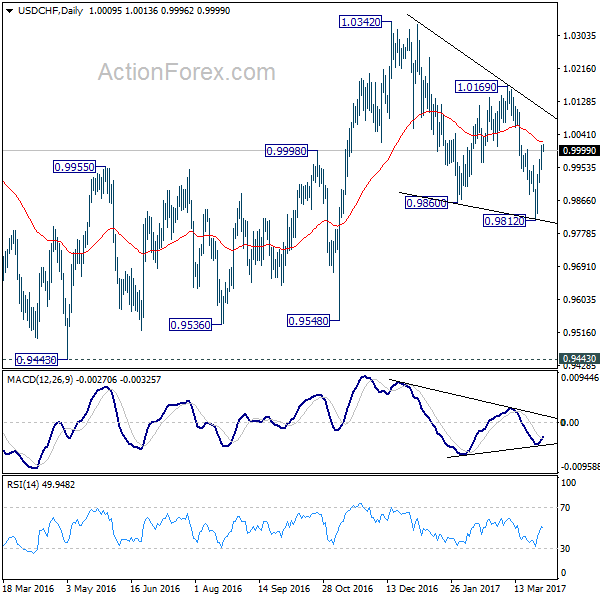
In the bigger picture, USD/CHF is staying in medium term sideway pattern between 0.9443/1.0342. In any case, decisive break of 1.0342 resistance is needed to confirm underlying strength. Otherwise, we'll stay neutral in the pair first. In case of deeper fall, we'd expect strong support from 0.9443/9548 support zone.
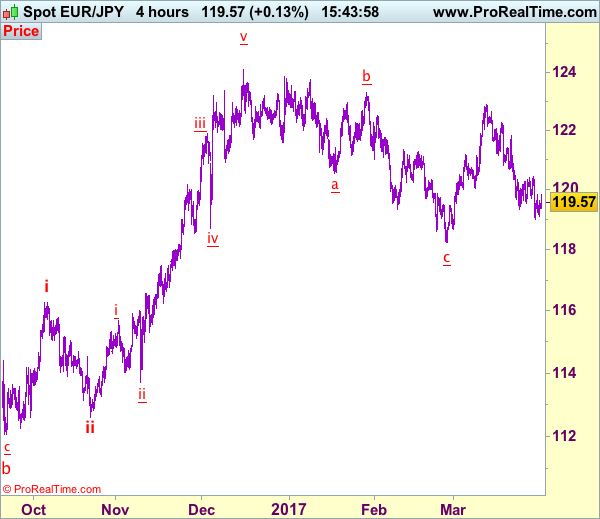
EUR/JPY Elliott Wave Analysis
EUR/JPY - 119.52
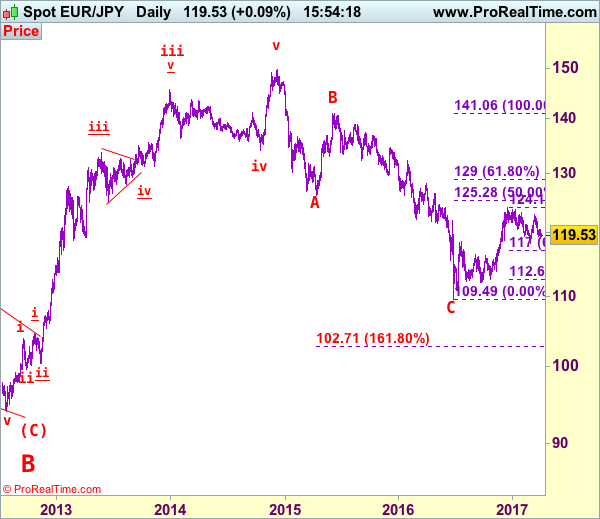
EUR/JPY: Wave v as well as larger degree wave (C) ended at 94.11 and first leg of larger degree wave C upmove has possibly ended at 149.79 and wave 2 correction has possibly ended at 109.49.
The single currency only recovered to 120.44 (we recommended in our previous update to sell at 120.50 and missed the short entry) before meeting renewed selling interest and price has dropped again, adding credence to our view that the fall from 122.89 top (last week’s high) is still in progress, this move also signal the rebound from 118.24 has ended at 122.89, hence downside risk remains for further weakness to 118.75-80, however, still reckon said support at 118.24 would remain intact and bring another rebound later. Looking ahead, only a break below said support at 118.24 would retain bearishness and signal the erratic decline from 124.10 top has resumed for further fall to 117.50-60 and later towards 117.00 (61.8% Fibonacci retracement of 112.61-124.10) but downside should be limited to 116.00.
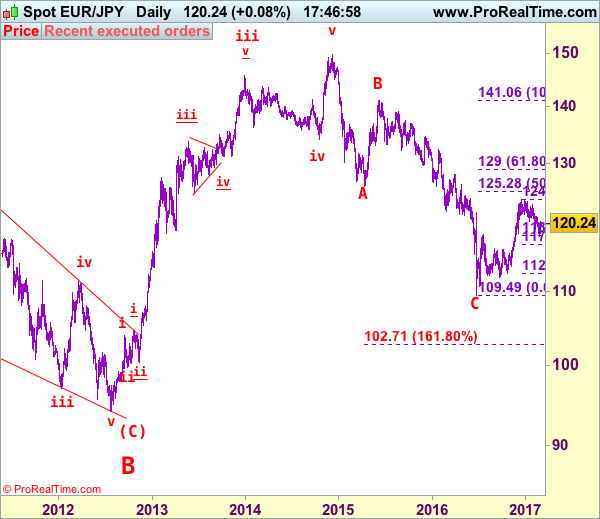
The daily chart is labeled as attached, early selloff from 169.97 (July 2008) to 112.08 is wave (A) of B instead of end of entire wave B and then the rebound from there to 139.26 is wave (B), hence, wave (C) has possibly ended at 94.12 with a diagonal triangle as labeled in the daily chart, hence upside bias is seen for further gain. Recent rally above indicated retracement level at 116.69 (50% Fibonacci retracement of the intermediate fall from 139.26-94.12) adds credence to this view and signal major reversal has commenced but first leg of this wave C has possibly ended at 149.79, hence wave 2 has commenced with wave A ended at 126.09, followed by wave B at 141.06, wave C commenced and could have ended at 109.49, above 125.00 would add credence to this view.
On the upside, although initial recovery to 119.90-00 cannot be ruled out, reckon upside would be limited to said resistance at 120.44 and bring another decline later. Only above indicated resistance at 121.84 would abort and signal the retreat from 122.89 has ended instead, bring further gain to 122.25-30, however, as broad outlook remains consolidative, reckon upside would be limited and said resistance at 122.89 would remain intact.
Recommendation: Sell euro at 120.40 for 118.50 with stop above 121.40.
To re-cap the corrective upmove from the record low of 88.93 (18 Oct 2000), the wave A from there is subdivided as: 1:88.93-113.72, 2:99.88 (1 Jun 2001), 3:140.91 (30 May 2003), 4:124.17 (10 Nov 2003) and 5 ended at record high of 169.97 (21 Jul 2008). The brief but sharp selloff to 112.08 is viewed as a-b-c x a-b-c wave (A) of B. The subsequent rebound to 139.26 is (B) of B and (C) of (B) has possibly ended at 94.12 and in any case price should stay well above previous chart support at 88.93, bring rally in larger degree wave C towards 150.00.
USD/CHF Elliott Wave Analysis
USD/CHF – 0.9999
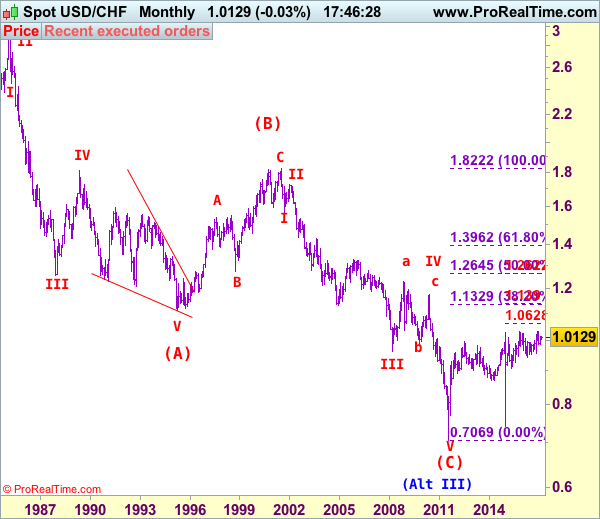
USD/CHF – Wave IV ended at 1.1730 and wave V has possibly ended at 0.7068
Although the greenback did meet renewed selling interest at 1.0003 (we recommended in our previous update to sell at 1.0000) and dropped to as low as 0.9815 (just missed our downside target at 0.9800), as decent demand emerged there and dollar has staged a strong rebound, suggesting low has possibly been formed and consolidation with mild upside bias is seen for another test of 1.0003, however, a daily close above previous support at 1.0060 is needed to add credence to this view, bring further fain to 1.0105-10. Having said that, price should falter below resistance at 1.0171, bring retreat later. In the unlikely event dollar breaks above said resistance at 1.0171, this would revive our bullish view for the erratic rise from 0.9861 to extend further gain to 1.0200 and possibly test of resistance at 1.0248, however, a daily close above there is needed to signal the retreat from 1.0344 has ended at 0.9861, bring eventual retest of 1.0344.
Our preferred count on the daily chart is that early selloff to 0.9630 is an end of the larger degree wave III and major correction is unfolding from there with a leg ended at 1.2298 (Nov 2008 with (a): 1.0625, (b):1.0011 and (c):1.2298), wave b ended at 0.9910 with (a): 1.0370, (b): 1.1967, (c): 0.9910. The rise from there to 1.1730 is the wave c which also marked the end of wave IV and wave V has possibly ended at 0.7068.
On the downside, whilst pullback to 0.9945-50 cannot be ruled out, reckon downside would be limited to 0.9910-15 and bring another rise later. Below 0.9900 would suggest the rebound from 09815 has ended instead bring another fall towards said support at 0.9815. Looking ahead, only a break below this level would confirm another leg of major fall from 1.0344 top is underway for further fall to 0.9735-40, however, oversold condition should prevent sharp fall below 0.9675-80 and price should stay well above 0.9600, bring rebound later.
Recommendation: Exit short entered at 1.0000 and stand aside for this week
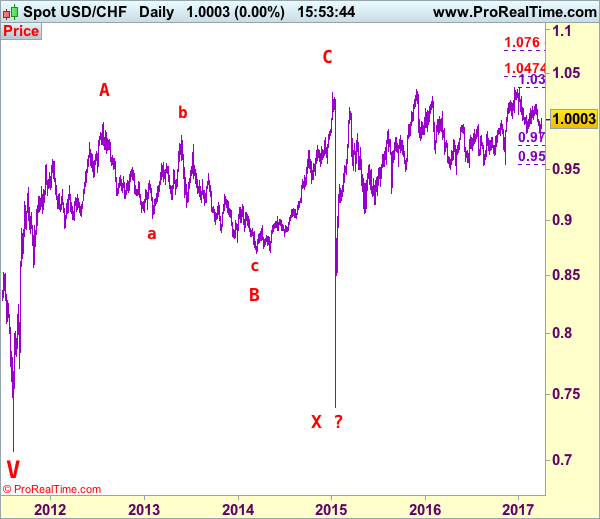
Dollar's long-term downtrend started from 2.9343 (Feb 1995) and it was unfolding as a (A)-(B)-(C) with (A): 1.1100, (B): 1.8310 (26 Oct 2000), then followed by another impulsive wave (C) with wave III ended at 0.9630 (Mar 2008). Under this count, correction in wave IV has possibly ended at 1.1730 and wave V already broke below support at 0.9630 and met indicated downside target at 0.7500 and 0.7400. The reversal from 0.7068 suggests the wave V has possibly ended and the breach of resistance at 0.9595 add credence to this view and indicated upside target at 1.0000 had been met, however, the sharp retreat from 1.0296 to 0.7401 suggests choppy trading would be seen but price should stay above said record low at 0.7068.
USD/JPY Daily Outlook
Daily Pivots: (S1) 111.26; (P) 111.60; (R1) 112.27; More....
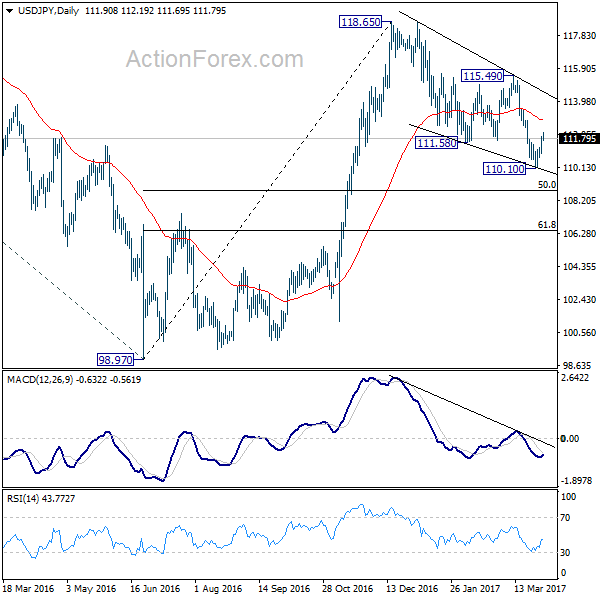
The rebound from 110.10 continues today and break of 111.57 minor resistance indicates short term bottoming, on bullish convergence condition in 4 hour MACD. Intraday bias is back on the upside for 55 day EMA (now at 112.91). Sustained break there will raise the chance of near term reversal and target 115.49 resistance for confirmation. On the downside, though, below 110.99 minor support will turn bias back to the downside for 110.10 and break will extend the corrective fall from 118.65.
In the bigger picture, price actions from 125.85 high are seen as a corrective pattern. sustained trading below 55 week EMA (now at 111.11) will indicates that such consolidation is not completed. And another fall would be seen back to 98.97 as the third leg. In that case, downside would be contained by 61.8% retracement of 75.56 to 125.95 at 94.77 to complete the correction. On the upside, above 115.49 will extend the rise from 98.97 to retest 125.85 first. Overall, up trend from 75.56 is expected to resume after the consolidation from 125.85 completes.
Risk Appetite Returned as NASDAQ Hit Record, Dollar Showed Reversal Sign
Risk appetite returned overnight with financial sector leading stocks higher. The surge in WTI crude oil through 50 handle also boosted overall sentiments. DJIA closed up 0.33% at 20728.94 and would be testing 20757.89 near term resistance today. NASDAQ has indeed closed at new record high at 5914.34, up 0.28%. But the sentiments didn't carry on in Asian session as Nikkei closed down -0.81% at 18909.26, below 19000 handle again. Dollar index is back above 100 handle and broke near term resistance at 100.48, indicating the possibility of reversal. In the currency markets, Aussie and Canadian Dollar are leading the way up for the week on risk appetite, followed by Dollar. Meanwhile, European majors are generally weak with Euro setting to close as the weakest one.
NY Fed Dudley: Appropriate to scale back monetary policy accommodation gradually
In US, New York Fed President William Dudley said that federal funds rate remains "unusually low". And, "it seems appropriate to scale back monetary policy accommodation gradually in order to reduce the risk of the economy overheating," and, "to avoid a significant inflation overshoot in the medium term." Also Dudley noted that the economic outlook abroad has "brightened" with risks "significantly lower than they were a year ago." On the other hand, Dallas Fed President Robert Kaplan continued to sound cautious. He noted that US is "finally in a situation where the consumer capacity to spend is in pretty good shape." But, he's "frankly more worried about and watching to make sure we don't enact policies or some uncertainty that might cause consumers to take a little pause." Three rate hike this year is still Kaplan's "base case".
US to unveil USD 1T infrastructure plan... later
US Transportation Secretary Elaine Chao indicated that the government would roll out USD 1T infrastructure plan later this year. Without offering further details, Chao suggested that plan would include "a strategic, targeted program of investment valued at USD 1T over 10 years. The proposal will cover more than transportation infrastructure, it will include energy, water and potentially broadband and veterans hospitals as well". But again, it should be noted that there is no detail about the plan yet. And US president Donald Trump's failure in health care act raised much doubts on his ability to push through his economic agendas. Such doubts are still remaining in investors' minds.
EC Tusk to issue Brexit negotiation guidelines
European Council President Donald Tusk will issue draft guidelines on negotiation with UK on Brexit. The guidelines are expected to set the tone for the negotiations which could last for two years. And such proposals will be sent to the governments of the 27 EU members today. It's reported that the initial phase of the negotiation will center mainly on the terms of separation. The second phase will be on future trade relationship. Meanwhile, the third phase be on the transition between the relationship.
In UK, a policy paper "the Great Repeal Bill" was published yesterday to set out the government's proposals for ensuring a functioning statute book once we have left the EU". Around 12000 EU regulations are in force in UK and around 7900 statutory instruments have implemented EU directives. There is a huge scale of tasks for legislators to work on. Brexit Secretary David Davis said that "it will mean that as we exit the EU and seek a new deep and special partnership with the European Union, we will be doing so from a position where we have the same standards and rules".
Japan data not too encouraging
In Japan, national CPI core rose 0.2% yoy in February, meeting expectations. This is also the first back to back increase in CPI since late 2015. However, it should be noted that Tokyo CPI dropped -0.4% yoy in March, worse than February's -0.3% yoy and missed expectation of -0.2% yoy. Unemployment rate dropped to 2.8% in February, lowest since 1994. Household spending dropped -3.8% yoy in February,below expectation of -1.6% yoy. Industrial production rose 2.0% mom in February, above expectation of 1.2% mom. Housing starts dropped -2.6% yoy. All in all, the set of data from Japan is not too encouraging.
Elsewhere, New Zealand building permits rose 14.0% mom in February. NBNZ business confidence dropped to 11.3 in March. China PMI manufacturing rose 0.2 to 51.8 in March while non-manufacturing PMI rose to 55.1. UK Gfk consumer sentiment was unchanged at -6 in March, nationwide house prices dropped -0.3% mom in March. Germany retail sales rose 1.8% mom in February.
A major focus today is Eurozone CPI which might miss market expectation and give Euro some pressure. UK will release GDP, current account and index of services. Canada will release GDP later in the day. US will release PCE and Chicago PMI
USD/JPY Daily Outlook
Daily Pivots: (S1) 111.26; (P) 111.60; (R1) 112.27; More....
The rebound from 110.10 continues today and break of 111.57 minor resistance indicates short term bottoming, on bullish convergence condition in 4 hour MACD. Intraday bias is back on the upside for 55 day EMA (now at 112.91). Sustained break there will raise the chance of near term reversal and target 115.49 resistance for confirmation. On the downside, though, below 110.99 minor support will turn bias back to the downside for 110.10 and break will extend the corrective fall from 118.65.
In the bigger picture, price actions from 125.85 high are seen as a corrective pattern. sustained trading below 55 week EMA (now at 111.11) will indicates that such consolidation is not completed. And another fall would be seen back to 98.97 as the third leg. In that case, downside would be contained by 61.8% retracement of 75.56 to 125.95 at 94.77 to complete the correction. On the upside, above 115.49 will extend the rise from 98.97 to retest 125.85 first. Overall, up trend from 75.56 is expected to resume after the consolidation from 125.85 completes.
Economic Indicators Update
| GMT | Ccy | Events | Actual | Forecast | Previous | Revised |
|---|---|---|---|---|---|---|
| 21:45 | NZD | Building Permits M/M Feb | 14.00% | 0.80% | 201% | |
| 23:01 | GBP | GfK Consumer Confidence Survey Mar | -6 | -7 | -6 | |
| 23:30 | JPY | Unemployment Rate Feb | 2.80% | 3.00% | 3.00% | |
| 23:30 | JPY | Household Spending Y/Y Feb | -3.80% | -1.60% | -1.20% | |
| 23:30 | JPY | National CPI Core Y/Y Feb | 0.20% | 0.20% | 0.10% | |
| 23:30 | JPY | Tokyo CPI Core Y/Y Mar | -0.40% | -0.20% | -0.30% | |
| 23:50 | JPY | Industrial Production M/M Feb P | 2.00% | 1.20% | -0.40% | |
| 0:00 | NZD | NBNZ Business Confidence Mar | 11.3 | 16.6 | ||
| 1:00 | CNY | Manufacturing PMI Mar | 51.8 | 51.7 | 51.6 | |
| 1:00 | CNY | Non-manufacturing PMI Mar | 55.1 | 54.2 | ||
| 5:00 | JPY | Housing Starts Y/Y Feb | -2.60% | -1.20% | 12.80% | |
| 6:00 | EUR | German Retail Sales M/M Feb | 1.80% | 0.70% | -0.80% | |
| 6:00 | GBP | Nationwide House Prices M/M Mar | -0.30% | 0.30% | 0.60% | |
| 7:55 | EUR | German Unemployment Change Mar | -10k | -14k | ||
| 7:55 | EUR | German Unemployment Rate Mar | 5.90% | 5.90% | ||
| 8:30 | GBP | Current Account (GBP) Q4 | -16.0b | -25.5b | ||
| 8:30 | GBP | GDP Q/Q Q4 F | 0.70% | 0.70% | ||
| 8:30 | GBP | Index of Services 3M/3M Jan | 0.70% | 0.80% | ||
| 8:30 | GBP | Total Business Investment Q/Q Q4 F | -1.00% | -1.00% | ||
| 9:00 | EUR | Eurozone CPI Estimate Y/Y Mar | 1.80% | 2.00% | ||
| 9:00 | EUR | Eurozone CPI - Core Y/Y Mar A | 0.80% | 0.90% | ||
| 12:30 | CAD | GDP M/M Jan | 0.30% | 0.30% | ||
| 12:30 | USD | Personal Income Feb | 0.40% | 0.40% | ||
| 12:30 | USD | Personal Spending Feb | 0.20% | 0.20% | ||
| 12:30 | USD | PCE Deflator M/M Feb | 0.10% | 0.40% | ||
| 12:30 | USD | PCE Deflator Y/Y Feb | 2.10% | 1.90% | ||
| 12:30 | USD | PCE Core M/M Feb | 0.20% | 0.30% | ||
| 12:30 | USD | PCE Core Y/Y Feb | 1.70% | 1.70% | ||
| 13:45 | USD | Chicago PMI Mar | 57 | 57.4 | ||
| 14:00 | USD | U. of Michigan Confidence Mar F | 97.6 | 97.6 |
Trade Idea: EUR/JPY – Sell at 120.40
EUR/JPY - 119.55
Recent wave: wave v of (C) ended at 94.12 and major correction in wave A has ended at 149.79
Trend: Near term up
Original strategy:
Sell at 120.40, Target: 118.40, Stop: 121.00
Position: -
Target: -
Stop: -
New strategy :
Sell at 120.40, Target: 118.40, Stop: 121.00
Position: -
Target: -
Stop:-
As the single currency has recovered after holding above support at 119.01 (this week’s low), suggesting consolidation above this level would be seen and corrective bounce to 120.00 cannot be ruled out, however, reckon resistance at 120.44 would limit upside and bring another decline later, below said support would add credence to our view that the decline from 122.89 top is still in progress and may extend weakness towards support at 118.67, however, break there is needed to retain bearishness and extend further fall to previous chart support at 118.25, risk from there is seen for a rebound later.
In view of this, would not chase this fall here and would be prudent to sell euro on subsequent rebound as resistance at 120.44 should cap upside and bring another decline. Above 1121.00 would abort and suggest low is possibly formed, risk rebound to 121.50 but resistance at 121.84 should hold from here, bring another decline later.
Our latest preferred count is that wave (ii) is ABC-X-ABC which ended at 123.33 and wave (iii) is unfolding with wave iii ended at 100.77, followed by wave iv at 111.57 and wave v as well as the wave (iii) has ended at 97.04, followed by wave (iv) at 111.43 and wave (v) has ended at 94.12 which is also the end of the larger degree v, this also implied the major wave (C) has also ended there, hence major correction has commenced from there with (A) leg unfolding in its lower degree wave c which has possibly ended at 145.69. Under this count, A-B-C wave (B) has commenced with A leg ended at 136.23, wave B at 143.79 and wave C has possibly ended at 149.79.
Our larger degree count is that the decline from 139.26 is wave (C) and is sub-divided into a diagonal triangle i-ii-iii-iv-v with wave i - 105.44, wave ii- 123.33, wave iii - 97.03, wave iv - 111.43, followed by the final wave v as well as the end of wave (C) at 94.12, this also mark the bottom of larger degree wave B. Under this count, major rise in wave C has commenced as an impulsive wave with minor wave III ended at 145.69, wave V is still in progress for further gain to 150.00. Having said that, this so-called wave V could well be the first leg of larger degree 5-waver wave C and this wave C should bring at least a retest of wave A top at 169.97 (July 2008).