Sample Category Title
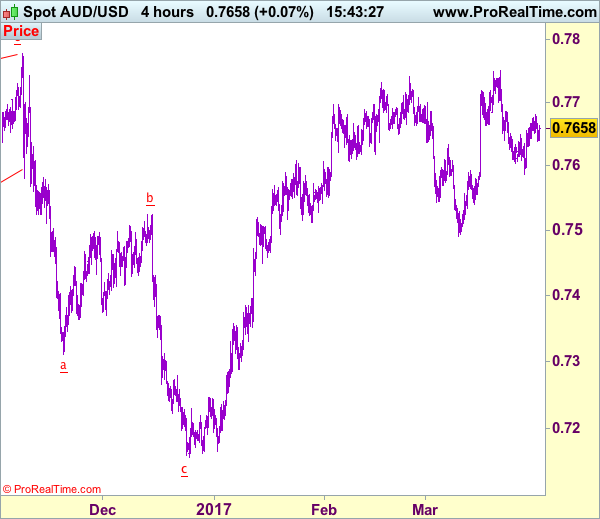
Trade Idea: AUD/USD – Hold long entered at 0.7645
AUD/USD – 0.7657
Recent wave: Wave 5 ended at 1.1081 and major correction has commenced for fall to 0.7000 and then towards 0.6500-10
Trend: Near term up
Original strategy :
Bought at 0.7645, Target: 0.7800, Stop: 0.7605
Position: - Long at 0.7645
Target: - 0.7800
Stop: - 0.7605
New strategy :
Hold long entered at 0.7645, Target: 0.7800, Stop: 0.7605
Position: - Long at 0.7645
Target: - 0.7800
Stop:- 0.7605
Although aussie has eased after meeting resistance at 0.7680 and consolidation below this level would be seen, reckon downside would be limited to 0.7630 and bring another rise later, above indicated resistance at 0.7680-85 would signal low is formed there and suggest the retreat from 0.7750 (last week’s high) has ended, then retest of this level would follow, above this resistance would extend gain to 0.7778 (last year’s high), however, break there is needed to retain bullishness and extend headway to 0.7840-50 but price should falter below 0.7900.
In view of this, we are holding on to our long position entered at 0.7645. Only below 0.7585 would abort and signal top is formed instead, then further choppy trading would take place and risk is seen for pullback to 0.7530-40 but indicated support at 0.7491 should remain intact.
On the 4-hour chart, the move from 0.8066 is the wave 5 with i: 0.8860, ii: 0.8315, wave iii is an extended move ended at 1.0183, iv: 0.9706 and wave v has ended at 1.1081 (also the top of entire wave 5). The subsequent selloff is the major correction which is unfolding as ABC-X-ABC and 2nd A leg has ended at 0.8848, followed by a-b-c wave B which ended at 0.9758, hence, 2nd C wave is now in progress and indicated downside target at 0.7000 and 0.6950 had been met, so further fall to 0.6710-20 cannot be ruled out.
Foreign Exchange Market Commentary
EUR/USD
The common currency was the worst performer against the greenback, undermined by soft local data and diminished hopes of an end of ECB's monetary stimulus. The EUR/USD continued retreating and closed the day at 1.0685, its lowest settlement since mid March. The EU Economic Sentiment indicator showed that confidence suffered a setback this month, as it came in at 107.9, below previous 108.00, and also missing expectations. Among business, sentiment also eased although consumer confidence remained flat at -5. Preliminary German's inflation EU harmonized, was of 0.1% for the same month, well below previous 0.7% or the 0.6% expected, leaving the year-on-year figure at 1.5%, sharply below previous 2.2% and somehow, supporting ECB's policymakers conviction that massive stimulus should remain in place as higher inflation seen during the past few months was driven by energy and food prices, and hence unsustainable.
In the US, the final revision of US Q4 GDP came in at 2.1% from previous estimate of 2.0%, which helped Wall Street to rebound. Weekly unemployment claims disappointed, reaching 258K in the week ending March 24th, against the 240K expected, although the figure is at multi-decade lows, hardly suggesting the US employment sector is losing momentum.
From a technical point of view, the EUR/USD pair has broken below a critical support, the 1.0700 region, where it has the 38.2% retracement of the late 2016 monthly decline, and looks poised to extend its slide towards given that in the 4 hours chart, the price is also developing far below a bearish 20 SMA and the 100 SMA, whilst technical indicators now head south near oversold readings. Approaches to the 1.0730 region should now attract selling interest, although a recovery above the level should deny the possibility of further declines.
Support levels: 1.0660 1.0620 1.0590
Resistance levels: 1.0730 1.0780 1.0820
USD/JPY
The USD/JPY pair ends Thursday modestly higher, although the pair has remained confined to a roughly 50 for the day, holding on the upper end of Wednesday's range. A tepid upward revision to US Q4 GDP was not enough to boost the pair, also subdued by the poor performance of worldwide equities. The pair advanced in the US afternoon alongside with Wall Street and a modest gain in US Treasury yields. Japan has quite a busy calendar as early Asia, it will release unemployment, industrial, and inflation data, which will likely set the mood for all of the upcoming session. The pair presents a bullish intraday stance, as in the 4 hours chart, technical indicators have resumed their advances within positive territory and stand at their highest in two weeks, although in the same chart, the 100 SMA maintains its bearish slope well above the current level, whilst selling interest contains advances around former yearly lows in the 111.60 region. Unless the pair is able to recover clearly above this last, the risk will remain towards the downside, with a break below 111.00 required to confirm additional declines.
Support levels: 110.95 110.50 110.10
Resistance levels: 111.60 112.00 112.50
GBP/USD
The GBP/USD pair surged to a daily high of 1.2523 early in the American afternoon, to end the day marginally higher around 1.2470. There was no certain catalyst behind Pound's recovery, although Footsie's weakness may have helped the UK currency. There were no major economic releases in the UK, with market players focused on the Brexit or better said, in EU's response to the Brexit. Ever since the formal trigger, the EU has gained the power over the matter, with members determinate to remain together and show unity, making things tough for the UK. German Angela Merkel, insisted that upcoming exit negotiations cannot run in parallel with talks on the future UK-EU relationship. “The negotiations must first clarify how we will disentangle our interlinked relationship,” said the German chancellor, remarking also that once that is out of the table, they could begin discussing future relationship. In the 4 hours chart, the pair remained below a bearish 20 SMA, with a spike beyond it being quickly reverted, while technical indicators have turned lower around their mid-lines, indicating that buying interest receded ahead of Wall Street's close. The downward potential, however, remains limited, with only a break below the 1.2330/40 region signaling a steeper decline ahead.
Support levels: 1.2445 1.2400 1.2365
Resistance levels: 1.2490 1.2520 1.2560
GOLD
Gold come under strong selling interest in the American afternoon, ending the day not far from its daily low at $1,245.00 a troy ounce, as safe-related assets were affected by a recovery in US equities. The commodity was under pressure ever since the day started, weighed by weak demand in India, later hit by growing demand for the US currency. The bright metal is at its lowest in a week, but the retracement remains corrective according to the daily chart, giving that the price is resting above its 200 DMA, still not able to break below it, whilst technical indicators are barely pulling back from overbought territory. March 24th intraday low at 1,243.59 is the level to break now to confirm further declines this Friday towards 1,230.00 a major Fibonacci support. In the shorter term, the 4 hours chart shows that the price is developing below a bearish 20 SMA, whilst technical indicators have extended their declines within negative territory, heading into the Asian session with a strong bearish momentum that supports a downward extension towards the mentioned Fibonacci level.
Support levels: 1.243.60 0 1,230.00 1,222.70
Resistance levels: 1,251.45 1,263.80 1,272.80
WTI CRUDE
Oil prices extended their recovery this Thursday, with West Texas Intermediate crude futures settling at $50.33 a barrel, its highest in over three weeks, as different news from the sector backed the commodity. In Libya, oil production disruption has led the country to produce around 560,000 barrels a day, well below the 700,000 pledged. Also, Kuwait oil minister Essam al-Marzouq said his country was among several OPEC and non-OPEC nations supporting the extension of a deal to limit output. Finally, the EIA reported that natural gas storage fell by more-than-expected last week, as gas storage fell by 43 billion cubic feet in the week ending March 24th. The daily chart for WTI shows that the price surpassed the 200 SMA while technical indicators head north within positive territory, maintaining the downside risk limited. In the 4 hours chart, technical indicators have turned flat within overbought territory, whist the 20 SMA accelerated its advance below the current level, now breaking above a bearish 100 SMA, also favoring additional gains for the upcoming sessions, although limited.
Support levels: 49.70 49.00 48.30
Resistance levels: 50.70 51.25 51.90
DJIA
Wall Street closed with gains, although US major indexes retreated from their daily highs in the last hours of trading. The Dow Jones Industrial Average advanced 69 points to settle at 20,728.52, while the Nasdaq Composite gained 0.28% or 16 points, to 5,914.34 a new record high. The S&P added roughly 7 points to 2,368.06, backed by a strong recovery in oil prices and a firmer sentiment towards the greenback after an upward revision to local GDP. Within the Dow, Exxon Mobil was the best performer, up 1.84%, followed by American Express up 1.27% and Goldman Sachs that added 1.23%. Nike was the worst performer by losing 1.13%, followed by Procter & Gamble that shed 0.41%. As for the technical picture, the DJIA daily chart shows that the Dow still develops below a bearish 20 DMA, currently providing a dynamic resistance at 20,783, whilst technical indicators have extended their recovery within negative territory, indicating that a limited upward potential at the time being. In the 4 hours chart, the index bounced sharply from a now bullish 20 SMA, but technical indicators lost upward momentum within positive territory, whilst the index remains below its 100 and 200 SMAs, both converging around 20,790, in line with the longer term perspective.
Support levels: 20,677 20,623 20,562
Resistance levels: 20,783 20,830 20,881
FTSE 100
The FTSE was unable to extend its advance and closed 4 points lower at 7,369.52, undermined by the poor performance of Asian equities, and with speculative interest cautious after the formal beginning of the Brexit process. Mining-related equities were among the top performers, with Antofagasta leading the way higher by adding 2.94%, followed by Ashtead Group that advanced 2.44% on a revision of its rating to buy. Mediclinic International was the worst performer, down 3.00% followed by Associated British Food that lost 2.04%. The index stands around the mentioned close ahead of the Asian opening, and the daily chart shows that its standing around its 20 SMA that lost its upward strength, whilst technical indicators turned modestly lower within neutral territory, not enough to confirm additional slides. In the 4 hours chart, the index remains above horizontals 20 and 100 SMAs whilst technical indicators have turned horizontal within positive territory, offering a neutral stance.
Support levels: 7,355 7,332 7,301
Resistance levels: 7,387 7,415 7,448
DAX
European equities closed again with gains, with the German DAX adding 53 points on the day to settle at 12,256.43, a fresh almost two-year high. Mining and industrial stocks led the way higher in the region, although within the DAX, Deutsche Boerse, an exchange operator, was the best performer, up 2.29%, followed by Continental, which added 1.72%. Only 8 members closed down, with Commerzbank topping losers' list with a 1.34% decline. The daily chart for the German benchmark shows that it keeps posting higher high and higher lows, above bullish moving averages, whilst the limited intraday range barely helped technical indicators to advance within positive territory, overall bullish. In the shorter term and according to the 4 hours chart, technical indicators have lost upward momentum within overbought territory, still far from suggesting upward exhaustion, whilst the 20 SMA heads sharply higher well below the current level, supporting additional advances, particularly on an upward acceleration above the intraday high of 12,261, the immediate resistance.
Support levels: 12,221 12,180 12,139
Resistance levels: 12,261 12,318 12,365
EUR/JPY Candlesticks and Ichimoku Analysis
Weekly
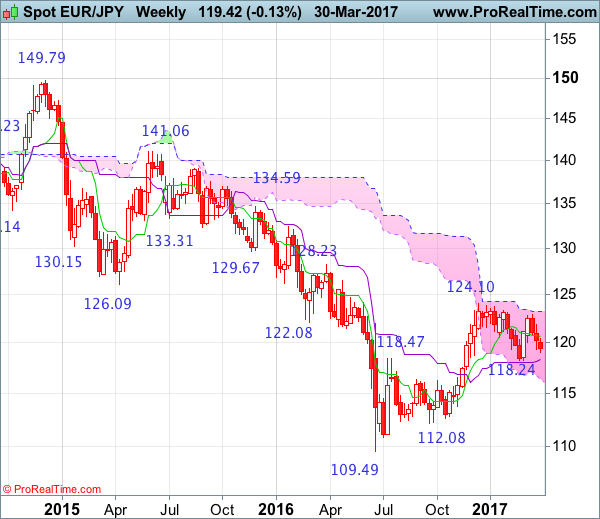
• Last Candlesticks pattern: Hammer
• Time of formation: 19 Sep 2016
• Trend bias: Down
Daily
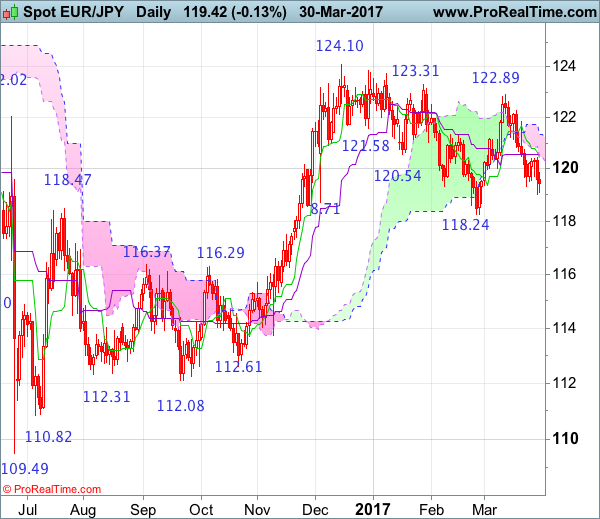
• Last Candlesticks pattern: Doji
• Time of formation: 28 Mar 2017
• Trend bias: Near term up
EUR/JPY – 119.54
As the single currency faltered just below the Kijun-Sen (now at 120.57) and slipped from 10.44 this week, suggesting the fall from 122.89 is still in progress and downside risk remains for the fall from there to extend weakness to 118.90-00, then 118.65-70, however, a daily close below latter level is needed to retain bearishness and bring retest of 118.24 support. Once this level is penetrated, this would signal the break of the erratic decline from 124.10 top has resumed and bring subsequent fall to 117.90-00, then towards 117.40-50 which is likely to hold from here due to oversold condition, bring rebound later.
On the upside, whilst initial recovery to 119.80-85 cannot be ruled out, reckon upside would be limited to the Kijun-Sen (now at 120.57) and bring another decline later. A daily close above 120.85 would defer and risk rebound to the upper Kumo (now at 121.35) but only break of resistance at 121.84 would revive bullishness and signal the fall from 122.89 has ended instead, bring further gain to 122.50, then retest of said resistance at 122.89. Looking ahead, a break there is needed to signal the rise from 118.24 low has resumed and extend further gain to resistance at 123.31, a daily close above this level would suggest the entire fall from 124.10 top has ended at 118.24 back in Feb and bring further subsequent headway towards this level.
Recommendation: Sell at 120.40 for 118.40 with stop above 121.40.
On the weekly chart, euro’s retreat from 122.89 has kept price under near term pressure, adding credence to our view that the rebound from 118.24 has ended there and downside risk remains for weakness to 119.00, then 118.65-70 but said support at 118.24 should remain intact, bring further choppy trading. In the event euro drops below 118.24 level, this would signal the retreat from 124.10 top is still in progress and near term downside bias remains for this move to bring retracement of recent upmove, hence weakness to the Kijun-Sen (now at 118.09) is likely but a weekly close below there is needed to signal the rise from 109.49 has ended, bring further decline to 117.30-35, however, previous resistance at 116.29 should contain downside due to near term oversold condition, bring rebound later.
On the upside, expect recovery to be limited to 120.00-10 and the Tenkan-Sen (now at 120.70) should hold from here, bring another decline later. Only above said resistance at 121.84 would suggest the pullback from 122.89 has ended instead, bring another test of this level, break there would signal the rebound from 118.24 is still in progress and may extend gain to indicated key resistance at 123.31. Looking ahead, a break above this level is needed to retain bullishness and signal recent rise from 109.49 low has resumed for retracement of early decline to 125.25-30 (50% Fibonacci retracement of 141.06-109.49), having said that, reckon resistance at 126.47 would cap upside and price should falter below resistance at 128.23, bring retreat later.
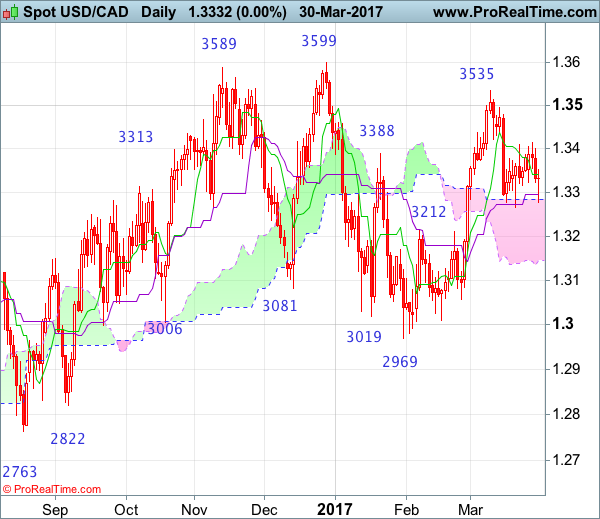
USD/CAD Candlesticks and Ichimoku Analysis
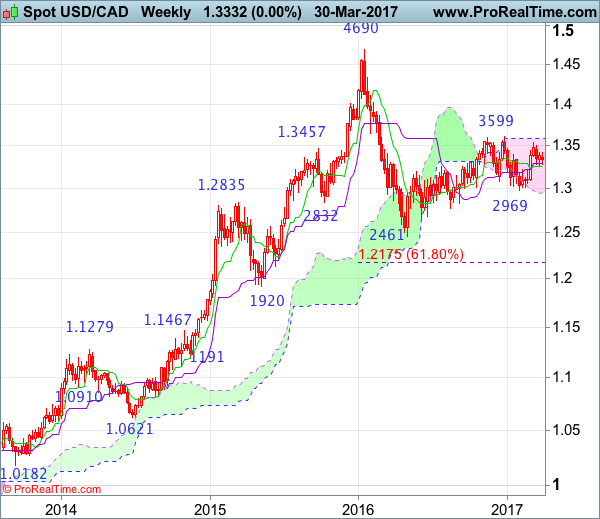
Weekly
• Last Candlesticks pattern: Bullish engulfing
• Time of formation: 02 May 2016
• Trend bias: Up
Daily
• Last Candlesticks pattern: Hammer
• Time of formation: 19 Oct 2016
• Trend bias: Up
USD/CAD – 1.3281
Although the greenback rose briefly to 1.3415 earlier this week, as renewed selling interest emerged there and the pair has retreated sharply, suggesting the rebound from 1.3264 has ended there and downside bias is seen for the fall from 1.3535 to extend further weakness to 1.3230, however, reckon downside would be limited to 1.3200-10. Looking ahead, a daily close below there would retain bearishness for the aforesaid decline to extend weakness to 1.3160-65 and possibly towards 1.3100 but price should stay well above support at 1.3056, bring rebound later. Only a daily close below this level would retain bearishness and signal the rebound from 1.2969 has indeed ended, bring further fall to 1.3000 first, however, said support at 1.2969 should remain intact.
On the upside, whilst recovery to the Tenkan-Sen (now at 1.3340) cannot be ruled out, reckon upside would be limited to 1.3380-85 and bring another decline later. Above 1.3380-85 would risk test of said resistance at 1.3415 but only break there would revive bullishness and signal low has been formed, bring another rise later. A daily close above 1.3415 resistance would suggest the pullback from 1.3535 top has ended and bring further gain to 1.3490-00 but said resistance at 1.3535 would hold on first testing. Looking ahead, only a break of this level would retain bullishness and extend early erratic upmove from 1.2461 low to 1.3599, then 1.3660-70 but still reckon upside would be limited to 1.3700 and risk from there is seen for a retreat later.
Recommendation: Sell at 1.3375 for 1.3175 with stop below 1.3435.
On the weekly chart, as the greenback met resistance at 1.3415 and has retreated, retaining our view that further consolidation below resistance at 1.3535 would be seen and test of the Tenkan-Sen (now at 1.3252) is likely, however, break of previous resistance at 1.3210 is needed to suggest a temporary top is formed, bring further fall to 1.3150-60, break there would add credence to this view and signal the rebound from 1.2969 has ended, bring subsequent decline towards 1.3083, however, indicated support at 1.3056 should hold from here, risk from there has increased for a rebound later.
On the upside, expect recovery to be limited to 1.3340-50 and bring another decline. Above said resistance at 1.3415 would bring test of 1.3495 resistance but break of latter level is needed to signal the pullback from 1.3535 has ended, bring retest of this level first, break there would extend recent rise from 1.2969 to indicated resistance at 1.3599, however, a break of this resistance is needed to retain bullishness and signal upmove from 1.2461 (2016 low) has resumed for headway to 1.3700 and later towards 1.3835-40 (61.8% Fibonacci retracement of 1.4690-1.2461) which is likely to cap upside.
Asian Market Update: China Official PMIs Strike Multi-Month Highs
China official PMIs strike multi-month highs
Asia Mid-Session Market Update: China official PMIs strike multi-month highs; Japan jobless rate at 23-year lows
US Session Highlights
(US) INITIAL JOBLESS CLAIMS: 258K V 247KE; CONTINUING CLAIMS: 2.05M V 2.03ME
(US) Q4 FINAL GDP PRICE INDEX: 2.1% V 2.0%E; CORE PCE Q/Q: 1.3% V 1.2%E
(US) Q4 FINAL GDP ANNUALIZED Q/Q: 2.1% V 2.0%E; PERSONAL CONSUMPTION: 3.5% V 3.0%E
(US) Fed’s Mester (hawkish, non-voter): reiterates support for starting to trim bond portfolio this year; supports further rate hikes but not at each meeting
(US) Trump administration draft letter seeks changes to NAFTA, but not scrapping deal altogether - Washington Post
(US) WEEKLY EIA NATURAL GAS INVENTORIES: -43 BCF VS. -41 TO -43 BCF EXPECTED RANGE
US markets on close: Dow +0.3%, S&P500 +0.3%, Nasdaq +0.3%
Best Sector in S&P500: Financials
Worst Sector in S&P500: Utilities
Biggest gainers: COP +8.8%, FTR +5.5%, FCX +4.6%, STX +3.2%, COF +2.9%
Biggest losers: AKAM -4.6%, CF -3.9%, CBT -3.7%, VF -3.7%, PRGO -3.1%
At the close: VIX 11.5 (+0.1 pts); Treasuries: 2-yr 1.29% (+1bps), 10-yr 2.42% (+3bps), 30-yr 3.03% (+3bps)
US movers afterhours
VJET: Reports Q4 net -€3.0M v -€2.4M y/y, Rev €6.3M v €8.3M y/y; Guides Q1 Rev €4.25-4.75M v €4.9M y/y; +3.9% afterhours
EGLE: Reports Q4 -$2.96 v -$42.37 y/y, R$41.9M v $25.7M y/y; +2.9% afterhours
NH: Reports Q4 -$0.18 v -$0.18e, R$24.1M v $29.5Me; +1.2% afterhours
Politics
(ZA) South Africa Pres Zuma fires Gordhan appoints Malusi Gigaba as new Fin Min
(US) White House advisor Navarro: Pres Trump to sign Executive Order on Friday to strengthen collections of anti-dumping and anti-subsidy duties on imports - press
(US) Former National Security Advisor Mike Flynn makes an offer to FBI and Congressional investigators to testify in exchange for immunity from prosecution - press
(US) US Pres Trump: Meeting with China to be a difficult one amid concerns over trade deficits and jobs; appealing Hawaii judge ruling who blocked his Executive Order travel ban - press
(US) Commerce Sec Ross: hopes to trigger 90-day NAFTA consultation period before spring congressional recess; NAFTA negotiations could start in August - CNBC
Asia Key economic data:
(CN) CHINA MAR MANUFACTURING PMI (GOVT OFFICIAL): 51.8 (highest since Apr 2012) V 51.7E; NON-MANUFACTURING PMI: 55.1 (highest since May 2014) V 54.2 PRIOR
(JP) JAPAN MAR TOKYO CPI Y/Y: -0.4% (biggest decline in 6 months) V -0.2%E; CPI EX-FRESH FOOD Y/Y: -0.4% (biggest decline in 3 months) V -0.2%E
(JP) JAPAN FEB NATIONAL CPI Y/Y: 0.3% (5th consecutive increase) V 0.2%E; CPI EX FRESH FOOD (CORE) Y/Y: 0.2% (22-month high) V 0.2%E
(JP) JAPAN FEB OVERALL HOUSEHOLD SPENDING Y/Y: -3.8% V -1.7%E; 12th consecutive decline, biggest decline in 6 months
(JP) JAPAN FEB PRELIMINARY INDUSTRIAL PRODUCTION M/M: 2.0% V 1.2%E; Y/Y: 4.8% V 3.9%E
(JP) JAPAN FEB JOBLESS RATE: 2.8% V 3.0%E; lowest since June 1994
(NZ) NEW ZEALAND MAR ANZ ACTIVITY OUTLOOK: 38.8 V 37.2 PRIOR; BUSINESS CONFIDENCE: 11.3 V 16.6 PRIOR
(NZ) NEW ZEALAND FEB BUILDING PERMITS M/M: +14.0% V +2.1% PRIOR (8-month high)
(NZ) NEW ZEALAND Q1 WESTPAC EMPLOYMENT CONFIDENCE INDEX: 109.9 v 112.7 PRIOR
(KR) SOUTH KOREA FEB INDUSTRIAL PRODUCTION M/M: -3.4% V -0.3%E; Y/Y: 6.6% V 7.2%E
Asia Session Notable Observations, Speakers and Press
Asian indices are mixed following modest gains on Wall St, where rising interest rates and more gains in the oil patch sent Financials and Energy sectors higher. Nikkei225 is among the leaders, helped by weaker Yen, while Shanghai Composite has backed away from 2-week lows in the wake of multi-month highs in China manufacturing and non-manufacturing PMIs.
In FX, USD/JPY pair was the most volatile among the dollar majors, rising to 1-week high above 112, as USD remained bid in US hours on higher US interest rates. In EM currencies, South African Rand fell over 2% through 13.60 late in Asia after Pres Zuma sacked the corruption-crusading Fin Min Gordhan, appointing Minister of Home Affairs Malusi Gigaba as his replacement. Focus will now fall on ratings agencies review of South Africa as it deals with its economic and political turmoil.
In notable political news stateside, WSJ reported that former National Security Advisor Mike Flynn has reached out to FBI and Congressional investigators to testify in exchange for immunity from prosecution, though follow-up statement from his counsel did not suggest that he has incriminating information but rather wants protection given "a highly politicized, witch-hunt environment."
PBoC has skipped open market operations for the full week now, claiming liquidity in the system is ample. There was also some tough talk from US President Trump ahead of his meeting with China leaders next week, expecting the summit to be "difficult in that we can no longer have massive trade deficit and job losses." China foreign ministry official response was that China will push for greater balance in trade. Separately, White House Advisor Navarro said Trump will sign an Executive Order on Friday to strengthen collections of anti-dumping and anti-subsidy duties on imports
Economic data out of China and Japan were mostly positive. China official manufacturing PMI hit a 5-year high while non-manufacturing was a near 2-year high. Employment component of manuf PMI marked a notable bounce into expansion, even as input prices declined. In Japan, unemployment rate fell to a 23-year low, though labor force participation rate declind to 59.6% from 60.0% while total number of employed persons fell for 81 straight month. Japan National CPI was slightly hotter than expected on the headline, though the forward looking Tokyo region inflation fell deeper in the red.
China
(CN) China vice foreign minister Zheng Zeguang : Trade and business relation with US good for both countries and win-win; Will push for greater balance in trade
(CN) US Pres Trump: Meeting with China to be a difficult one amid concerns over trade deficits and jobs - press
(CN) BoCom: China Mar CPI seen at 0.8% y/y, unchanged from 0.8% in Feb - Chinese press
Japan
(JP) Japan ruling LDP security research commission recommends to PM Abe that Japan obtains capability of striking enemy bases - Nikkei
(JP) Japan Fin Min Aso: Private banks have money but not willing to lend; North Korea situation more serious than portrayed in the press
Australia/New Zealand
(AU) According to one survey, analysts are unanimous in expectation for RBA to leave rates on hold next week - press
Asian Equity Indices/Futures (00:30ET)
Nikkei +0.5%, Hang Seng -0.5%, Shanghai Composite +0.3%, ASX200 -0.2%, Kospi flat
Equity Futures: S&P500 -0.1%; Nasdaq -0.1%; Dax -0.1%; FTSE100 -0.2%
FX ranges/Commodities/Fixed Income (00:30ET)
EUR 1.0670-1.0690; JPY 111.70-112.20; AUD 0.7640-0.7660; NZD 0.6980-0.7005
June Gold -0.4% at $1,244/oz; May Crude Oil -0.3% at $50.20/brl; May Copper flat at $2.67/lb
SPDR Gold Trust ETF daily holdings fall 1.2 tonnes to 832.3 tonnes
(CN) PBOC SETS YUAN MID POINT AT 6.8993 V 6.8889 PRIOR
(CN) PBoC skips open market operations for 6th straight session; Said to drain CNY30B v CNY40B prior
(AU) Australia MoF (AOFM) sells A$600M in 5.75% 2021 Bonds; avg yield: 2.077%; bid-to-cover: 6.89x
Asia equities / Notables / movers by sector
Consumer discretionary: 670.HK China Eastern Airlines +0.7%, 1055.HK China Southern Airlines +2.5% (FY16 result); 1886.HK China Huiyuan Juice Group -1.6% (FY16 results); FXJ.AU Fairfax -3.6% (potential LBO difficult to justify)
Consumer staples: 168.HK Tsingtao Brewery Co -1.3% (FY16 results); 3349.JP Cosmos Pharmaceutical Corp +2.1% (Mizuho initiates with buy)
Financials: 6881.HK China Galaxy Securities +1.0%, 6818.HK China Everbright Bank -2.1%, 1398.HK ICBC -0.4%, 6886.HK Huatai Securities -0.7% (FY16 results); BOQ.AU Bank of Queensland +1.7% (JPMorgan raises rating)
Industrials:7 53.HK Air China -1.0% (FY16 results); 390.HK China Railway Group -5.7%, 1157.HK Zoomlion Heavy Industry Science and Technology -4.9% (FY16 results); 7951.JPYamaha Corp +2.8% (Daiwa initiates with outperform)
Technology: 1296.HK Guodian Technology & Environment Group +3.8% (FY16 results); NXT.AU Nextdc +3.7% (new buy at Canaccord); 6502.JP Toshiba Corporation +5.9% (Apple may be among bidders for chip unit)
Materials: 3993.HK China Molybdenum +8.7% (FY16 results)
Energy: 857.HK PetroChina Co -1.2% (FY16 results)
EUR/USD Nosedives On Soft EMU Inflation While Dollar Rebounds
Sunrise Market Commentary
- Rates: Bunds outperforming US Treasuries on mixed inflation readings?
Influential NY Fed governor Dudley said overnight that the outlook for fiscal stimulus shifts risks to growth, inflation, and the speed of the Fed's tightening cycle to the upside. Today's inflation data are expected to show a significant drop in EMU, while rising above the Fed's 2% target in the US. That should cause outperformance of the Bund vs. US Treauries. - Currencies: EUR/USD nosedives on soft EMU inflation while dollar rebounds
The euro's decline accelerated yesterday on very soft German inflation data. At the same time the dollar was supported by hawkish Fed comments and a rising interest rate support. Today, a soft EMU CPI shouldn't come as a surprise, but won't help the euro. US data might remain mildly USD supportive. Sterling is still captured in a short-squeeze post Brexit
The Sunrise Headlines
- US stock markets extended this week's comeback and closed around 0.3% higher. Overnight, most Asian stock markets lose some ground with Japan and China outperforming (+0.4%)
- Prospects for the US economy have brightened now that fiscal stimulus from Washington appears more likely, so the Fed will need to keep raising rates and eventually trim its bond portfolio to avoid an overheating, NY Fed Dudley said.
- China's official manufacturing PMI climbed to the highest in almost 5 years (51.8 from 51.6), the latest evidence of increasing momentum in the world's 2nd largest economy. The non-manufacturing PMI increased from 54.2 to 55.1.
- Some mixed readings on inflation and a drop in household spending in Japan have taken some of the shine off solid industrial production and unemployment numbers this morning.
- Venezuela's supreme court, which is controlled by President Maduro's socialist government, has ruled it is taking over the opposition-dominated National Assembly, sparking fears that the crisis-riven country has moved towards full-blown dictatorship.
- South Africa's President Zuma fired FM Gordhan and replaced him with Home Affairs Minister Gigaba, a person familiar said, extending the rand's decline. USD/ZAR trades around 13.5, from 12.5 at the start of the week.
- Today's eco calendar contains EMU (CPI) and US (PCE) inflation and some second tier data (US personal income/spending, Chicago PMI, final Michigan consumer confidence). More ECB/Fed members speak.
Currencies: EUR/USD Nosedives On Soft EMU Inflation While Dollar Rebounds
EUR/USD hammered on USD rebound and soft euro The euro remained in the defensive yesterday. Market rumours of the ECB being unhappy with the recent hawkish market reaction continued to weigh. They were reinforced by a sharp decline in German and Spanish inflation. EUR/USD finally even dropped below the 1.07 big figure as the dollar gained momentum later in the session. EUR/USD finished the session at 1.0674 (from 1.0766 on Wednesday). The rise of USD/JPY was initially modest, but accelerated later, supported by higher US yields. The pair finished the day at 111.92 (from 111.04).
Overnight, Asian equities are trading mixed with Japan and China outperforming. Japanese eco data were mixed with the headline February CPI slightly higher than expected at 0.3% Y/Y. As usual the data had hardly any impact on yen-trading. USD/JPY tries to regain the 112 barrier as the dollar remains well bid. The US currency is further supported by hawkish comments Fed's Dudley yesterday evening. China PMI data were strong (manufacturing PMI 51.8; nonmanufacturing PMI 55.1). EUR/USD hovers near yesterday's lows (1.0675 area).
Today, the EMU CPI flash estimate and the German labour market data will be published. In the US, PCE deflators, personal spending and income data, Chicago PMI and final Michigan consumer confidence are scheduled for release. The consensus for the EMU CPI still stands at 1.8% for the headline and 0.8% for the core. A very soft figure should already be discounted after yesterday's low readings in Germany and Spain. Even so, a sharp decline of the EMU inflation data shouldn't help the euro. In the US we keep an eye at the PCE deflators (headline expected at 2.1% Y/Y, core at 1.7%). A rise north of 2.0% might cause more talk on the Fed meeting its targets. The Chicago PMI is expected slightly softer at 56.9, but should remain at a reasonable high level. Sentiment on the dollar improved earlier this week as the US reflation trade regained momentum after a very strong US consumer confidence. US Fed speakers also confirmed that further policy normalization is to be expected throughout 2017. At the same time, the euro faced headwinds as market rumours questioned the scenario of early ECB policy normalization. The move was reinforced by very soft EMU inflation data. Part of this repositioning should be discounted now. Even so, some underperformance of Treasuries versus Bunds is still likely, widening the interest rate differential in favour of the dollar. A cautious EUR/USD sell-on-upticks approach can be reconsidered. The day-to-day momentum of USD/JPY also improved. However, further gains might be capped if the equity rebound would slow. We stay cautious on the USD/JPY upside potential
From a technical point of view, USD/JPY regained the 111.36/60 previous range bottom. This called off the imminent downside alert in this cross rate. For now, we maintain a neutral bias. EUR/USD extensively tested the topside of the MT range, but the test was rejected earlier this week. The 1.0874/1.0906 area now looks a solid resistance. EUR/USD might return lower in the previous 1.0875/1.05 trading range.
EUR/USD: combination of USD rebound and euro softness is pushing EUR/USD back lower in the established trading range .
EUR/GBP
Post-Brexit sterling short-squeeze continues
For now, the start of the ‘official' Brexit procedure didn't cause any negative sentiment on the UK currency, on the contrary. The relative political calm in the Brexit-process triggered a further squeeze of GBP shorts. At the same time, the euro was under pressure as the market adapted positions for a prolonged period of easy ECB policy. This combination pushed EUR/GBP sharply lower yesterday. The pair tumbled below 0.86 and closed the session at 0.8562 (from 0.8658). The short-squeeze of sterling against the dollar was less aggressive, especially as the dollar gained momentum later in the session. Cable finished the session at 1.2468 (from 1.2435).
Overnight, Gfk Consumer confidence stabilised at -6 (-7) was expected. Sterling remained well bid in Asia this morning, but the pace of the rebound is slowing. Later today, the third and final reading of the UK Q4 GDP and the Q4 current account deficit will be released. These data are a bit old dated. Even so, a sharp decline of the current account deficit is expected from -£25.5 B to £16.0B. In the current sterling positive momentum, a good figure could still cause some further unwinding of GBP shorts.
Two weeks ago, sterling found a better bid after the early March decline. Substantially higher than expected UK inflation and a more hawkish tone from the BoE put a decent floor for sterling short-term. We changed our short-term bias on EUR/GBP from positive to neutral. Further consolidation in the MT sideways range might be on the cards. The return below the 0.8592 previous break-up even suggests that a full retracement to the 0.8402 range bottom is possible. Longer term, Brexit-complications remain a potential negative for sterling. We are not convinced that the BoE will raise rates anytime soon, even not after this months' higher inflation data.
EUR/GBP: euro decline and sterling short-squeeze are pushing EUR/GBP lower in the established trading range
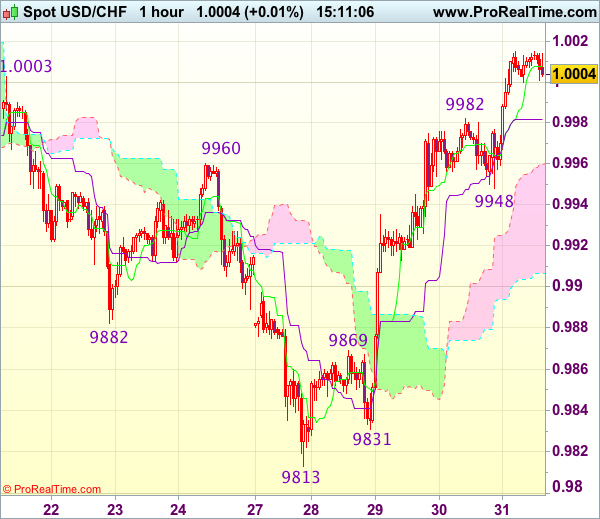
Trade Idea : USD/CHF – Buy at 0.9950
USD/CHF - 1.0006
Most recent candlesticks pattern : N/A
Trend : Near term up
Tenkan-Sen level : 1.0008
Kijun-Sen level : 0.9982
Ichimoku cloud top : 0.9960
Ichimoku cloud bottom : 0.9907
Original strategy :
Buy at 0.9910, Target: 1.0010, Stop: 0.9875
Position : -
Target : -
Stop : -
New strategy :
Buy at 0.9950, Target: 1.0050, Stop: 0.9915
Position : -
Target : -
Stop : -
As the greenback has surged again after finding renewed buying interest at 0.9948 yesterday, adding credence to our view that recent decline has ended at 0.9813 and bullishness remains for the rise from there to extend further gain to 1.0030, then towards previous support at 1.0060 (now resistance), however, near term overbought condition should limit upside and price should falter below resistance at 1.0109, risk from there is seen for a retreat later.
In view of this, would not chase this rise here and would be prudent to buy dollar on pullback as said support at 0.9948 should limit downside. Below 0.9910-15 would abort and signal top is formed instead, bring correction to 0.9880 but reckon previous resistance at 0.9869 would hold from here.
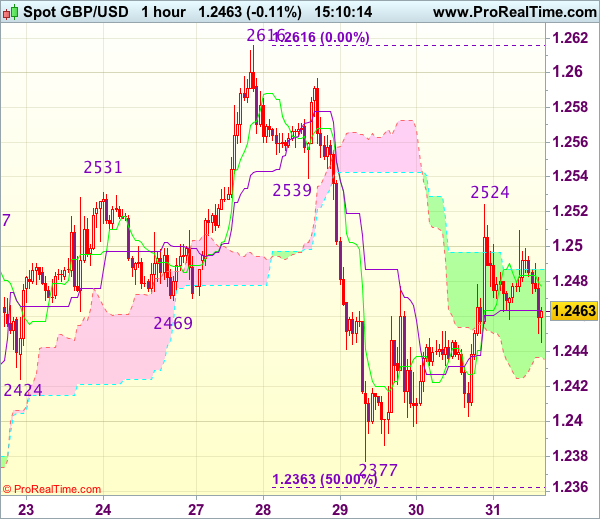
Trade Idea : GBP/USD – Stand aside
GBP/USD - 1.2454
Most recent candlesticks pattern : N/A
Trend : Near term up
Tenkan-Sen level : 1.2477
Kijun-Sen level : 1.2464
Ichimoku cloud top : 1.2487
Ichimoku cloud bottom : 1.2437
New strategy :
Stand aside
Position : -
Target : -
Stop : -
Although cable has retreated after yesterday’s rise to 1.2524 in part due to cross-trading in sterling and consolidation below said resistance would be seen, break of 1.2400 is needed to revive bearishness and signal the rebound from 1.2377 has ended at 1.2524, bring retest of 1.2377 (this week’s low) first, otherwise, further choppy trading would take place and risk of another rebound remains.
In view of this, would not chase this fall here and would be prudent to stand aside in the meantime. Above 1.2500 would bring another test of 1.2524, break there would bring test of previous support at 1.2539, however, break there is needed to signal the fall from 1.2616 has ended, bring further rise to 1.2555-60 later.
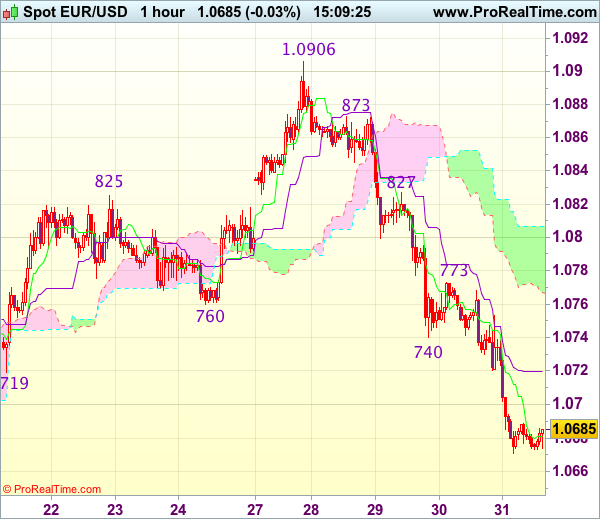
Trade Idea : EUR/USD – Sell at 1.0745
EUR/USD - 1.0686
Most recent candlesticks pattern : N/A
Trend : Near term down
Tenkan-Sen level : 1.0681
Kijun-Sen level : 1.0720
Ichimoku cloud top : 1.0807
Ichimoku cloud bottom : 1.0767
Original strategy :
Sell at 1.0800, Target: 1.0700, Stop: 1.0835
Position : -
Target : -
Stop : -
New strategy :
Sell at 1.0745, Target: 1.0645, Stop: 1.0780
Position : -
Target : -
Stop : -
As this week’s selloff has kept euro under pressure, adding credence to our bearish view that top has been formed at 1.0906 and bearishness remains for the decline from there to extend further weakness to 1.0660, then 1.0640, however, near term oversold condition would limit downside and reckon previous strong support at 1.0600 would hold from here, bring rebound later.
In view of this, would not chase this fall here and would be prudent to sell dollar on recovery as 1.0740-50 should limit upside. Only above resistance at 1.0773 would suggest low is formed instead, bring a stronger rebound to 1.0800 but resistance at 1.0827 should remain intact.
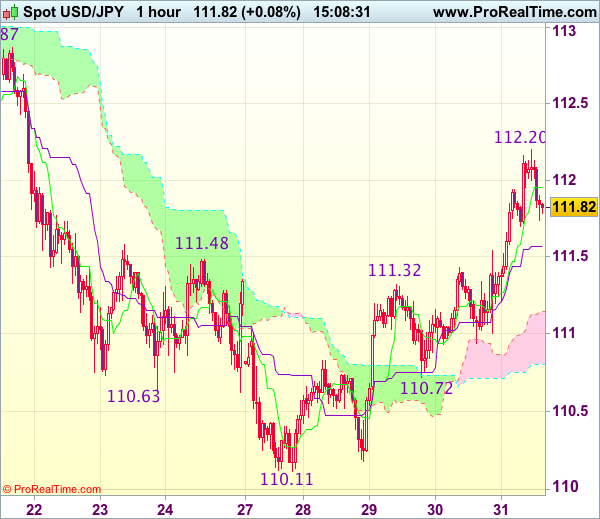
Trade Idea : USD/JPY – Buy at 111.25
USD/JPY - 111.79
Most recent candlesticks pattern : N/A
Trend : Near term up
Tenkan-Sen level : 111.95
Kijun-Sen level : 111.57
Ichimoku cloud top : 111.14
Ichimoku cloud bottom : 110.81
New strategy :
Buy at 111.25, Target: 112.25, Stop: 110.90
Position : -
Target : -
Stop : -
As the greenback has eased after intra-day initial rise too 112.20, suggesting minor consolidation below this level would be seen and test of the Kijun-Sen (now at 111.57) is likely, however, reckon the upper Kumo (now at 111.14) would contain downside and bring another rise later, above indicated resistance at 112.20-26 would extend the upmove from 110.11 low to 112.50-55 but price should falter below previous resistance at 112.87-90, bring retreat.
In view of this, would not chase this rise here and would be prudent to buy dollar on pullback as 111.25-30 should limit downside. Below 110.90-95 would abort and signal top is formed instead, bring test of support at 110.72, break there would suggest the rebound from 110.11 (this week’s low) has ended, then further fall to 110.45-50 would follow.