Sample Category Title
Is Oil’s Near-Term Rally Set To Reverse?
Key Points:
- Near-term rally now in jeopardy as the 100 day EMA draws nearer.
- Overarching bullishness could see the 51.55 handle tested moving ahead.
- OPEC still worth keeping an eye on.
Oil prices are reaching a critical zone of resistance which could spell trouble for the forecasted rally. Specifically, as has been discussed previously, the 100 day moving average is generating some significant resistance which could prevent the 51.55 mark from being reached over the coming session. As a result, it may be worth looking at some of the developing technical readings to establish a bias moving ahead.
Beginning with what could be an impediment to the previously forecasted rally, primarily, we expect the presence of the 100 day EMA to present a major obstacle for the pair. However, the movement of the stochastics into overbought territory will also be giving the bulls pause for thought. Additionally, a rather robust historical zone of resistance will also be playing its part in preventing further gains from being claimed.
Despite these factors, a number of other instruments are generally indicating that we should see the forecasted rally up to the 51.55 level take place. Firstly, the overarching double bottom structure would usually suggest that the strong uptrend should continue, especially given that we have broken above the neckline. Further, we have seen both a MACD signal line crossover and an inversion of the parabolic SAR reading which would also be indicative of upside potential.
Although the overall outlook remains fairly bullish, after overcoming the current impasse, gains should be limited to the 51.55 price as has been previously indicated. The presence of not only a historical zone of resistance but also the 50.0% Fibonacci retracement should provide more than enough resistance to halt oil's advance. Moreover, the ensuing reversal might even send the commodity all the way back to the lower constraint of the wedge.
Ultimately, we may be more at the mercy of fundamental upsets than we would like to admit at present. In particular, OPEC has been oddly silent despite the recent geopolitical developments in the market which could mean the cartel is on the verge of announcing a deepening or extension of its production freeze. Regardless, monitor oil prices closely over the coming week as we could have some interesting moves on our hands if the technical forecast rings true.
Asian Stocks Are Mixed
Market movers today
In the euro area, focus remains on inflation with the release of the aggregate figure. We expect headline inflation decline to 1.6% in March, from 2.0% in February, driven partly by a fall in core inflation from 0.9% to 0.7%. If this core inflation figure is correct, it will be the lowest since April 2016. However, our estimate of a decline is due mainly to the early timing of Easter in 2016, causing low inflation in volatile package holiday prices in March this year. Added to the lower core inflation, the latest decline in the oil price together with less support from base effects in energy prices is also likely to have driven headline inflation lower, although energy price inflation should still have a considerable positive contribution to inflation. Finally, food price inflation has surprised on the upside recently, due mainly to cold weather in the winter months, but should not have continued and we look for a lower contribution in March.
US PCE core inflation for February is also due for release today. While headline inflation has been increasing rapidly and is almost at the Fed's 2% target, PCE core inflation has remained stuck around 1.7%. We expect the development of PCE core inflation to attract special interest in coming months given the comments at the last FOMC meeting that the Fed has a 'symmetric inflation target', which could be interpreted as the Fed will be willing to let inflation slightly overshoot the 2% target. Hence, it implies a more dovish tone. However, we will have to see whether it actually means it. Last time PCE inflation was at 2% was at the beginning of 2012. We estimate the PCE core increased 0.2% m/m, implying 1.7% y/y. Thus, we expect core inflation to remain at the same level it has stayed at since August 2016.
In Scandi markets, we expect focus to be on Norwegian unemployment, together with the government's presentation of its Perspectives 2017 report. The Swedish wage negotiating process will also be followed closely before the current contracts run out (midnight) see more on page 2.
Selected market news
The Chinese official manufacturing PMI increased to 51.8 in March, from 51.6 in February, and is now at the highest level since 2012. Despite the continued improvement in the first few months of 2017, we believe the Chinese economy will be faced with some moderate headwinds this year, as we expect the housing market to cool and believe the significant infrastructure boost is set to fade. China has moved its foot from the gas to the brake and aims to rein in the brewing housing bubble and lean against inflationary pressure.
Asian stocks are mixed this morning but Chinese stocks have been supported by the economic figures and the Shanghai composite index added 0.3% on the last day of the month and quarter.
Despite the quarter-end there is nowhere the same stress in the European system as seen around year-end. It is likely that this move towards a more 'normal repo situation' could weigh on the short-end of the German yield curve over the next couple of days.
USDJPY Elliott wave View: Extended Bounce
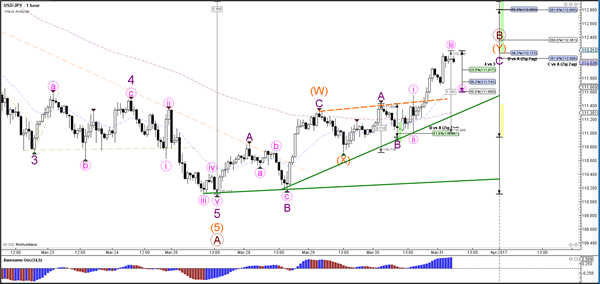
Short term Elliott Wave view in USDJPY suggests that cycle from 3/10 peak (115.53) has ended with Minor wave A at 110.077. Decline from 115.53 is unfolding as a 5 waves impulse Elliott wave structure with an extension where Minute wave ((i)) ended at 114.46, Minute wave ((ii)) ended at 115.19, Minute wave ((iii)) ended at 110.59, Minute wave ((iv)) ended at 111.34, and Minute wave ((v)) of A ended at 110.077. USDJPY ended cycle from 3/10 peak and correcting that cycle in Minor wave B bounce in 3, 7, or 11 swing.
Revised view suggests that Minor wave B bounce is unfolding as a zigzag Elliott wave structure where Minute wave ((a)) ended at 111.426 as 5 waves diagonal and Minute wave ((b)) ended at 110.96. Minute wave ((c)) of B is in progress as 5 waves and expected to complete at 112.31 – 112.63 area before pair resumes lower or at least pullback in 3 waves. As far as pivot at 3/10 high (115.53) stays intact, expect pair to extend lower or at least pullback in 3 waves once Minor wave B is complete.
1 Hour USDJPY Elliott Wave Chart
AUD/USD: Australian Private Sector Credit Rose Less Than Expected In February
>
For the 24 hours to 23:00 GMT, the AUD declined 0.29% against the USD and closed at 0.7643.
LME Copper prices rose 0.2% or $13.0/MT to $5860.0/MT. Aluminium prices rose 1.2% or $24.0/MT to $1955.0/MT.
In the Asian session, at GMT0300, the pair is trading at 0.7639, with the AUD trading slightly lower against the USD from yesterday's close.
Early morning data indicated that Australia's private sector credit recorded a rise of 0.3% on a monthly basis in February, falling short of market expectations for an advance of 0.5%. In the prior month, the private sector credit had registered a rise of 0.2%.
Elsewhere in China, Australia's largest trading partner, manufacturing PMI climbed to a level of 51.8 in March, expanding at its fastest pace in almost five years, thus adding to evidence that the world's second-largest economy is gaining steam early in the year. The PMI had registered a reading of 51.6 in the previous month, whereas markets were expecting a rise to a level of 51.7. Moreover, the nation's NBS non-manufacturing PMI rose to a two-year high level of 55.1 in March, reflecting strength in the nation's services sector and following a reading of 54.2 in the preceding month.
The pair is expected to find support at 0.7623, and a fall through could take it to the next support level of 0.7607. The pair is expected to find its first resistance at 0.7667, and a rise through could take it to the next resistance level of 0.7695.
Next week, traders will closely monitor the Reserve Bank of Australia's (RBA) interest rate decision along with Australia's AiG performance of manufacturing, services and construction PMI's as well as retail sales and trade balance data.
The currency pair is trading below its 20 Hr and 50 Hr moving averages.

EUR/USD: German Annual Inflation Came In Weaker Than Expected In March
For the 24 hours to 23:00 GMT, the EUR declined 0.74% against the USD and closed at 1.0684, following disappointing German flash inflation figures.
Data indicated that Germany's flash consumer price index (CPI) advanced less-than-expected by 1.6% on an annual basis in March, easing some pressure on the European Central Bank to wind down its massive monetary stimulus programme soon. The CPI had recorded a rise of 2.2% in the previous month, while market participants expected a gain of 1.8%.
Separately, the Euro-zone's final consumer confidence index improved to a level of -5.0 in March, meeting market expectations and confirming the preliminary print. In the prior month, the index had registered a level of -6.2.
The greenback traded higher against most of its major counterparts, after the latest data indicated that the US economy grew stronger than initially estimated in the fourth quarter of 2016.
The US annualised gross domestic product (GDP) was revised higher to 2.1% in the fourth quarter of 2016, boosted by robust consumer spending and compared to an advance of 3.5% in the previous quarter. The preliminary figures had indicated an advance of 1.9%, while markets anticipated the nation to grow by 2.0%. Meanwhile, the nation's initial jobless claims fell to a level of 258.0K in the week ended 25 March 2017, less than market expectations of a fall to a level of 247.0K and following a level of 261.0K in the previous week.
Separately, the Dallas Federal Reserve Bank President, Robert Kaplan, stated that he expects two additional interest rate increases this year.
In the Asian session, at GMT0300, the pair is trading at 1.0679, with the EUR trading marginally lower against the USD from yesterday's close.
The pair is expected to find support at 1.0643, and a fall through could take it to the next support level of 1.0606. The pair is expected to find its first resistance at 1.0742, and a rise through could take it to the next resistance level of 1.0804.
Moving ahead, investors will keep a close watch on the Euro-zone's flash consumer price index (CPI) data for March, slated to release later today along with Germany's unemployment rate and retail sales data, both for March, due in a few hours. Moreover, in the US, final Michigan consumer confidence index for March along with personal spending and income data for February, will be on investor's radar.
The currency pair is trading below its 20 Hr and 50 Hr moving averages.

GBP/USD: UK’s GfK Consumer Confidence Index Remains Stable In March
For the 24 hours to 23:00 GMT, the GBP rose 0.28% against the USD and closed at 1.2474.
In the Asian session, at GMT0300, the pair is trading at 1.249, with the GBP trading 0.13% higher against the USD from yesterday's close.
Overnight data showed that UK's GfK consumer confidence index surprisingly remained steady at -6.0 in March. Markets were anticipating it to fall to a level of -7.0.
The pair is expected to find support at 1.2419, and a fall through could take it to the next support level of 1.2348. The pair is expected to find its first resistance at 1.2543, and a rise through could take it to the next resistance level of 1.2596.
Trading trend in the GBP is expected to be determined by the release of UK's final fourth quarter GDP numbers, slated to release in a few hours.
The currency pair is trading above its 20 Hr and 50 Hr moving averages.

USD/JPY: Japan’s Unemployment Rate Falls To An Over 22-Yr Low Level In February
For the 24 hours to 23:00 GMT, the USD rose 0.63% against the JPY and closed at 111.79.
In the Asian session, at GMT0300, the pair is trading at 112.06, with the USD trading 0.24% higher against the JPY from yesterday's close.
Data released overnight showed that Japan's national consumer price index (CPI) advanced above expectations by 0.3% on an annual basis in February, while investors had envisaged for a rise of 0.2%. In the previous month, the CPI had advanced 0.4%. Additionally, the nation's jobless rate unexpectedly eased to 2.8% in February, marking its lowest level since June 1994 and boosting optimism over the health of the nation's labour market. Markets had anticipated the jobless rate to remain steady at 3.0%.
Moreover, the nation's flash industrial production rebounded 2.0% on a monthly basis in February, rising at the fastest pace in eight months and surpassing market expectations for a rise of 1.2%. In the previous month, industrial production had fallen 0.4%.
The pair is expected to find support at 111.27, and a fall through could take it to the next support level of 110.47. The pair is expected to find its first resistance at 112.5, and a rise through could take it to the next resistance level of 112.93.
The currency pair is trading above its 20 Hr and 50 Hr moving averages.

USD/CHF: Swiss Franc Trading Lower In The Morning Session
For the 24 hours to 23:00 GMT, the USD rose 0.43% against the CHF and closed at 1.0004.
On the macro front, Switzerland’s KOF economic barometer unexpectedly rose to a level of 107.6 in March, defying market consensus for a fall to a level of 105.8 and following a revised reading of 106.9 in the prior month.
In the Asian session, at GMT0300, the pair is trading at 1.0010, with the USD trading 0.06% higher against the CHF from yesterday’s close.
The pair is expected to find support at 0.9967, and a fall through could take it to the next support level of 0.9923. The pair is expected to find its first resistance at 1.0034, and a rise through could take it to the next resistance level of 1.0057.
With no economic releases in Switzerland today, investor sentiment would be governed by global macroeconomic factors.
The currency pair is trading above its 20 Hr and 50 Hr moving averages.

USD/CAD: Loonie Trading Marginally Lower, Ahead Of Canada’s January GDP Data
For the 24 hours to 23:00 GMT, the USD rose 0.03% against the CAD and closed at 1.3335.
In economic news, Canada's industrial product price index advanced less-than-expected by 0.1% on a monthly basis in February, against market expectations for a rise of 0.4% and compared to a revised increase of 0.6% in the prior month. Further, the nation's raw material price index registered a more-than-anticipated rise of 1.2% MoM in February, following a gain of 1.7% in the prior month.
In the Asian session, at GMT0300, the pair is trading at 1.334, with the USD trading a tad higher against the CAD from yesterday's close.
The pair is expected to find support at 1.3293, and a fall through could take it to the next support level of 1.3246. The pair is expected to find its first resistance at 1.3369, and a rise through could take it to the next resistance level of 1.3398.
Ahead in the day, market participants focus on Canada's crucial GDP data for January, to gain a better insight into the nation's economy.
The currency pair is trading above its 20 Hr moving average and showing convergence with its 50 Hr moving average.

EUR/USD Non-Stop Decline Breaks 1.0750 Support
Currency pair EUR/USD
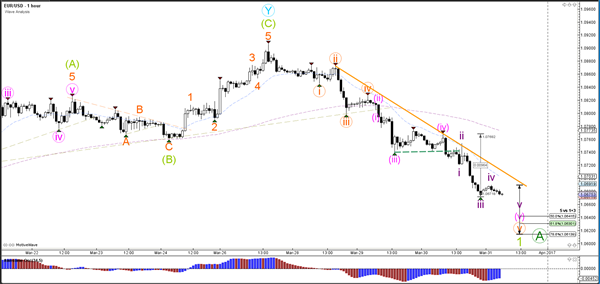
The EUR/USD continues to push lower with strong bearish impulse, which could either be a wave 1 (light green) or wave A (dark green). The strong bearish trend is indicated by the resistance trend line (orange). A break above this level could signal the end of wave 1 or wave A and the retracement for wave 2 or B.
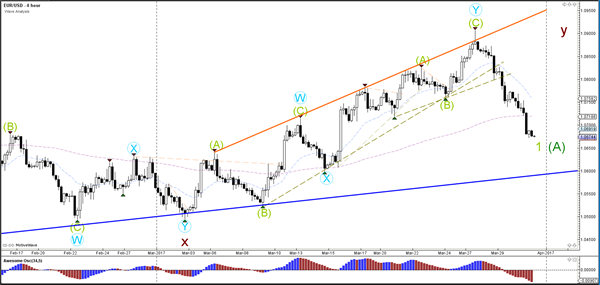
The EUR/USD broke below the 1.0750 support and support trend line (dotted green) as expected in yesterday's wave analysis and continued with the wave 5 (pink). Price seems to be building an extra 5 waves (purple) which could take price down to the Fibonacci targets.
Currency pair GBP/USD
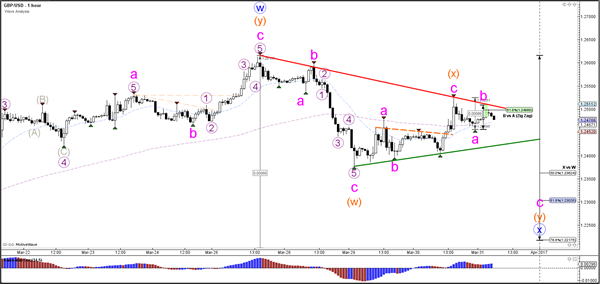
The GBP/USD remains in a triangle (red/green lines) chart pattern after breaking the smaller triangle yesterday (dotted orange). The wave WXY (orange) seems to be part of a wave X (blue) which could fit in a WXY (blue) within a larger wave E (green) triangle.
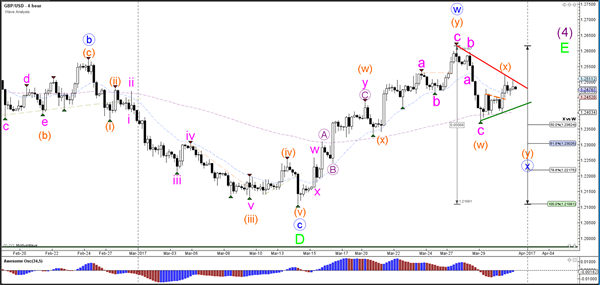
The GBP/USD seems to have completed the wave X (orange) at the 61.8% Fibonacci level mentioned yesterday at around 1.2525. Now price has turned and it seems to be building a bearish ABC (pink). A break below support (green) could confirm the bearish breakout whereas a break above resistance (red) would indicate an expansion of the wave X (orange).
Currency pair USD/JPY
The USD/JPY broke above the resistance trend line (dotted orange) and managed to retrace back to the 38.2% Fibonacci levels of wave B vs A, which could act as a resistance level. A break above this Fib could see price challenge the 50-61.8% Fibonacci zone. A bearish bounce could see price test the support trend line (green).
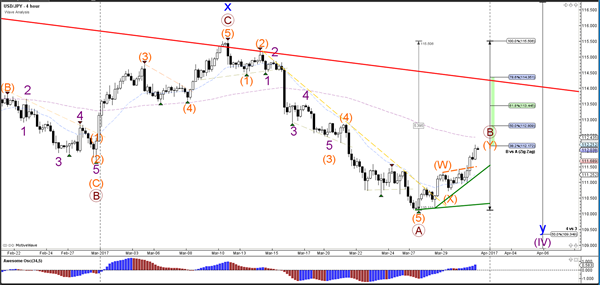
The USD/JPY indeed bounced at the Fibonacci levels of wave B vs A and continued with a strong bullish momentum which could be a wave 3 (pink). In that case, a wave 4 (pink) retracement could develop but price needs to stay above the 50% Fib of wave 4 vs 3 otherwise the wave 4 is invalidated.