Sample Category Title
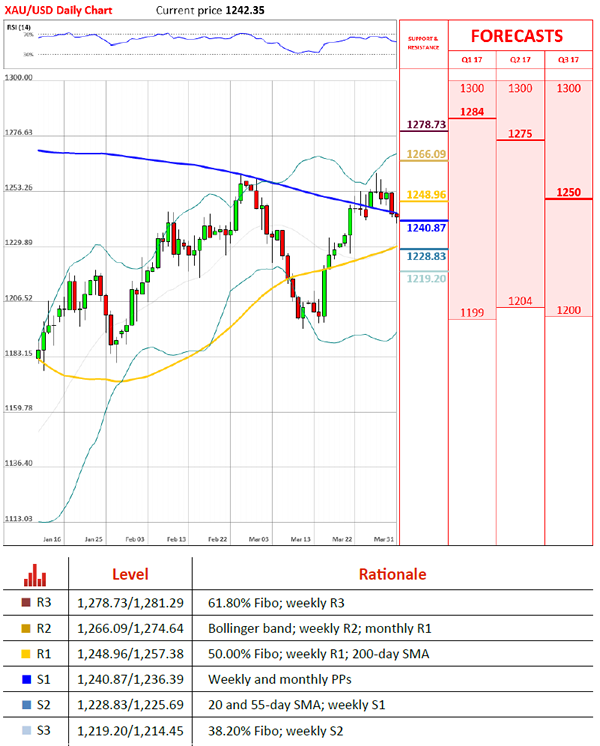
Gold Retreats To 1,240 Level
'In the short term, factors including a strengthening dollar could pull prices down to around the $1,230 an ounce range.' – Yuichi Ikemizu, Standard Bank (based on Reuters)
Pair's Outlook
On Friday the yellow metal began the day's trading session just above the 1,240 level. The reason for that is the strength of the US Dollar, which pushed the price lower in the second part of Thursday's trading session. However, the metal seems to have found support in the weekly PP, which is located at the 1,240.87 mark, which indicates that a short period of consolidation is set to occur. Although, the further short term path of the metal is most likely going to be dictated by the US Dollar fundamentals and political risk events around the world.
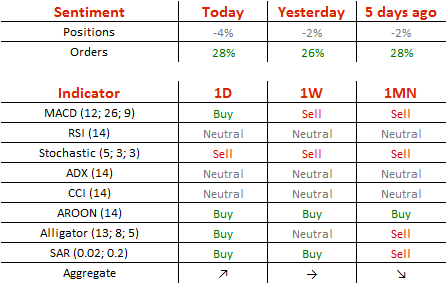
Traders' Sentiment
Traders have increased their bearish outlook on the bullion, as 52% of open positions are short, compared to 51% the past three consecutive trading sessions. Meanwhile, 64% of set up orders are to buy.
Consumer Spending Boosts Economic Growth In Q4 2016, Initial Jobless Claims Drop 3,000 Last Week
'Some of this softness is due to seasonal adjustment issues that will reverse later in the year. Consumer spending will lead growth thanks to higher incomes from more jobs and rising wages.' - Gus Faucher, PNC Financial
The US economy expanded at a stronger than initially expected pace during the final quarter of 2016 amid higher consumer spending. The Commerce Department reported on Thursday the economy grew at a 2.1% annualised rate in the Q4 of 2016, compared to the previously estimated 1.9% pace. Nevertheless, for all of 2016, the economy expanded just 1.6%, the slowest pace of growth since 2011, following a 2.6% expansion in 2015. Moreover, the most recent economic indicators suggested that economic growth slowed further in the Q1 of 2017. According to the Atlanta Fed, the US economy expanded at a 1.0% rate in the Q1. However, economists claim that US employment data is more reliable than output data, as it paint a clearer picture of national income growth. Thursday's data also showed consumer spending advanced 3.5% during the last quarter of 2016, up from the initially reporter 3.0% growth rate. Furthermore, domestic demand climbed 3.4% in the Q4 of 2016, the fastest pace of growth in two years, as imports posted a 9.0% jump, the biggest since the Q4 of 2014. Other data released on Thursday revealed that initial jobless claims dropped 3,000 to a seasonally adjusted 258,000 in the week ending March 25, remaining below the 300,000 level for 108 consecutive weeks.
Swiss KOF Index Points To Above-Average Growth In Near Term
'2018 seems that it may be the year for the SNB to start normalizing policy.' - Nadia Gharbi, Pictet & Cie
Data released on Thursday revealed that the Swiss KOF leading indicator surged slightly over the month of March, reconfirming the strong February data and suggesting a better-than-expected growth of the country's economy. The KOF Swiss Economic Institute reported the KOF index added 0.7 points last month and held strongly above its long-term average, jumping to 107.6 from a downwardly revised reading of 106.9 registered in the preceding month. The upmove was mainly driven by the positive trend established in the construction sector coupled with favourable signals from the financial sector and domestic private consumption. In the meantime, indicators for last month's leading industries, namely, manufacturing and hospitality, posted almost no change over the observed period, while exporting sector sent slightly negative signals. Despite that, the KOF said muted confidence in the manufacturing industry did not manage to hurt the overall sentiment, as the upgraded assessment of the business situation in the country coupled with generally more positive outlook for intermediate goods and inventories weighed. Overall, the KOF report suggested that the Swiss economy should expand at an above-average growth pace in the months to come.
S&P500 Trading In A Temporary Correction, More Upside In View
E_mini S&P500 is recovering nicely since Monday; it seems that bullish trend is back in play which is expected to continue after any three wave retracement. We see a flat in progress now with subwave C, final leg of a correction that may find a base at 2345-2350 area.
S&P500, 1H
WTI OIL – Strong Bullish Signal On Break Above Psychological $50.00 Barrier
Strong rally in past three days eventually broke and closed above key barriers at $50.00/10 (psychological barrier / Fibo 38.2% of $55.01/$47.06 descend), generating firmer bullish signal.
Recovery from $47.06 base peaked at $50.45, with subsequent easing signaled by reversal of 4-hr RSI / slow stochastic from overbought territory.
Dips may extend below $50, now acting as initial support and should be ideally contained above $49.25/16 support zone ( yesterday’s low / broken 20SMA / Fibo 38.2% of $47.08/$50.45 rally) ahead of fresh attempts higher.
Also, weekly close above $50.0 handle would be seen as strong bullish signal for extension towards next strong barrier at $51.03 (50% retracement of $55.01/$47.06) reinforced by 100SMA.
Res: 50.45, 51.03, 51.21, 51.73
Sup: 50.00, 49.50, 49.16, 48.67

AUDUSD – Daily Cloud Continues To Underpin But Rallies Remain Limited By Daily Tenkan-Sen
The pair is congested between daily cloud top and Tenkan-sen line, which was cracked on past two days rallies but so far without sustained break higher.
Thickening daily cloud continues to underpin, however, the pair is lacking momentum for stronger upside action for now.
Daily Tenkan-sen (0.7666) is also 50% of 0.7747/0.7585 pullback and repeated failure here would keep the downside vulnerable.
Mixed setup of daily MA's also shows no clear direction.
Weekly close below cloud top (currently at 0.7646) would generate initial bearish signal and expose lower pivot at 0.7618 (daily Kijun-sen) break of which will be bearish.
Res: 0.7666, 0.7685, 0.7709, 0.7739
Sup: 0.7632, 0.7618, 0.7588, 0.7550

USDJPY – Bullish Signal On Close Above Weekly Cloud Needs Confirmation On Sustained Break Above Fibo 38.2% Barrier At...
Thursday's close well above weekly cloud top (111.36) was strong bullish signal for extended recovery from 110.00 base. Fresh extension higher on Friday cracked next pivot at 112.15 (Fibo 38.2% of 115.49/110.09 downleg) adding on bullish near-term sentiment. Corrective easing on overbought 4-hr studies is under way, with another bearish signal seen on slow stochastic entering overbought zone on daily chart. This may delay near-term bulls for correction that should be ideally contained by strong support zone between 111.47/25 (daily Tenkan-sen/weekly cloud top/4-hr cloud base) to keep near-term bulls in play for fresh recovery attempts. However, bearish daily studies see risk of recovery stall. Today's close below weekly cloud top would be initial signal of false break higher and would turn risk to the downside.
Res: 112.15, 112.79, 113.14, 113.43
Sup: 111.47, 111.36, 111.25, 110.93
GBPUSD – Daily Cloud Top Offers Strong Barrier
Cable is struggling to sustain break above daily cloud (cloud top lies at 1.2474, reinforced by Tenkan-sen).
Thursday's rally spiked above 1.2500 handle but was unable to hold gains and daily action was shaped in candle with long upper shadow.
Similar scenario is seen on early Friday's trading (uptick to 1.2505 and subsequent pullback below daily cloud top).
However, daily studies are bullish and favor fresh upside attempts while the price is holding above strong support at1.2412, where 55/100SMA bull-cross is forming.
Eventual close above daily cloud is needed to attract recent peak at 1.2613 and possible further upside on break. On the other side, close within the cloud would further weaken near-term structure, which is currently in neutral/bearish mode.
Loss of 100SMA support would rish fresh weakness towards key near-term supports at 1.2360/45 (daily Tenkan-sen/cloud base).
Profit taking at the end of the month could also influence the pair.
Res: 1.2474, 1.2505, 1.2522, 1.2557
Sup: 1.2442, 1.2412, 1.2360, 1.2345
EURUSD – 55SMA Offers Support For Correction Ahead Of Fresh bears
The Euro extended downleg from 1.0905 high and closed below important 1.0700 support on Thursday's strong bearish acceleration. Near-term bias turned with bears and eyes next targets at 1.0650 (Fibo 61.8% of 1.0493/1.0905 upleg) and 1.0922 (daily cloud top/100SMA).
The fall found temporary support at 1.0672 (55SMA) which is holding for now, with strongly oversold 4-hr studies suggesting a pause in the downmove.
Near-term action is holding within narrow consolidation, seeing limited upside, ahead of fresh push lower on bearish sentiment.
Broken 1.0700 support now acts as solid resistance, however, stronger corrective action cannot be ruled out.
Falling hourly cloud (spanned between 1.0764 and 1.0804) is expected to cap extended upticks.
The pair is on track for strong bearish weekly close that maintains bearish stance.
Today's repeated close below 1.0700 handle is needed to confirm.
Res: 1.0700, 1.0726, 1.0764, 1.0788
Sup: 1.0650, 1.0622, 1.0583, 1.0570
Forex Technical Analysis
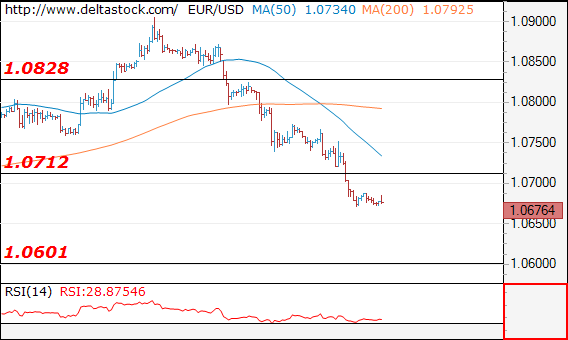
EUR/USD
Current level - 10676
The downtrend is intact, heading towards 1.0600 static support, en route to 1.0490 lows. Initial intraday resistance lies at 1.0712 and crucial on the upside is 1.0770.
| Resistance | Support | ||
| intraday | intraweek | intraday | intraweek |
| 1.0712 | 1.0904 | 1.0600 | 1.0600 |
| 1.0828 | 1.1010 | 1.0490 | 1.0490 |
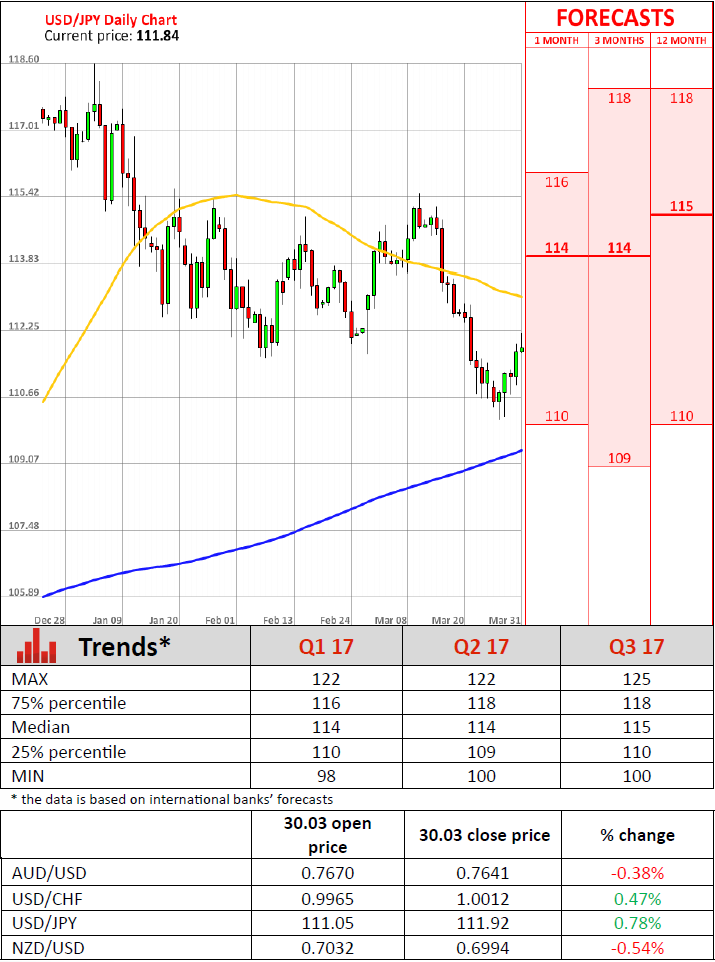
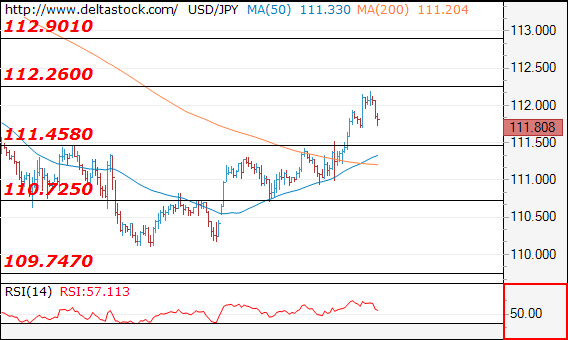
USD/JPY
Current level - 111.80
The pair broke through 111.45 resistance and reached a local peak below 112.26 hurdle. My outlook remains bullish above 111.45, for a rise towards 112.90. Crucial on the downside is 111.00.
| Resistance | Support | ||
| intraday | intraweek | intraday | intraweek |
| 112.26 | 113.50 | 111.45 | 109.75 |
| 112.90 | 115.65 | 111.00 | 107.80 |
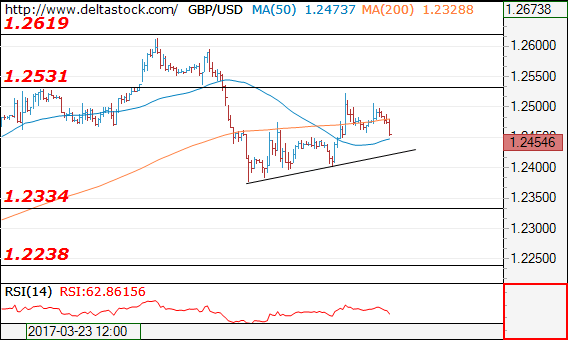
GBP/USD
Current level - 1.2454
The rebound above 1.2376 is corrective and the overall outlook remains bearish below 1.2530, for a slide towards 1.2240 area.
| Resistance | Support | ||
| intraday | intraweek | intraday | intraweek |
| 1.2530 | 1.2619 | 1.2400 | 1.2107 |
| 1.2619 | 1.2705 | 1.2230 | 1.1984 |