Sample Category Title
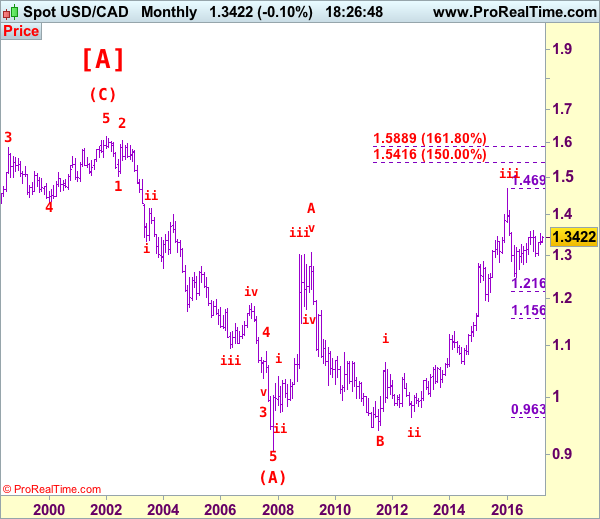
Trade Idea Update: GBP/USD – Hold short entered at 1.2465
GBP/USD - 1.2466
Original strategy :
Sold at 1.2465, Target: 1.2365, Stop: 1.2500
Position : - Short at 1.2465
Target : - 1.2365
Stop : - 1.2500
New strategy :
Hold short entered at 1.2465, Target: 1.2365, Stop: 1.2500
Position : - Short at 1.2465
Target : - 1.2365
Stop : - 1.2500
Cable’s rebound after holding above support at 1.2419 suggests further consolidation above this level would be seen, however, as long as indicated resistance at 1.2500 holds, mild downside bias remains for another fall, below said support at 1.2419 would bring test of 1.2400 but break there is needed to add credence to our view that the rebound from 1.2377 has ended at 1.2559, bring further fall towards support at 1.2377. Looking ahead, only a drop below 1.2377 would confirm the fall from 1.2616 is still in progress for subsequent decline towards key support at 1.2335.
In view of this, we are holding on to our short position entered at 1.2465 but one should exit on such decline. Only break of said resistance at 1.2500 would abort and suggest low has been formed instead, risk a stronger rebound to 1.2525-30, then towards resistance at 1.2559.
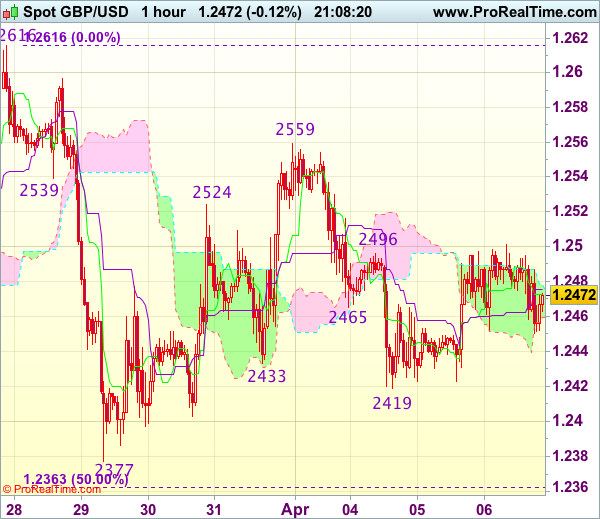
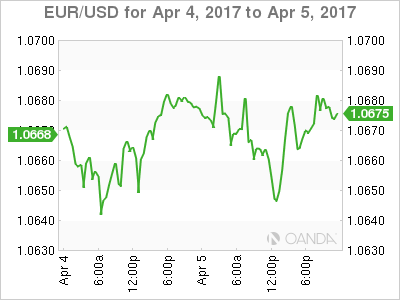
Trade Idea Update: EUR/USD – Sell at 1.0725
EUR/USD - 1.0659
Original strategy :
Sell at 1.0725, Target: 1.0610, Stop: 1.0760
Position : -
Target : -
Stop : -
New strategy :
Sell at 1.0725, Target: 1.0610, Stop: 1.0760
Position : -
Target : -
Stop : -
As the single currency has remained under pressure after recent selloff, bearishness remains for the decline from 1.0906 to extend further weakness to 1.0620, then test of previous chart support at 1.0600, however, a sustained breach below the latter level is needed to retain downside bias for subsequent selloff to 1.0570-75 first.
In view of this, would not chase this fall here and would be prudent to sell dollar on recovery as 1.0720-30 should limit upside. Only a firm break above resistance at 1.0773 would suggest low is formed instead, bring a stronger rebound to 1.0800 but resistance at 1.0827 should remain intact.
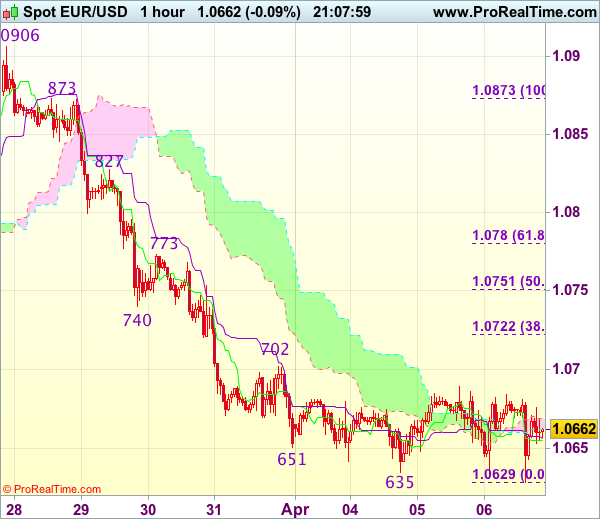
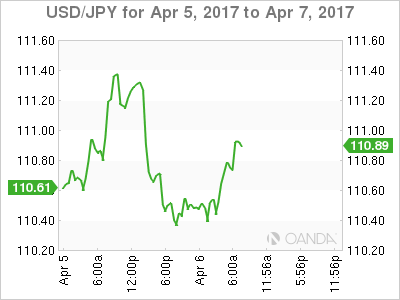
Trade Idea Update: USD/JPY – Sell at 111.10
USD/JPY - 110.80
Original strategy :
Sell at 111.10, Target: 110.10, Stop: 111.45
Position : -
Target : -
Stop : -
New strategy :
Sell at 111.10, Target: 110.10, Stop: 111.45
Position : -
Target : -
Stop : -
As the greenback ran into renewed selling interest at 111.46 and has dropped sharply, retaining our bearishness for the decline from 112.20 top to resume after consolidation, below 110.27 (this week’s low) would confirm and extend the fall from 112.20 to last week’s low at 110.11. Looking ahead, break there is needed to retain downside bias and confirm medium term decline has resumed for further subsequent fall to 109.80-85 (1.618 times projection of 112.20-111.12 measuring from 111.59) which is likely to hold on first testing.
In view of this, would not chase this fall here and would be prudent to sell dollar on recovery as 111.00-10 should limit upside. Only above 111.46 resistance would abort and prolong choppy trading, risk rebound to 111.59, then towards 111.90-00 later but price should falter well below said resistance at 112.20.
Caution Prevails ahead of Trump-Xi Summit
Global stocks were vulnerable to sharp losses during late trading on Wednesday after investors were caught unprepared by the hawkish Federal Reserve minutes. The negative momentum has already rippled into Thursday's trading session with Asian shares concluding depressed. European markets may be exposed to further downside shocks as anxiety ahead of the Trump-Xi summit dents risk sentiment. Gains on Wall Street may be limited this week with the appetite for risk diminished by signs of the Federal Reserve unwinding its $4.5 trillion balance sheet. The phenomenal stock market rally could start facing serious headwinds moving forward especially when considering how investors have started to question the logic and sustainability of the Trump rally.
Trump-Xi summit round 1
A strong sense of caution has masked the financial markets on Thursday with investors on high alert ahead of the heavily anticipated Trump-Xi summit. With Trump in the past repeatedly accusing China of keeping its currency at artificially low levels against the Dollar and stealing American jobs, the outcome of the meeting is something that remains unknown. If Trump decides to play hardball and maintains his harsh rhetoric on China, then risk aversion may intensify consequently sending investor's rushing towards safe-haven assets. It must be kept in mind that one should always expect the unexpected with Trump and such could create a possibility of the meeting concluding on a positive note.
Fed hawks support Greenback
Dollar bullish investors were gifted a hawkish surprise on Wednesday after the Fed minutes showed that the Central Bank is planning to shrink its $4.5 trillion balance sheet. Despite the "Dovish hike" in March, the overall tone of the minutes was hawkish which supported the Greenback. With the short-term bulls looking beyond the Trump uncertainty to elevate the Dollar, further upside could be expected if Friday's NFP exceeds expectations. From a technical standpoint, the Dollar Index is hovering around 100.50 with 101.00 as a possibility if bulls can maintain control. In an alternative scenario, weakness back below 100.25 could open a path back towards the psychological 100.00 level.
Draghi Strikes again
The EUR stumbled lower during trading on Thursday after Mario Draghi stated there was no need to change the current policy path amid the weak inflationary pressures. This dovish statement has quelled the heated expectations of the ECB raising rates at the end of the year with the probability dropping below 20%. As risks in Europe remain tilted to the downside and political uncertainty weighing heavily on sentiment, the Euro could be instore for further punishment. From a technical standpoint, the EURUSD remains heavily pressured on the daily charts. Previous support around 1.0750 could transform into a dynamic resistance that encourages a decline towards 1.0500.
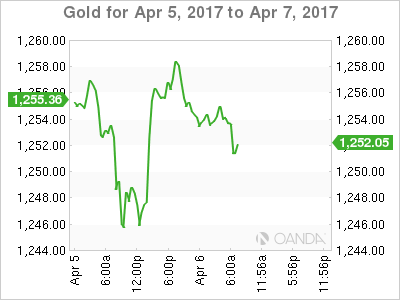
Commodity spotlight - Gold
Gold staged an impressive rebound during late trading on Wednesday with prices closing above $1250 as anxiety heightened ahead of the Trump-Xi summit. Although the impressive ADP report and hawkish Fed minutes enticed bears to enforce some downside pressures, the mounting uncertainty across the board has ensured the metal remains buoyed. With the Brexit negotiations, elections in Europe and Trump developments likely to create a risk-off atmosphere, Gold remains somewhat supported in the medium term. From a technical standpoint, bulls need to break above the stubborn $1260 resistance for the bullish trend to continue.
How Will Trump-Xi Summit and Non-Farm Payroll Affect Gold Prices?
Spot gold has been consolidating in the range between 1238 - 1260 in the past two weeks.
The bulls have failed to break through the short term major resistance level at 1260 over the period.
On the 4-hourly chart, the current price is trading below the downside uptrend line. In addition, the 10 SMA is crossing over the 20 SMA downwards, indicating the bullish momentum is waning.
US President Trump and Chinese president Xi Jinping, are scheduled to meet today at Trump's Mar-a-Lago resort in Florida. This is the first meeting between the leaders of the two biggest economies in the world so markets will be looking for any comments made between these 2 world leaders.
Be aware that the political event and the news that associate with impacts on the US economy, will likely cause volatility for USD and gold prices.
US non-farm payroll and unemployment for March will be released this Friday at 13:30 BST, it will also cause volatility for USD and gold prices.
US initial jobless claims (the week ending March 31) will be released at 13:30 BST today.
The resistance level is at 1255, followed by 1257.50 and 1260.
The support line is at 1250.00, followed by 1247 and 1243.50.


Technical Outlook: Dow Strong Upside Rejection at 20827
Dow continues to trade within 20450/20700 congestion, where the index is holding for nearly two weeks, after pullback from new all-time high at 21160 stalled. Choppy trading, seen in past few days, is without clear direction, however daily indicators are heading south; MACD is in negative territory and bearish momentum building up that keep bearish alignment of the daily picture.
In addition, strong upside rejection at 20827 on Wednesday that left big bearish candle with long upper wick, continues to weigh on market.
Fresh extension lower on Thursday penetrated into rising daily Ichimoku cloud which underpins strong bull-trend since early Nov 2016, could be also seen as bearish signal.
Daily cloud top lies at 20635 and close below it would keep negative near-term sentiment for renewed attempts towards 20500/450 support zone.
Range boundaries mark pivotal points for firmer direction signals on break of either side.
Weakening daily and bearish studies on lower timeframes keep the downside vulnerable for now.
Res: 20635; 20700; 20742; 20827
Sup: 20512; 20451; 20437; 20355
Federal Reserve and Donald Trump Has US Dollar in Trouble
Thursday April 6: Five things the markets are talking about
The FOMC minutes yesterday made it clear that shrinking the +$4.5T balance sheet will be a priority for U.S policy makers in the coming years, but probably would start very "gradually" and not until late this year at the soonest.
The timing is the biggest issue; some Fed members indicated that the process would begin when a specific funds rate is achieved; while others argued they wanted to start based on a "qualitative" assessment of the economy.
Obviously, investors would like the certainty of a defined trigger because that provides some clarity in what will be an unprecedented move by the Fed.
A portion of communiqué was devoted to high stock prices, noting that prices are now above "some standard measures of valuations above historical norms" and that "some measures of valuations, such as price-to-earnings ratios, rose further above historical norms." The net result, the main reason why global equities are having a tough go of it in the overnight session.
Worries about the "Trump trade" pro-business agenda is also a market concern now that U.S House Speaker Ryan indicated that the White House and Congress are still 'not' on the same page in terms of tax reform.
Market focus remains on today's upcoming discussions between the leaders of the U.S and China in Florida.
1. Stocks struggle after valuation concerns
Global equities have slid and U.S futures have ticked lower now that the Fed has indicated they favour shrinking the bank's balance sheet this year.
Japanese stocks led the losses, falling the most in two-weeks to sit at their lowest point in four-months. The Nikkei dropped -1.4% aided by a stronger yen (¥110.57), the lowest close since early Dec. The broader Topix dropped -1.6%.
In Hong Kong, the Hang Seng lost -0.4%, while the Hang Seng China Enterprises Index was down -0.6%. In China, the Shanghai Composite rose +0.3% following yesterday's +1.5% jump.
Elsewhere, Australia's S&P/ASX 200 Index fell -0.5%, while South Korea's Kospi index also fell -0.5%.
In Europe, indices are trading lower as markets fret ahead of today's ECB minutes of the latest policy meeting (07:30am EST). Banking stocks are weighing on Eurostoxx 600, while commodity names are providing some support to the FTSE 100.
U.S stocks are set to open in the red (-0.1%).
Indices: Stoxx50 -0.3% at 3,460, FTSE -0.6% at 7,288, DAX -0.5% at 12,162, CAC-40 -0.2% at 5,082, IBEX-35 -0.1% at 10,396, FTSE MIB -0.5% at 20,144, SMI -0.5% at 8,600, S&P 500 Futures -0.1%
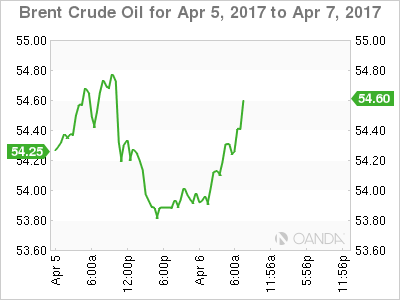
2. Oil glut worries has bulls backing off, gold lower
U.S crude inventory data temporarily pressured global prices yesterday afternoon when the U.S Energy Information Administration (EIA) against an expected drop of -400k barrels reported a surprise jump of +1.6m barrels. It was very much in contrast to Tuesday's API's -1.8m drawdown.
However, because of the U.S glut issues, domestic crude exports have risen to a record +1.1m bpd. Most cargoes are going to Asia, where there are early signs of a "tightening" market due to efforts led by the OPEC cut in production. Technically, the global picture is more important (than just the U.S.) and stocks are being drawn, supporting prices.
Crude prices are on track for a weekly gain of around +3%. Ahead of the U.S open, Brent crude futures are up +6c at +$54.42 a barrel, U.S West Texas Intermediate (WTI) crude futures are up +1c at +$51.16 a barrel.
Gold has edged lower (-0.1% to $1,253.21 per ounce), pressured by a slightly firmer dollar and on profit taking after bullion's recent challenge to the upside. Investors are waiting for tomorrow's non-farm payroll (NFP) before fully committing to the next leg.
3. Fixed Income tries to decipher Fed's actions
U.S yields have ticked up a tad after yesterday's release of the Fed minutes as officials signal they will start paring back its massive balance. Any signal from the Fed to start 'trimming' could drive investors to sell Treasury bonds more aggressively and push yields substantially higher and make the dollar more attractive. The 10-year yield is +2.380% vs. +2.361% before the minutes.
Note: The effect could be moderate if the Fed takes a slow approach, which is to slowly taper its reinvestments without outright sales of Treasury holdings.
Yields on 10-year German Bunds are under pressure this morning, briefly touching an intraday low of +0.241%, on ECB Draghi's speech. He noted that there is "scant evidence" that inflation will be durable and will stabilize at just under +2% – one of the central bank's four criteria of a "sustained adjustment."
Note: With the odd's now stacking up against Marine Le Pen winning the French Presidential election, fixed income traders are focusing more on Italian debt since Beppe Grillo, founder of Italy's Eurosceptic Five Star Movement, has a large lead in opinion polls as an Italian general election looms within 12-months.
4. Dollar sees mixed results on policy and geopolitical concerns
In Asia, safe haven demand on North Korean tensions saw yen rally to an intraday high of ¥110.30, before settling at ¥110.50'ish. AUD was the other main mover in the session, pressured by the banking regulator and China data (see below). The Australian Banking Regulator intends to make banks hold more capital against risky mortgage lending.
In Europe, it's been a relatively subdued session with overall market focus remaining on upcoming discussions between the leaders of the U.S and China.
The EUR is softer after ECB's Draghi dampened any speculation of any imminent change in its policy stance. The single unit hit a three-week low at €1.0630 following Draghi's commentary on forward guidance (see below).
Earlier this morning, the Reserve Bank of India (RBI) narrowed its rate corridor (not expected); left its Repurchase Rate unchanged at +6.25%, but raised the Reverse Repo by +25bps to +6.00%.
5. Draghi 'dovish,' China data weaker
Draghi dampened any speculation of any imminent change in ECB's policy stance. The ECB President reiterated that monetary policy stance remains appropriate; needed to see more inflation confidence before winding down the bank's massive monetary stimulus. Currently, the markets are betting that the ECB will start to increase rates early in 2018, before it ends its bond-purchase program.
In China overnight, the Caixin Services and Composite PMI's hit a six-month low (52.2 vs. 52.6 prior) with both manufacturers and service providers noting slower expansions in output.
Digging deeper, there is evidence of weaker growth in composite new-orders, weakest expansion of employment for this year and slowing input price inflation.
The Hong Kong composite PMI (49.9 vs. 49.6 prior) remained in contraction for a third-consecutive month, though it hit slightly higher levels thanks to first growth in output in two-years and another increase in total input costs during March.
Expectations for output over the next 12-months remains subdued amid economic downturn, political uncertainty, and higher housing rental costs.
Draghi Says European Central Bank (ECB) Stance is Appropriate
- USD weaker as Federal Reserve (Fed) moots bond sales
- German factory orders bounce back
- Draghi says European Central Bank (ECB) stance is appropriate
The US Federal Reserve released the minutes from its last meeting yesterday and the news was much as expected other than the tone seemed to suggest the Fed would start unwinding its massive $4.5 trillion bond stockpile later in the year. That, plus fear over what might happen when the US and Chinese Presidents meet. Trump's campaign trail comments about China stealing US jobs but the Chinese press is turning the tables on the US president and complaining that low taxes, cheap land and cheaper transport in America are factors leading to Chinese manufacturers moving production to the US. It'll be an interesting meeting.
Today's news is heavily slanted towards the EU. It started with German factory orders which bounced back from a dire 6.8% drop in January to 3.5% growth in February. This is further evidence of recovery in Europe overall and specifically in Germany. We will also get minutes from the last European Central Bank (ECB) meeting this morning. That has been pre-empted by ECB president Mario Draghi suggesting the current stance by the ECB is appropriate and that has weakened the Euro in early trade. I suspect that has nothing to do with Greece's unemployment rate, which we expect to remain gruesomely high at 23.1% or thereabouts.
Meanwhile, Sterling retains most of the gains it made last week, hovering as it is around €1.17 and $1.25. We are devoid of meaningful UK data today, so Sterling will be shifted by external factors. Tomorrow is a very different story and the Gross Domestic Product (GDP) data, manufacturing and industrial output numbers and the trade balance will move Sterling. The direction of travel is the only question mark.
And Donald Trump has removed hard-liner Steve Bannon from his National Security Council post. Whether it was for the controversy that seems to hang over Bannon wherever he goes or because he has a peculiar penchant for wearing two button down shirts at the same time is unknown.
Dead Donkey
A young lad buys a donkey for £100, but when the farmer delivers it, the donkey is stone dead and the farmer has already spent the money. "I'll take it anyway and raffle it off," says the boy. "You can't raffle a dead donkey," says the farmer. "Yes I can, I just won't tell them it's dead," says the boy.
A month later the boy meets the farmer at a market and he asked what happened with the raffle. "I sold 500 tickets at £2 a ticket and made £900 profit!" "Didn't anyone complain?" says the farmer. "Yes", the kid replies "Just the guy who won... so I gave him his £2 back".
[A career in investment banking beckons.]
EUR/GBP Elliott Wave Analysis
EUR/GBP – 0.8561
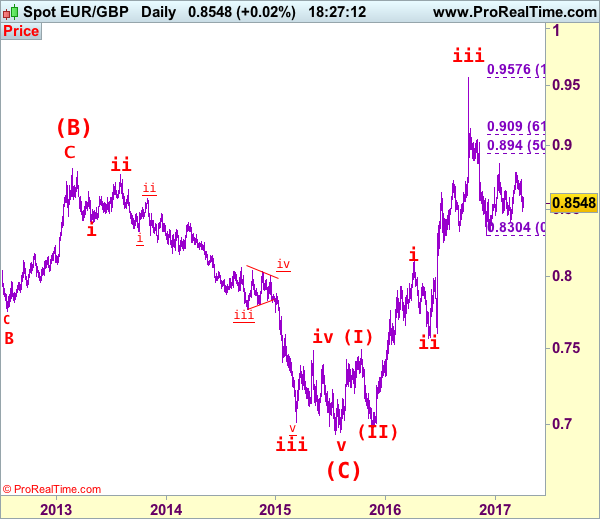
EUR/GBP – The major (A)(B)(C)-(X)-(A)(B)(C) correction from 0.9805 is unfolding and 2nd (A) has possibly ended at 0.6936.
Although the single currency dropped quite sharply last week, as long as support at 0.8485 (last week’s low) holds, consolidation with mild upside bias is seen for another rebound, above 0.8600 would bring test of 0.8660-65, however, break of resistance at 0.8735 is needed to retain bullishness and signal the fall from 0.8788 has ended, bring further gain to 0.8760 first. Looking ahead, only above said resistance at 0.8788 would extend the rebound from 0.8403 towards indicated resistance at 0.8857 which is likely to hold from here.
Our latest preferred count is that the wave V of a 5-wave series from 0.5682 ended at 0.9805 earlier and major from there has possibly ended at 0.8067 as A-B-C-X-A-B-C. We are keeping our view that the entire correction from 0.9805 has possibly ended at 0.7756 and as labeled as the attached daily chart and impulsive move from 0.9084 has ended at 0.7756 as a 5-waver which marked either the (C) wave or the A leg of (C), a daily close above resistance at 0.8831 would suggest (C) leg has ended and headway towards 0.9084.
On the downside, expect said support at 0.8485 to contain downside and bring another rise later. Below 0.8485 would defer and suggest top is formed instead, risk weakness to 0.8460-65 but break there is needed to provide confirmation and suggest the rebound from 0.8403 has ended, then retest of this support would follow.
Recommendation: Buy at 0.8510 for 0.8710 with stop below 0.8450.
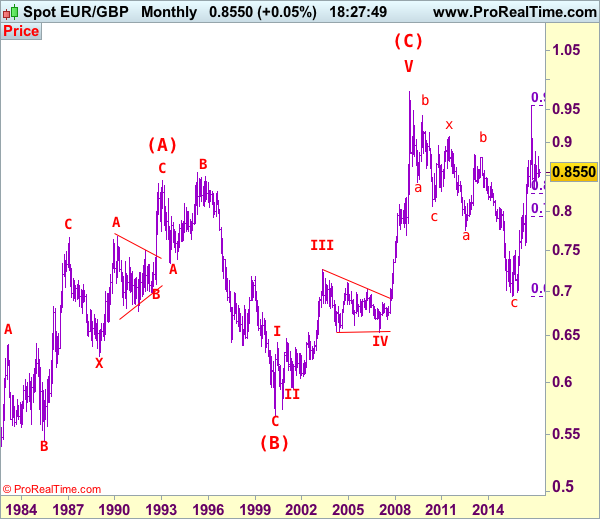
Euro's long term uptrend started in Feb 1981 at 0.5039 and is unfolding as a (A)-(B)-(C) move with (A): 0.8433 (Feb 1993), (B): 0.5682 (May 2000) and impulsive wave (C) should have ended at 0.9805 with wave III ended at 0.7254 (May 2003), triangle wave IV at 0.6536 (23 Jan 2007) and wave V as well as wave (C) has ended at 0.9805.
We are keeping an alternate count that only wave III ended at 0.9805 and the correction from there is the wave IV and may extend weakness to 0.7700, however, it is necessary to see a daily close above resistance at 0.9143 would change this to be the preferred count.
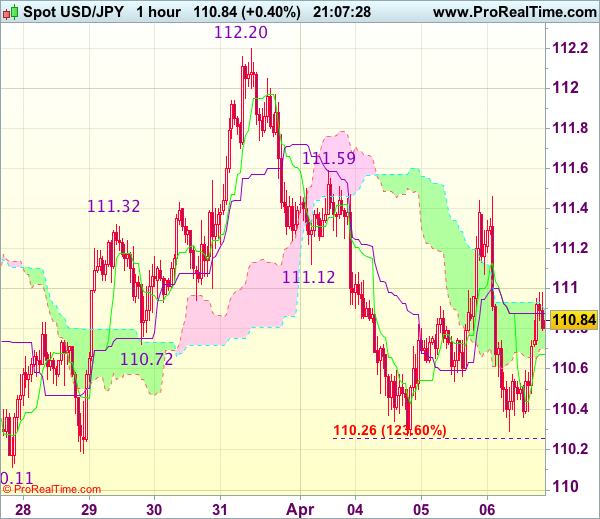
USD/CAD Elliott Wave Analysis
USD/CAD – 1.3427
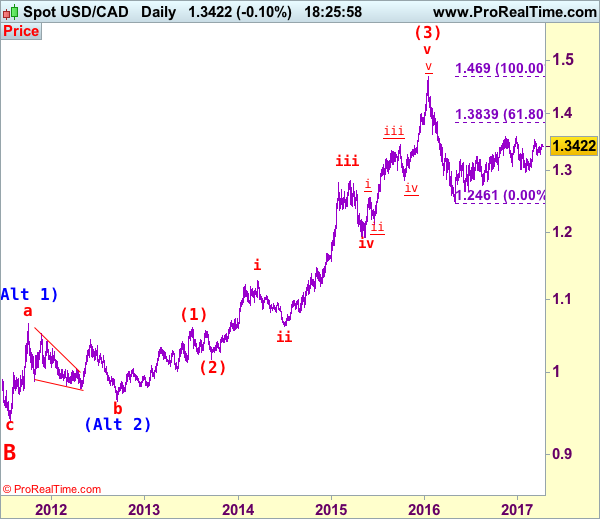
USD/CAD – Wave v ended at 0.9407 and a-b-c correction may extend gain to 1.4700
Although the greenback has rebounded again after holding above support at 1.3264 and further consolidation would be seen, as long as resistance at 1.3456-60 holds, prospect of another retreat remains, below 1.3375 would bring weakness to 1.3300 but break of said support at 1.3264 is needed to retain bearishness and add credence to our view that a temporary top has been formed at 1.3535 last month, bring correction of recent upmove to previous resistance at 1.3210-12 (now support). Only below this level would suggest the rebound from 1.2969 has ended and prolong choppy trading, bring weakness to 1.3100 but downside should be limited to 1.3056 support, bring rebound later.
We are keeping our view that the wave b from 1.0657 (a leg top) has possibly ended at 0.9633 with (a): 0.9800, wave (b): 1.0447 and wave c at 0.9633, the subsequent rise from there is now treated as wave c exceeded indicated upside target at 1.3770-80 and 1.4000 and wave (3) has possibly ended at 1.4690 and wave (4) correction has commenced for retracement back to 1.2832 support, then 1.2410-20.
On the daily chart, our latest preferred count remains that the A of (B) rally from 0.9059 low (7 Nov 2007) unfolded into an impulsive wave with i: 0.9059-1.0380, ii ended at 0.9819, iii at 1.3019 followed by triangle wave iv at 1.2026 , then wave v formed a top at 1.3066 and also ended the wave A. The wave B is unfolding as an double three a-b-c-x-a-b-c and is sub-divided as a: 1.2192, b: 1.2716 and wave c at 1.0784, followed by wave x at 1.1725, another set of a-b-c unfolded with 2nd a at 0.9931, 2nd b at 1.0674. the 2nd c has possibly ended at 0.9407, therefore, consolidation with upside bias is seen for major correction, indicated target at 1.3900 had been met and gain to 1.4700 would follow.
On the upside, expect recovery to be limited and bring another decline. Above 1.3455-60 would suggest the retreat from 1.3535 has possibly ended, bring a stronger rebound to 1.3500, then retest of 1.3535. A break of this resistance would revive bullishness and signal the rise from 1.2969 is still in progress for retest of 1.3599 top, once this level is penetrated, this would confirm the erratic rise from 1.2461 low has resumed for a stronger correction of early decline from 1.4690 (2016 high) to 1.3700 and later towards 1.3790-00, however, reckon upside would be limited to 1.3835-40 (61.8% Fibonacci retracement of 1.4690-1.2461) and bring retreat later.
Recommendation: Hold short entered at 1.3390 for 1.3190 with stop above 1.3460.
Longer term - The selloff from 1.6194 (21 Jan 2002) to 0.9059 (07 Nov 2007) is viewed as (A) wave which is a 5-waver as labeled on the monthly chart as below, the subsequently rally is labeled as (B) with impulsive A leg of (B) ended at 1.3066, wave B of (B) is unfolding which has either ended at 0.9407 or would extend one more fall but downside should be limited to 0.9200 and 0.9000 should hold.