Sample Category Title
Euro Steady Ahead Of ECB Minutes
EUR/USD continues to show little movement this week and this pattern has continued in the Thursday session. Currently, the pair is trading at 1.0660. On the release front, German Factory Orders rebounded in February with a gain of 3.5%, close to the forecast of 3.4%. The ECB will release the minutes from its March policy meeting and ECB President Mario Draghi will speak at a conference in Frankfurt. In the US, today's highlight is unemployment claims, which is expected to drop to 251 thousand. On Friday, the US releases Nonfarm Employment Change, which is expected to drop sharply to 174 thousand. We'll also get a look at wage growth and the unemployment rate.
German and Eurozone PMI reports, which are important gauges of the economy, looked solid in March. Manufacturing PMIs posted to expansion, and Services PMIs followed suit. German Services PMI climbed to a 15-month high, while Eurozone Services PMI jumped to a 71-month high, although it missed expectations. The euro shrugged off these strong numbers, as it continues to have an uneventful week. EUR/USD dropped 1.9 percent last week, marking its worst weekly decline since November 2016. The ECB will release the minutes of its March meeting, at which the central bank made no changes to interest rates or its asset purchase program. Although inflation levels have improved to their highest levels in years, they remain below the ECB target of 2.0%, so the central bank still has some breathing room and isn't under immediate pressure to tighten monetary policy. The ECB's asset purchase program of EUR 60 billion/mth is scheduled to expire in December. Any surprises from the minutes could have a strong impact on the movement of the euro.
The Federal Reserve released the minutes of its March policy meeting on Wednesday. At the meeting, the Fed raised rates a quarter-point to 0.75%, but the dovish rate statement disappointed the markets, triggering broad losses for the US dollar. In the minutes, policymakers noted upside risk to the US economy, but remained divided on whether inflation will rise to the Fed target of 2.0%. Most policymakers were in favor of taking steps to trim the $4.5 trillion balance, which has ballooned since the Fed implemented its aggressive quantitative easing program back in 2008. So what's next for the Fed? According to the CME's Fed Watch, the odds of a rate hike at the May meeting are just 5 percent, while the likelihood of a rate hike in June stand at 63 percent.
DAX – Investors Cautious Ahead Of ECB Minutes
The DAX Index has edged higher on Thursday. Currently, the DAX is trading at 12,186.75. In economic news, German Factory Orders rebounded in February with a gain of 3.5%, close to the forecast of 3.4%. The ECB will release the minutes from its March policy meeting and ECB President Mario Draghi will speak at a conference in Frankfurt. On Friday, Germany publishes Industrial Production and Trade Balance.
The eurozone has enjoyed a solid first quarter in 2017, and March PMI reports were positive. Manufacturing PMIs posted to expansion, and Services PMIs followed suit. German Services PMI climbed to a 15-month high, while Eurozone Services PMI jumped to a 71-month high, although it missed expectations. The euro shrugged off these strong numbers, as it continues to have an uneventful week. EUR/USD dropped 1.9 percent last week, marking its worst weekly decline since November 2016. The ECB will release the minutes of its March meeting, at which the central bank made no changes to interest rates or its asset purchase program. Although inflation levels have improved to their highest levels in years, they remain below the ECB target of 2.0%, so the central bank still has some breathing room and isn’t under immediate pressure to tighten monetary policy. The ECB’s asset purchase program of EUR 60 billion/mth is scheduled to expire in December. Any surprises from the minutes could have a strong impact on the movement of the euro.
There were no dramatic surprises from the Federal Reserve minutes for March, which were released on Wednesday. At that meeting, the Fed raised rates a quarter-point to 0.75%, but the dovish rate statement disappointed the markets, triggering broad losses for the US dollar. In the minutes, policymakers noted upside risk to the US economy, but remained divided on whether inflation will rise to the Fed target of 2.0%. Most policymakers were in favor of taking steps to trim the $4.5 trillion balance, which has ballooned since the Fed implemented its aggressive quantitative easing program back in 2008. So what’s next for the Fed? According to the CME’s Fed Watch, the odds of a rate hike at the May meeting are just 5 percent, while the likelihood of a rate hike in June stand at 63 percent.
Gold Monitoring Resistance At $1263, Silver Increasing Again, Crude Oil Short-Term Bullish.
Gold Monitoring resistance at $1263.
Gold is getting stronger. The momentum seems back to bullish despite some consolidation. Resistance is located at 1263 (27/02/2017 high). Hourly support can be found at 1224.10 (16/03/2017 low).
In the long-term, the technical structure suggests that there is a growing upside momentum. A break of 1392 (17/03/2014) is necessary ton confirm it, A major support can be found at 1045 (05/02/2010 low).
Silver Increasing again.
Silver has increased above 18.00 which is now a support. Strong resistance is given at a distance at 18.49 (27/02/2017 high). Key support is given at 16.82 (15/03/2017 low).
In the long-term, the death cross indicates that further downsides are very likely. Resistance is located at 25.11 (28/08/2013 high). Strong support can be found at 11.75 (20/04/2009).
Crude oil Short-term bullish.
Crude oil keeps on increasing. The commodity had been located in a bearish trend since the commodity had been unable to mount a serious challenge to resistance at 55.24 (03/01/2017 high) but now the pair is heading higher. Resistance is given at 51.88 (05/041/2017 high). Hourly support is given at 47.09 (22/03/2017 low).
In the long-term, crude oil has recovered after its sharp decline last year. However, we consider that further weakness are very likely. Strong support lies at 24.82 (13/11/2002) while resistance can now be found at 55.24 (03/01/2017 high).
EUR/CHF Short-Term Bearish, EUR/JPY Continued Decline, EUR/GBP Collapsing.
EUR/CHF Short-term bearish.
EUR/CHF's is trading around 1.0700. The medium-term pattern suggests us to see continued bearish pressures towards key support that can be found at 1.0623 (24/06/2016 low). Expected to see further decline.
In the longer term, the technical structure is mixed. Resistance can be found at 1.1200 (04/02/2015 high). Yet,the ECB's QE programme is likely to cause persistent selling pressures on the euro, which should weigh on EUR/CHF. Supports can be found at 1.0184 (28/01/2015 low) and 1.0082 (27/01/2015 low).
EUR/JPY Continued decline.
EUR/JPY rejection at 122.88 has triggered a correction. The pair is also very volatile. Hourly support at 119.33 (23/03/2017 low) has been broken. Resistance stands at 122.88 (13/03/0217 high). The road is wide-open for further weakness towards strong support given at 113.73 (09/11/2016 low).
In the longer term, the technical structure validates a medium-term succession of lower highs and lower lows. As a result, the resistance at 149.78 (08/12/2014 high) has likely marked the end of the rise that started in July 2012. Strong support at 94.12 (24/07/2012 low) looks nonetheless far away.
EUR/GBP Collapsing.
EUR/GBP is getting lower. Hourly resistance is given at 0.8591 (05/04/2017 high). Strong resistance is given at 0.8787 (13/03/2017 high). Hourly support can be found at 0.8484 (31/03/2017 low). Expected to show continued weakness.
In the long-term, the pair has largely recovered from recent lows in 2015. The technical structure suggests a growing upside momentum. The pair is trading above from its 200 DMA. Strong resistance can be found at 0.9500 psychological level.
USD/CHF Pushing Higher, USD/CAD Pushing Higher, AUD/USD Edging Lower.
USD/CHF Pushing higher.
USD/CHF is strengthening. Hourly support is given at 0.9814 (27/03/2017 low). Key resistance can be found at a distance at 1.0344 (15/12/2016 high). Expected to show another leg higher.
In the long-term, the pair is still trading in range since 2011 despite some turmoil when the SNB unpegged the CHF. Key support can be found 0.8986 (30/01/2015 low). The technical structure favours nonetheless a long term bullish bias since the unpeg in January 2015.
USD/CAD Pushing higher.
USD/CAD has broken resistance area around 1.3400 which invalidates the short term bearish technical structure. Hourly support is given at 1.3265 (21/03/2016 low) is at stake. Key support is given at 1.2969 (31/01/2017 low).
In the longer term, there is a golden cross with the 50 dma crossing the 200 dma indicating further upside pressures. Strong resistance is given at 1.4690 (22/01/2016 high). Long-term support can be found at 1.2461 (16/03/2015 low).
AUD/USD Edging lower.
AUD/USD is getting lower. The pair has failed to test the key resistance at 0.7778 (08/11/2016 high). Expected to see some short-term weakness towards support area around 0.7500.
In the long-term, we are waiting for further signs that the current downtrend is ending. Key supports stand at 0.6009 (31/10/2008 low) . A break of the key resistance at 0.8295 (15/01/2015 high) is needed to invalidate our long-term bearish view.
EUR/USD Consolidating Below 1.0700, GBP/USD Fading Momentum, USD/JPY Monitoring Support At 110.
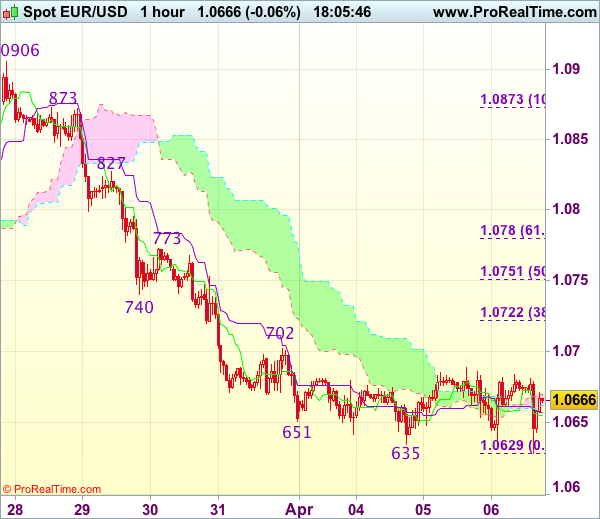
EUR/USD Consolidating below 1.0700.
EUR/USD is now consolidating. The pair is heading lower since the pair failed to hold above former resistance given at 1.0874 (08/12/2017 high). Hourly support can be found at 1.0630 (intraday low). Stronger support can be found at 1.0494 (22/02/2017 low). Expected to see further short-term weakness.
In the longer term, the death cross late October indicated a further bearish bias. The pair has broken key support given at 1.0458 (16/03/2015 low). Key resistance holds at 1.1714 (24/08/2015 high). Expected to head towards parity.
GBP/USD Fading momentum.
GBP/USD's bullish pressures have faded abruptly. Hourly resistance is located at 1.2615 (27/03/2017 high) while hourly support can be found at 1.2324 (03/17/2017 low). Expected to show continued strengthening towards stronger resistance at 1.2775 (06/12/2016 high) if support area around 1.24 stands.
The long-term technical pattern is even more negative since the Brexit vote has paved the way for further decline. Long-term support given at 1.0520 (01/03/85) represents a decent target. Long-term resistance is given at 1.5018 (24/06/2015) and would indicate a long-term reversal in the negative trend. Yet, it is very unlikely at the moment.
USD/JPY Monitoring support at 110.
USD/JPY's momentum is slowing down. Hourly resistance is given at 112.20 (31/03/2017 high). Stronger resistance can be located at 113.57 (16/03/2017 high) while support is given at 110.11 (27/03/2017 low).
We favor a long-term bearish bias. Support is now given at 96.57 (10/08/2013 low). A gradual rise towards the major resistance at 135.15 (01/02/2002 high) seems absolutely unlikely. Expected to decline further support at 93.79 (13/06/2013 low).
Technical Outlook: DAX – Risk Of Deeper Pullback On Break Below Daily Kijun-Sen
DAX remains at the back foot and opened lower on Thursday after previous day's strong fall.
Extension of pullback from fresh record high at 12410 (posted on 03 Apr) hit the mid-point of 11878/12410 upleg and sees risk of deeper pullback on cracking converged daily Tenkan-sen/ Kijun-sen lines (12176/12144) respectively.
Daily RSI that reversed from overbought territory is heading south and showing a plenty of space at the downside.
Close below daily Kijun-sen is seen as initial bearish signal to open a cluster of supports below that starts with 20SMA (12123) then Fibo 61.8% (12081) and 30 SMA (12065).
The move is seen as correction of broader uptrend since Feb 2016 low at 8695 and should be ideally contained between 12081/12036 zone (Fibo 61.8% / bull-trendline connecting 11459 and
11878 trough) to avoid deeper pullback that may extend below psychological 12000 support on violation of the latter points.
Another bearish signal is forming on reversal of RSI / slow stochastic from oversold territory on weekly chart that may signal stronger correction on break below 12000/11878 supports.
Resistance points lay at 12201 (session high), 12243 (Fibo 38.2% of current 1241/12141 downleg) that marks the upper pivot.
Res: 12201, 12243, 12275, 12307
Sup: 12144, 12123, 12081, 12036
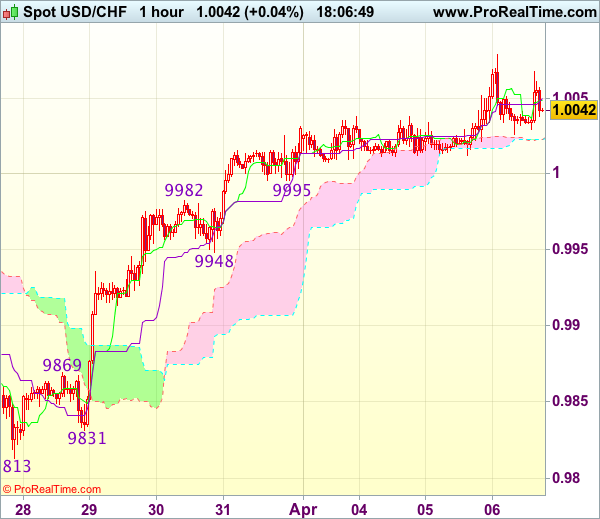
Trade Idea Update: USD/CHF – Buy at 0.9950
USD/CHF - 1.0043
Original strategy :
Buy at 0.9950, Target: 1.0050, Stop: 0.9915
Position : -
Target : -
Stop : -
New strategy :
Buy at 0.9950, Target: 1.0050, Stop: 0.9915
Position : -
Target : -
Stop : -
As the greenback has maintained a firm undertone after last week’s rally above 1.0003 resistance, suggesting recent rise from last week’s low at 0.9813 is still in progress and bullishness remains for this move to 1.0080, then towards previous resistance at 1.0109, however, loss of upward momentum should prevent sharp move beyond latter level and reckon 1.0140-50 would hold, risk from there has increased for a retreat to take place later.
In view of this, would not chase this rise here and would be prudent to buy dollar on pullback as support at 0.9948 should limit downside. Below 0.9925-30 would abort and signal top is formed instead, bring correction to 0.9905-10 but reckon previous resistance at 0.9869 would hold from here.
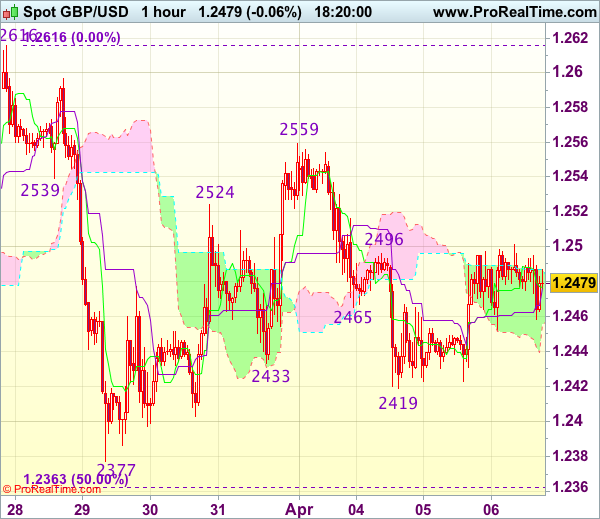
Trade Idea Update: GBP/USD – Hold short entered at 1.2465
GBP/USD - 1.2478
Original strategy :
Sold at 1.2465, Target: 1.2365, Stop: 1.2500
Position : - Short at 1.2465
Target : - 1.2365
Stop : - 1.2500
New strategy :
Hold short entered at 1.2465, Target: 1.2365, Stop: 1.2500
Position : - Short at 1.2465
Target : - 1.2365
Stop : - 1.2500
Cable’s rebound after holding above support at 1.2419 suggests further consolidation above this level would be seen, however, as long as indicated resistance at 1.2500 holds, mild downside bias remains for another fall, below said support at 1.2419 would bring test of 1.2400 but break there is needed to add credence to our view that the rebound from 1.2377 has ended at 1.2559, bring further fall towards support at 1.2377. Looking ahead, only a drop below 1.2377 would confirm the fall from 1.2616 is still in progress for subsequent decline towards key support at 1.2335.
In view of this, we are holding on to our short position entered at 1.2465 but one should exit on such decline. Only break of said resistance at 1.2500 would abort and suggest low has been formed instead, risk a stronger rebound to 1.2525-30, then towards resistance at 1.2559.
Trade Idea Update: EUR/USD – Sell at 1.0725
EUR/USD - 1.0663
Original strategy :
Sell at 1.0725, Target: 1.0610, Stop: 1.0760
Position : -
Target : -
Stop : -
New strategy :
Sell at 1.0725, Target: 1.0610, Stop: 1.0760
Position : -
Target : -
Stop : -
As the single currency has remained under pressure after recent selloff, bearishness remains for the decline from 1.0906 to extend further weakness to 1.0620, then test of previous chart support at 1.0600, however, a sustained breach below the latter level is needed to retain downside bias for subsequent selloff to 1.0570-75 first.
In view of this, would not chase this fall here and would be prudent to sell dollar on recovery as 1.0720-30 should limit upside. Only a firm break above resistance at 1.0773 would suggest low is formed instead, bring a stronger rebound to 1.0800 but resistance at 1.0827 should remain intact.