
Sample Category Title
Appetite To Risk Evaporated As Fed Signalled Double Tightening Whammy
Equities across Asia fell on Thursday following Wall Street's biggest one-day reversal in 14 months after the Fed minutes indicated that officials are ready to target the over bloated balance sheet.
The Japanese Yen led the gains in currency markets, touching its highest levels in more than four months against the dollar. Government bond yields dropped across the globe, and futures markets are indicating further declines in U.S. equities.
Yesterday's Fed minutes sent a couple of warning signs which have led to this reversal. The expected gradual increase in interest rates was not one of them given that this factor has already been priced in the markets. However, the discussions of reducing the balance sheet, currently at $4.5 trillion, wasn't received with open arms as it suggests a double tightening policy, “combination of higher rates and reduction in QE.” This is likely to be the next hot topic in monetary policy actions, and the key question is going to be; will the Fed successfully remove unconventional policies without disrupting the markets?
The more compelling message was related to equity valuations. Some Fed participants viewed equity prices as quite high relative to standard valuation measures. Well, there's nothing new here. Whoever is buying into this market already knows that valuations are overstretched, but this isn't the kind of message an investor wants to hear from the system which supported the 8-year bull market. We rarely receive such comments from monetary policy makers, and while it doesn't necessarily mean a correction is due immediately, investors should become more cautious.
The biggest one-day reversal in 14 years was significant enough to make headlines, but overall, markets still believe that Trump has their back, and whatever we're experiencing now is just some noise. However, in my opinion, valuations are not just high relative to standard measures, they are unrealistic. Earnings remain the key missing component of the most recent rally, and if we don't see a significant improvement in the next two-quarters, there's very little chances to keep going north.
Today's Xi-Trump meeting will attract all of the market's attention. Trump already assumes it willbe a “very difficult” meeting, criticizing the trade deficit with China and job losses. The discussions will focus on global, regional, and bilateral issues of mutual concern according to the White House, but traders' spotlight will be on the trade part. The best-case scenario is the meeting ends peacefully, with both presidents shaking hands and probably playing some golf. But given that the two men are at opposite sides on several issues, it is unlikelythe meeting will end in such a way. If they don'tget along and the US-China relationship becomes gloomy, expect another wave of risk aversion to hit the markets.
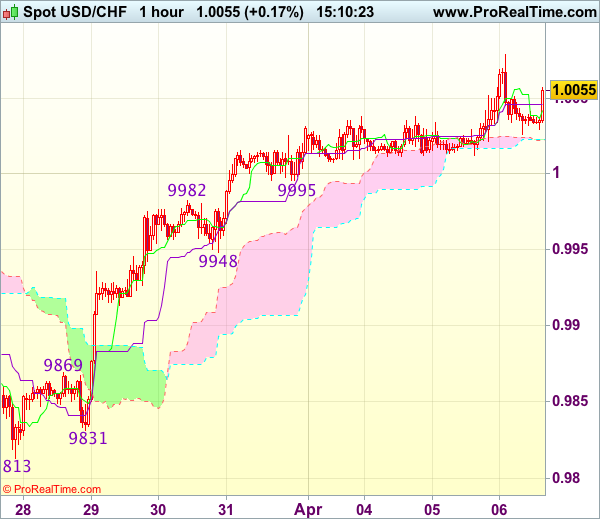
Trade Idea : USD/CHF – Buy at 0.9950
USD/CHF - 1.0063
Most recent candlesticks pattern : N/A
Trend : Near term up
Tenkan-Sen level : 1.0047
Kijun-Sen level : 1.0046
Ichimoku cloud top : 1.0023
Ichimoku cloud bottom : 1.0022
Original strategy :
Buy at 0.9950, Target: 1.0050, Stop: 0.9915
Position : -
Target : -
Stop : -
New strategy :
Buy at 0.9950, Target: 1.0050, Stop: 0.9915
Position : -
Target : -
Stop : -
As the greenback has maintained a firm undertone after last week’s rally above 1.0003 resistance, suggesting recent rise from last week’s low at 0.9813 is still in progress and bullishness remains for this move to 1.0080, then towards previous resistance at 1.0109, however, loss of upward momentum should prevent sharp move beyond latter level and reckon 1.0140-50 would hold, risk from there has increased for a retreat to take place later.
In view of this, would not chase this rise here and would be prudent to buy dollar on pullback as support at 0.9948 should limit downside. Below 0.9925-30 would abort and signal top is formed instead, bring correction to 0.9905-10 but reckon previous resistance at 0.9869 would hold from here.
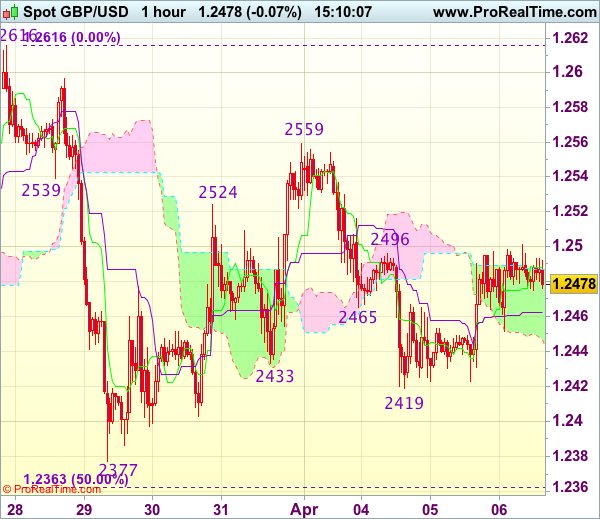
Trade Idea : GBP/USD – Hold short entered at 1.2465
GBP/USD - 1.2482
Most recent candlesticks pattern : N/A
Trend : Near term down
Tenkan-Sen level : 1.2487
Kijun-Sen level : 1.2462
Ichimoku cloud top : 1.2487
Ichimoku cloud bottom : 1.2447
Original strategy :
Sold at 1.2465, Target: 1.2365, Stop: 1.2500
Position : - Short at 1.2465
Target : - 1.2365
Stop : - 1.2500
New strategy :
Hold short entered at 1.2465, Target: 1.2365, Stop: 1.2500
Position : - Short at 1.2465
Target : - 1.2365
Stop : - 1.2500
Cable’s rebound after holding above support at 1.2419 suggests further consolidation above this level would be seen, however, as long as indicated resistance at 1.2500 holds, mild downside bias remains for another fall, below said support at 1.2419 would bring test of 1.2400 but break there is needed to add credence to our view that the rebound from 1.2377 has ended at 1.2559, bring further fall towards support at 1.2377. Looking ahead, only a drop below 1.2377 would confirm the fall from 1.2616 is still in progress for subsequent decline towards key support at 1.2335.
In view of this, we are holding on to our short position entered at 1.2465 but one should exit on such decline. Only break of said resistance at 1.2500 would abort and suggest low has been formed instead, risk a stronger rebound to 1.2525-30, then towards resistance at 1.2559.
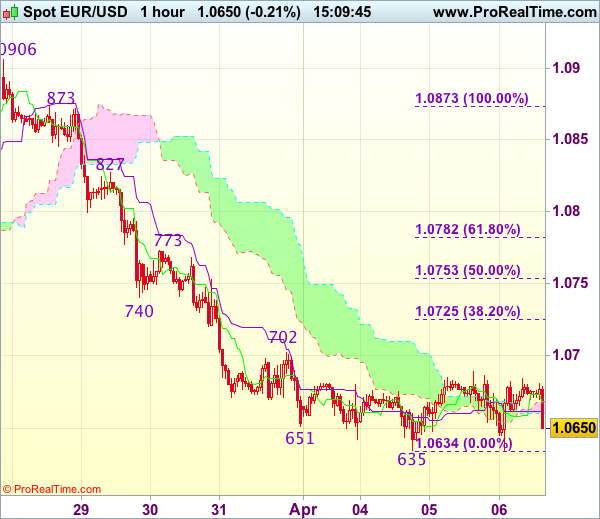
Trade Idea : EUR/USD – Sell at 1.0725
EUR/USD - 1.0647
Most recent candlesticks pattern : N/A
Trend : Near term down
Tenkan-Sen level : 1.0663
Kijun-Sen level : 1.0662
Ichimoku cloud top : 1.0668
Ichimoku cloud bottom : 1.0660
Original strategy :
Sell at 1.0730, Target: 1.0610, Stop: 1.0765
Position : -
Target : -
Stop : -
New strategy :
Sell at 1.0725, Target: 1.0610, Stop: 1.0760
Position : -
Target : -
Stop : -
As the single currency has remained under pressure after recent selloff, bearishness remains for the decline from 1.0906 to extend further weakness to 1.0620, then test of previous chart support at 1.0600, however, a sustained breach below the latter level is needed to retain downside bias for subsequent selloff to 1.0570-75 first.
In view of this, would not chase this fall here and would be prudent to sell dollar on recovery as 1.0720-30 should limit upside. Only a firm break above resistance at 1.0773 would suggest low is formed instead, bring a stronger rebound to 1.0800 but resistance at 1.0827 should remain intact.
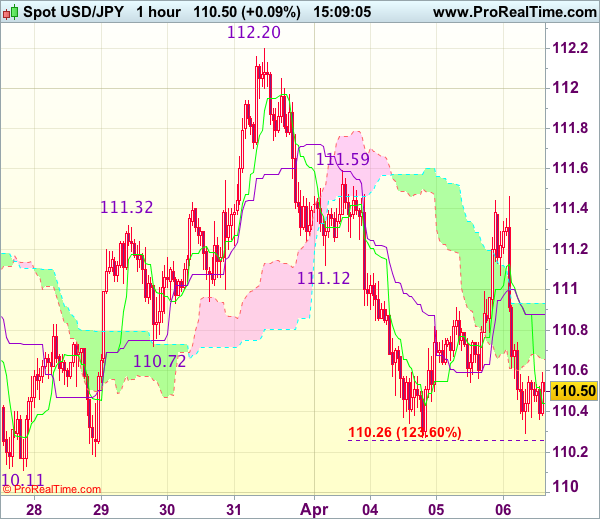
Trade Idea : USD/JPY – Sell at 111.00
USD/JPY - 110.47
Most recent candlesticks pattern : N/A
Trend : Near term down
Tenkan-Sen level : 110.44
Kijun-Sen level : 110.88
Ichimoku cloud top : 110.93
Ichimoku cloud bottom : 110.66
Original strategy :
Sell at 111.75, Target: 110.65, Stop: 112.10
Position : -
Target : -
Stop : -
New strategy :
Sell at 111.00, Target: 110.00, Stop: 111.35
Position : -
Target : -
Stop : -
As the greenback ran into renewed selling interest at 111.46 and has dropped sharply, retaining our bearishness for the decline from 112.20 top to resume after consolidation, below 110.27 (this week’s low) would confirm and extend the fall from 112.20 to last week’s low at 110.11. Looking ahead, break there is needed to retain downside bias and confirm medium term decline has resumed for further subsequent fall to 109.80-85 (1.618 times projection of 112.20-111.12 measuring from 111.59) which is likely to hold on first testing.
In view of this, would not chase this fall here and would be prudent to sell dollar on recovery as 111.00 should limit upside. Only above 111.46 resistance would abort and prolong choppy trading, risk rebound to 111.59, then towards 111.90-00 later but price should falter well below said resistance at 112.20.
EUR/GBP Candlesticks and Ichimoku Analysis
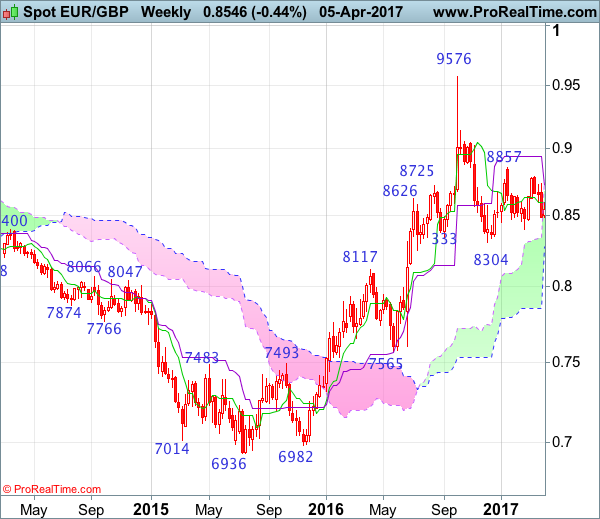
Weekly
• Last Candlesticks pattern: N/A
• ime of formation: N/A
• Trend bias: Near term up
Daily
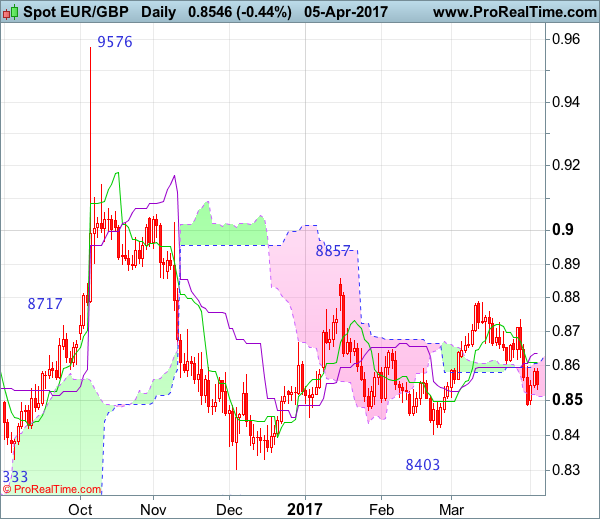
• Last Candlesticks pattern: Hammer
• Time of formation: 3 Feb 2016
• Trend bias: Up
EURGBP – 0.8643
The single currency ran into heavy offers at 0.8735 last week and has dropped sharply dampening our near term bullishness and suggest top has been formed at 0.8788 earlier last month, hence consolidation with mild downside bias is seen, break of last week’s low at 0.8485 would extend the fall from 0.8788 to 0.8445-50, however, reckon previous support at 0.8403 would hold on first testing due to near term oversold condition and price should stay well above support at 0.8332, risk from there is seen for a rebound later.
On the upside, whilst initial recovery to the Tenkan-Sen (now at 0.8610) cannot be ruled out, reckon the Kijun-Sen (now at 0.8637) would limit upside and bring another decline later. Above 0.8690-00 would bring another test of 0.8735 resistance but only break there would revive bullishness and signal the rise from 0.8403 is still in progress, bring further gain to 0.8810-15 but as broad outlook remains consolidative, reckon upside would be limited to previous resistance at 0.8857, risk from there is seen for a retreat to take place later. Only break of said resistance at 0.8857 would signal the rise from 0.8304 low is underway for headway to 0.8900, then towards 0.8940 (50% Fibonacci retracement of 0.9576-0.8304) which is likely to hold from here.
Recommendation: Stand aside for this week.
On the weekly chart, last week’s retreat formed a black candlestick, suggesting the rebound from 0.8403 has ended at 0.8788 last month, hence consolidation with mild downside bias is seen for further weakness to 0.8495-00, however, reckon 0.8460 would limit downside and said support at 0.8403 should hold, bring further sideways trading, Only a break of this support would revive bearishness and extend the fall from 0.8857 to 0.8350-55. Looking ahead, below there would signal decline from 0.9576 top has resumed for retest of 0.8304 but only break there would extend the fall from 0.9576 top for retracement of medium term upmove to previous support at 0.8251, then 0.8200.
On the upside, expect recovery to be limited to 0.8610-15 and the Kijun-Sen (now at 0.8723) should hold, bring another decline later. Only a break of resistance at 0.8735 would risk test of said resistance at 0.8788 which is likely to cap euro’s upside. In the event the single currency is able to penetrate said resistance at 0.8788, this would extend the rebound from 0.8403 towards said resistance at 0.8857. Looking ahead, only a break of this level would revive bullishness and extend the rise from 0.8304 to 0.8940 (50% Fibonacci retracement of 0.9576-0.8304 and current level of the Kijun-Sen) but price should falter below resistance at 0.9026.
EUR/CHF Candlesticks and Ichimoku Analysis
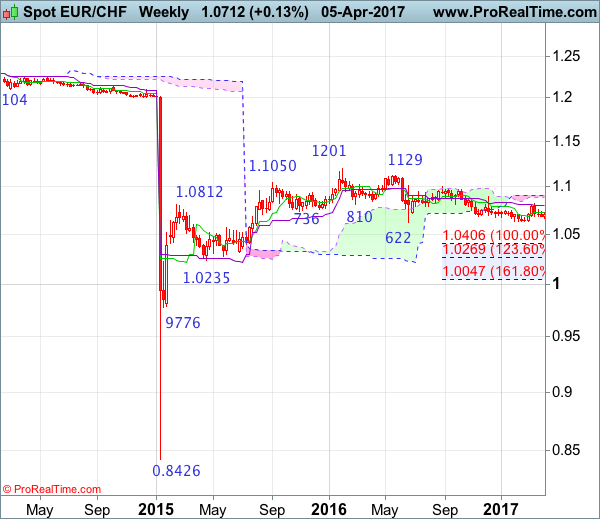
Weekly
• Last Candlesticks pattern: Doji
• Time of formation: 20 Feb 2017
• Trend bias: Up
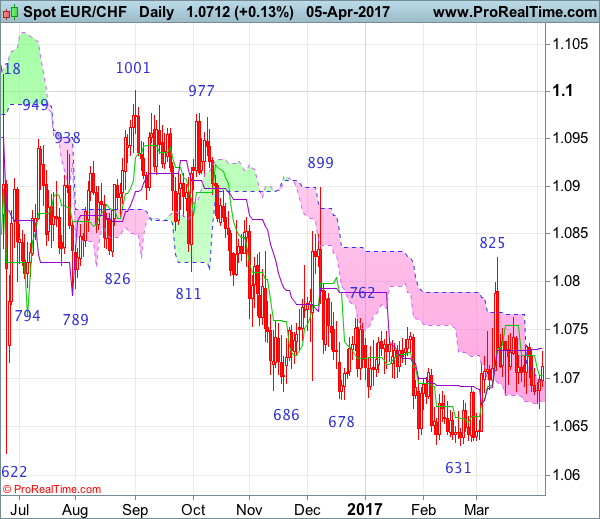
Daily
• Last Candlesticks pattern: Doji
• Time of formation: 1 Sep 2016
• Trend bias: Near term down
EUR/CHF – 1.0713
Although the single currency fell briefly to 1.0669 earlier this week, lack of follow through selling and current strong rebound suggest consolidation above this level would be seen and upside risk is seen for test of resistance at 1.0736, however, break of 1.0763 is needed to signal the retreat from 1.0825 (last month’s high) has ended, bring further gain to 1.0790-00 but said resistance at 1.0825 should remain intact. In the event euro is able to penetrated resistance at 1.0825, this would shift risk back to upside and signal low has been formed instead, bring further subsequent gain to 1.0850 and later towards key resistance at 1.0899 (Dec high).
On the downside, below said support at 1.0669 would revive bearishness and suggest the fall from 1.0825 is still in progress, bring further fall towards 1.0622-31, however, break of this level is needed to signal the decline from 1.1201 (2016 high) has resumed and extend further fall to 1.0590-00, then towards 1.0530-35 but loss of downward momentum should prevent sharp fall below 1.0500, price should stay well above 1.0400-10, risk from there has increased for a strong rebound to take place later.
Recommendation: Exit short entered at 1.0725 and stand aside for this week.
On the weekly chart, as the single currency found good support at 1.0669 and has rebounded, a white candlestick looks set to be formed this week, suggesting consolidation above this level would be seen and recovery to 1.0760-65 cannot be ruled out, however, reckon upside would be limited to 1.0825 resistance and bring further consolidation. Only a break of 1.085 would signal low has been formed at 1.0631, bring retracement of recent decline to 1.0850 but a break above indicated resistance at 1.0899 is needed to add credence to this view and bring a stronger rebound to 1.0970-75, then test of 1.1001. Looking ahead, only a sustained breach above 1.1001 would signal the fall from 1.1201 has ended, bring further gain to 1.1100 but reckon resistance at 1.1129 would hold on first testing.
On the downside, below 1.0669 would bring another test of indicated strong support at 1.0622-31, however, break there is needed to signal recent decline from 1.1201 top has resumed and extend further fall to 1.0550-55, then 1.0500-10 but oversold condition should prevent sharp fall below 1.0400-10 (100% projection of 1.1201-1.0622 measuring from 1.1001) and price should stay well above previous support at 1.0314, risk from there is seen for a rebound to take place later.
German Factory Orders For February Are Due Out
Market movers today
The ECB minutes from the March meeting will be scrutinised for any hints and discussions within the Governing Council of the ECB contemplating hiking rates before a termination of the QE programme. It is still our expectation that the ECB will not hike before the termination of the QE programme, which we expect to be extended into next year.
German factory orders for February are due out. Recent months have shown great volatility in factory orders, with the latest figure being a 7.2% monthly drop in January. We estimate a monthly increase of 4.2% following the weak January figure.
President Trump will start a two-day meeting with Chinese President Xi Jinping.
Selected market news
In the US, yesterday's FOMC minutes did not give us much new information in terms of the economic developments as the message of a central bank on track delivering one of the three signalled hikes in 2017 was reiterated. However, the Fed staff seems to have changed its risk assessment on the timing of fiscal easing from the Trump administration amid the Republican's failure to change Obamacare. Our base case remains that the Fed hikes in July and December and then three to four times next year, but this call is dependent on the speed and size of a possible balance sheet reduction (see next paragraph).
Meanwhile, the minutes gave us more insight into the discussion behind the Fed's balance sheet reduction. The minutes say that ‘a change to the Committee's reinvestment policy would likely be appropriate later this year'. We expect the Fed to begin shrinking its balance sheet in Q1 18 – consensus among both primary dealers and analysts is mid-2018 – but risk is skewed towards the end of this year. We think an announcement is likely in connection with the June meeting. The FOMC members still want quantitative tightening to be ‘conducted in a passive and predictable manner'. The participants also discussed whether the timing of quantitative tightening should be based on a quantitative threshold or on a qualitative judgement. Based on the minutes, ‘several' participants prefer the former while ‘some' prefer the latter meaning that quantitative tightening would likely depend on the Fed funds target range or the level of an economic variable (possibly the PCE inflation rate or the unemployment rate). We have written intensively on quantitative tightening recently. Rising demand for currency, change in US treasury cash balance policy and financial regulation limit the scope for a reduction of the balance sheet in our view. Risk is that quantitative tightening could lead to an unwarranted tightening of USD liquidity which adds a risk to our Fed rate call. On the data front in the US, the ADP labour market report of +263K job growth in March beat expectations suggesting some upside risk to the nonfarm payrolls release on Friday.
Yesterday's Norwegian house price statistics from Eiendom Norge revealed a March rise of 0.3% m/m s.a. bringing the yearly rate down from 13.0% to 11.7%. We note the yearly rate in Oslo dropped 1.6pp from a record high to 22.4% (see tweet). Overall, the release clearly showed signs of a cooler housing market, which is likely to be a reflection of not least a supply side adjustment and new regulatory initiatives introduced from the New Year now taking effect. While the national average has now dropped below Norges Bank's forecast for the first time in many months, we think it is important to highlight that Norges Bank already has a significant slowdown in house prices this year. So, the release reduces the probability of a rate hike rather than increasing that of a rate cut, in our view.
Market Update – Asian Session: Korea Tensions Escalate Going Into Trump-Xi Talks
US Session Highlights
(US) MAR ISM NON-MANUFACTURING COMPOSITE: 55.2 V 57.0E (lowest since Oct 2016); new orders 58.9 v 61.2 prior
(US) MAR ADP EMPLOYMENT CHANGE: +263K V +185KE
(US) DOE CRUDE: +1.6M V -0.5ME; GASOLINE: -0.6M V -1.5ME; DISTILLATE: -0.5M V -1ME
Stocks had a bumpy ride today, with a considerable amount of volatility. Major indices rose early in the morning after much stronger than expected ADP jobs data, but then began to fall in the afternoon once March FOMC minutes were released and Speaker Ryan said the road ahead for tax reform may be longer than healthcare. The Dow had rallied 142 points to reach a day high just short of 20,900, before retracing nearly 250 points, the biggest intraday reversal for the Dow and S&P in 14 months.
US markets on close: Dow -0.2%, S&P500 -0.3%, Nasdaq -0.6%
Best Sector in S&P500: Utilities
Worst Sector in S&P500: Financials
Biggest gainers: UA +3.0%; CRM +2.9%; SPLS +2.6%
Biggest losers: CHK -3.3%; BBBY -3.0%; SWN -2.9%
At the close: VIX 12.9 (+1.1pts); Treasuries: 2-yr 1.23% (-2bps), 10-yr 2.35% (flat), 30-yr 3.01% (+1bps)
US movers afterhours
YUMC: Reports Q1 $0.44 v $0.37e, R$1.28B v $1.29Be; +10.4% afterhours
KOPN: Enters into partnership agreements to meet coming demand for OLED micro-displays for virtual reality and augmented reality; +8.2% afterhours
JAZZ: Reaches settlement with Hikma Pharmaceuticals related to Xyrem patent litigation; +5.9% afterhours
MACK: Declares $140M special dividend in connection with recently completed asset sale; +5.1% afterhours
BBBY: Reports Q4 $1.84 v $1.77e, R$3.53B v $3.50Be; Guides initial FY17 EPS to decline low single digits to 10%, implies low end $4.12 v $4.56e; +3.8% afterhours
MDT: Cardinal Health said to be near $6B purchase of Medtronic medical supplies unit - press; +2.2% afterhours
RECN: Reports Q3 $0.09 v $0.14e, R$143.8M v $146Me; Adj EBITDA margin 5.8% v 8.9% y/y; -8.4% afterhours
SYNC: Files to sell shares of indeterminate amount through Canaccord and Needham; -10.7% afterhours
CAFD: Reports Q1 +$0.03 v -$0.18e, R$9.9M v $10.0Me; Guides Q2 R$14-16M v $16.2Me, adj EBITDA $24.0-26.5M; -11.4% afterhours
Politics
(US) President Trump: May include infrastructure in either healthcare or tax reform legislation - NYT
(US) House Majority Leader McCarthy: Highly confident of Obamacare repeal this year
Key economic data
(CN) CHINA MAR CAIXIN PMI SERVICES: 52.2 (6-month low and 3rd straight sequential decline) V 52.6 PRIOR, COMPOSITE PMI: 52.1 (6-month low) V 52.6 PRIOR
(HK) HONG KONG MAR COMPOSITE PMI: 49.9 V 49.6 PRIOR; 3rd straight contraction
(TW) TAIWAN MAR CPI Y/Y: 0.2% V 0.8%E; WPI Y/Y: 1.8% V 2.3%E
Asia Session Notable Observations, Speakers and Press
Asian equity indices are trending lower as risk aversion flows that struck sentiment in the 2nd half of the US trading session reverberate in Asia Pacific. Fed's meeting minutes were the perceived culprit behind the biggest bearish reversal in US stocks this year, with US central bank officials expressing concern over stretched valuations, questioning the timing of US fiscal stimulus being stretched out to 2018, and also signalling impending policy change of balance sheet adjustment as soon as this year. Worries about the "Trump trade" pro-business agenda were also on display as House Speaker Ryan said White House and Congress are still not on the same page in terms of tax reform. Later in the Asia session, NY Times reported that Pres Trump may try to push through his infrastructure package as part of a bundle with healthcare or tax reform. S&P futures continued to slide to 1-week lows, gold tested $1260, and Treasuries rallied.
Nikkei225 is again leading the decliners as USD/JPY fell over 40pips from the highs, while Shanghai Composite remains resilient on support from economic zone speculation. In other FX majors, AUD/USD is also notably lower on risk aversion and also softer China Caixin PMIs, sliding to 3-week lows below 0.7540. CNY weakened offshore on more reports that Pres Trump may alter Obama-era criteria on what it means to be a currency manipulator and avoid labeling China as such despite his strong campaign rhetoric on the issue.
North Korea overnight missile launch related tensions continued to simmer today, as South Korea official said he would discuss the matter with US and Japan. PM Abe reiterated that the launch was provocative, while a US commander in the region went as far as to state that economic measures against North Korea have not had expected results, with any possible pre-emptive attack against Pyongyang being the decision of US president Trump.
In economic data, China Caixin Services and Composite PMIs hit 6-month lows with both manufacturers and service providers noting slower expansions in output. Markit economists also noted weaker growth in composite new orders, weakest expansion of employment in 2017, flat work backlogs after 2 months of increases, and slowing input price inflation. Hong Kong composite PMI remained in contraction for 3rd straight month, though hit slightly higher levels thanks to first growth in output in 2 years and another increase in total input costs during March. Expectations for output over the next 12 months in Hong Kong however remain subdued amid economic downturn, political uncertainty, and higher housing rental costs.
Asia Development Bank releases its latest outlook report for the region, maintaining 5.7% target this year and next. China 2017 GDP view was raised to 6.5% from 6.4% before a 2018 slowdown to 6.2%. ADB noted risks of capital outflows due to US policy tightening.
China
(CN) China Housing Ministry calls for reasonable residential land supply - financial press
(CN) China will take more active measures to increase jobs - Chinese press
(CN) China SAFE: China FX market relatively stable, cross-border capital flow gradually tends to balance - Chinese press
(CN) Former PBoC advisor Li Yang: China should control housing loans - Chinese press
Japan
(JP) Japan PM Abe: Agreed with Trump that North Korea missile launch is provocative; interested in how Trump will talk about it China President Xi
Australia/New Zealand
(AU) Moody's: Home loan arrears are rising in all Australia states; expects delinquencies to continue to increase over 2017
(AU) Australia Treasurer Morrison: Economic growth is the starting point of 2017 budget
(AU) RBA's Debelle: Increase in mining profits, reflecting coal and iron ore price spikes, will partly go to foreign owners as dividends, increasing net income deficit
(AU) Australia govt said to see A$4B budget increase from higher iron ore and coal prices - Australian press
(NZ) China-New Zealand free trade talks to be held in Beijing on Apr 27th - press
(NZ) New Zealand Treasury reports 8-month Budget Surplus NZ$1.41B v NZ$498M expected
Korea
(KR) US Navy Pacific Commander: Diplomatic and economic measures against North Korea have not had expected results; Any preemptive attack is up to Pres Trump - - press
(KR) South Korea presidential candidate Ahn Cheol-soo: Korea’s next leader should continue to allow the US to install the Thaad missile-defense system
(KR) South Korea envoy to discuss North Korea missile with US and Japan - Korean press
Asian Equity Indices/Futures (00:00ET)
Nikkei -1.4%, Hang Seng -0.6%, Shanghai Composite +0.1%, ASX200 -0.6%, Kospi -0.5%
Equity Futures: S&P500 -0.2%; Nasdaq -0.3%, Dax flat, FTSE100 -0.2%
FX ranges/Commodities/Fixed Income (00:00ET)
EUR 1.0660-1.0685; JPY 110.30-110.75; AUD 0.7530-0.7575; NZD 0.6960-0.6985
June Gold +0.1% at 1,255/oz; May Crude Oil -0.5% at $50.91/brl; May Copper -0.2% at $2.67/lb
SLV iShares Silver Trust ETF daily holdings fall to 10,237 tonnes from 10,242 tonnes prior; 5th straight decline
(CN) PBOC SETS YUAN MID POINT AT 6.8930 V 6.8906 PRIOR
(CN) PBoC skips open market operations for 9th straight session; Drains CNY10B
(JP) Japan MoF sells ¥3.979T 3-month bills; avg yield -0.1431% v -0.1612% prior; bid-to-cover 4.44x v 5.30x prior
Asia equities notable movers
Australia
JBH.AU JB Hi-Fi +3.7% (Q3 result)
RIO.AU Rio Tinto -2.1% (income tax assessments)
ASX.AU ASX -3.2% (Credit Suisse trims FY17 earnings estimates)
EHE.AU Estia Health +3.7% (Sentinel has bought 4.988% stake and is exploring purchase of a controlling interest)
Japan
2678.JP Askul Corp +5.5% (discloses fire damage)
6502.JP Toshiba Corporation -0.4% (seeks additional aid)
3632.JP Gree Inc +2.7% (SMBC Nikko upgrades)
9984.JP Softbank Corp -1.3% (rework snapdeal plan)
6857.JP Advantest Corp +2.0% (Daiwa raises PT)
4565.JP Sosei Group Corp +5.1% (Heptares receives milestone payment)
4208.JP Ube Industries +0.8% (Jefferies upgrades)
Hong Kong
762.HK China Unicom -1.5% (mixed ownership reform)
1918.HK Sunac China Holdings +7.3% (quarterly result)
2238.HK Guangzhou Automobile Group -1.4% (March result)
813.HK Shimao Property +4.2% (Mar result)
576.HK Zhejiang Expressway -5.4% (to issue bond)
1970.HK IMAX China Holding -9.7% (investors’ divestment)
China
000709.CN Hebei Iron & Steel Co +10.1%, 600550.CN Baoding Tianwei Baobian Electric +10.0%, 000401.CN Tangshan Jidong Cement Co +10.0% (new special economic zone momentum)
Aussie Reverses Its Gains In The Morning Session
For the 24 hours to 23:00 GMT, the AUD rose 0.08% against the USD and closed at 0.7571.
LME Copper prices rose 1.5% or $84.0/MT to $5808.5/MT. Aluminium prices rose 1.2% or $24.0/MT to $1962.0/MT.
In the Asian session, at GMT0300, the pair is trading at 0.7536, with the AUD trading 0.46% lower against the USD from yesterday’s close.
Early morning data revealed that in China, Australia’s largest trading partner, the Caixin services PMI eased to a level of 52.2 in March, expanding at its weakest pace in six months and compared to a reading of 52.6 in the prior month.
The pair is expected to find support at 0.7515, and a fall through could take it to the next support level of 0.7494. The pair is expected to find its first resistance at 0.7572, and a rise through could take it to the next resistance level of 0.7608.
Going ahead, market participants will closely monitor Australia’s AiG performance of construction index for March, slated to release overnight.
The currency pair is trading below its 20 Hr and 50 Hr moving averages.
