
Sample Category Title
Elliott Wave View: EURJPY Continue Lower
Short term Elliott Wave view in EURJPY suggests that cycle from 3/12 peak (122.89) is unfolding as a double three Elliott wave structure where Minor wave W ended at 119.28 and Minor wave X ended at 120.45. Minor wave Y is in progress and the internal is unfolding also as a double three Elliott wave structure where Minute wave ((w)) ended at 117.38 and Minute wave ((x)) bounce is proposed complete at 118.78. Down from 118.78, if pair can see 1 more minor low, the decline can be defined as 5 waves impulse and the 5 waves move should complete Subminutte wave a, then it should bounce in Subminutte wave b to correct the cycle from 118.78 high before pair turns lower again. We don’t like buying the proposed bounce and expect sellers to appear once Subminutte wave b is complete in 3, 7, or 11 swing provided that pivot at 4/5 high (118.78) stays intact in the first degree.
EURJPY 1 hour Elliott Wave Chart
Foreign Exchange Market Commentary: EUR/USD, USD/JPY, GBP/USD, GOLD, WTI CRUDE, DJIA, FTSE 100, DAX
EUR/USD
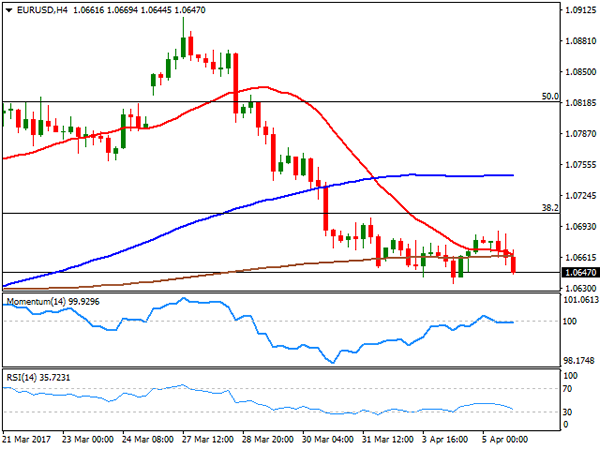
A re-surge in market's confidence on the US economy, following the release of a much better-than-expected ADP survey, pushed the greenback higher across the board, although majors held within familiar ranges. The EUR/USD pair fell down to 1.0634 and closed the day a couple of pips above it, with the common currency weighed by slightly worse-than-expected Markit Services PMIs for the EU. Despite growth in the sector for the whole region was confirmed near six-year highs, initial estimates for March were revised lower, with the index printing 56.0, down from the flash reading of 56.5. The composite PMI for the EU, ended up at 56.4 from 56.7.
The dollar gained traction after the ADP survey showed that the private sector added 263K jobs in March, beating expectations of 187K, although February reading was downwardly revised to 245K, still way above average. The final services PMIs in the US also suffered downward revisions, with the Markit index at 52.8 and the ISM Non-manufacturing PMI down to 55.2. These lasts, were barely enough to halt dollar's advance, albeit Wall Street kept rallying. FOMC Minutes released in the US afternoon, showed that the Fed favors a plan to start shrinking its balance sheet later this year, prompting the greenback initially higher across the board, although the movements were quickly reverted.
Market's reaction indicates that speculative interest is eagerly waiting for a reason to buy the greenback, at least against the EUR. Despite the pair was unable to leave its tight weekly range, the risk remains towards the downside, given that in the 4 hours chart, the price was unable to settle above a bearish 20 SMA, whilst the RSI indicator resumed its decline, now heading south around 35. The momentum indicator, however, remains attached to its 100 level, lacking directional strength. The key support is 1.0620 as the pair needs to break it to be able to extend its decline down to 1.0565.
Support levels: 1.0620 1.0590 1.0565
Resistance levels: 1.0675 1.0710 1.0745
USD/JPY
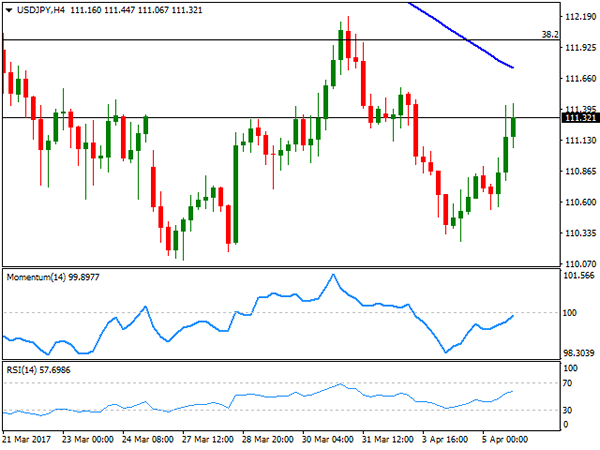
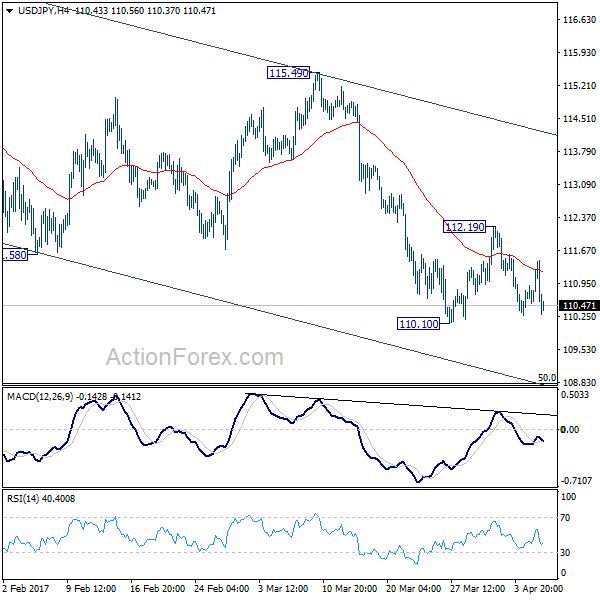
The USD/JPY pair trimmed most of its weekly losses and settled near its daily high of 111.44, with the yen easing amid improving market's mood. Asian shares advanced, following the lead of Wall Street, and following improved Japanese data as the Nikkei PMI surged to 52.9 in March its highest in almost two years. The manufacturing PMI also showed expansion in the month, printing 52.4, indicating firm demand for goods and services. The pair jumped to the mentioned high following the release of the US ADP survey, spending the rest of the day consolidating nearby. Nevertheless, and from a technical point of view, the upward potential remains limited according to technical readings in the 4 hours chart, as the intraday advance stalled well below a bearish 100 SMA, whilst the Momentum indicator was unable to recover above its 100 level, as the RSI indicator lost upward strength around neutral levels. The pair has an immediate resistance at 111.60, and a stronger one around 112.00, this last expected to cap advances on Thursday ahead of Friday's NFP release.
Support levels: 110.95 110.50 110.10
Resistance levels: 111.60 112.00 112.50
GBP/USD
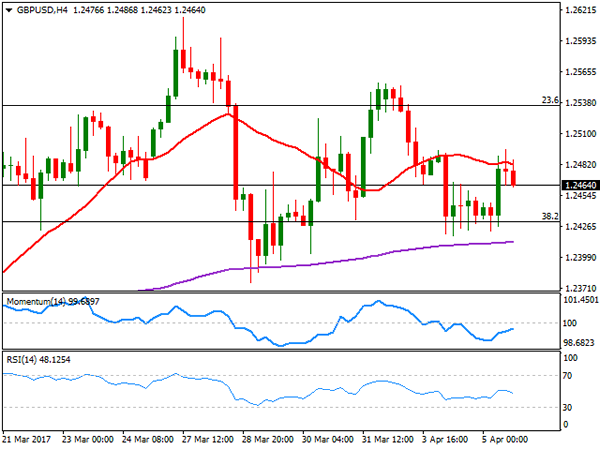
The GBP/USD pair topped at 1.2496, with the Pound attracting intraday buying interest after the release of a better-than-expected services PMI for March, as the Markit index printed 55.0, up from 53.3 in February. The pair, however, was unable to regain the 1.2500 level, retreating from the mentioned high after the release of the US ADP report, to settle around 1.2460. The UK macroeconomic calendar has nothing to offer this Thursday, although things will get more interesting on Friday with fresh data including manufacturing and industrial production, the trade balance and the NIESR GDP estimate. From a technical point of view, the pair maintains a neutral-to-bearish bias, as in the 4 hours chart, the pair was unable to surpass a horizontal 20 SMA around 1.2490, while technical indicators hold within bearish territory, but with no clear directional strength. The same chart shows that the pair bottomed multiple times over the last few days in the 1.2420/30 region, confirming that a break below 1.2410 is required for a downward extension that can extend down to 1.2330.
Support levels: 1.2450 1.2410 1.2370
Resistance levels: 1.2490 1.2540 1.2585
GOLD
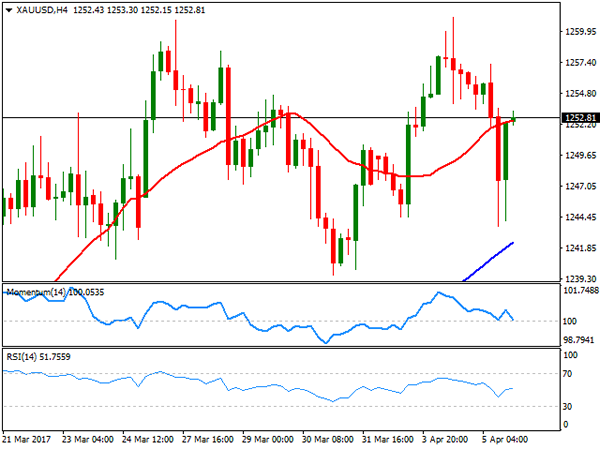
Gold prices traded in the red for most of the day, on improving risk sentiment following Wall Street's Tuesday advance. Spot traded as low as $1,243.67 a troy ounce, but bounced back in the US afternoon and settled around 1,252.40, buoyed on bargain hunting after the commodity tested a major technical support. The bright metal gained, in spite of a stronger dollar, confirming that speculative interest is bullish on the metal. The daily chart, shows that the price bounced sharply after testing the 200 DMA, whilst a bullish 20 SMA stands right below the largest. Technical indicators in the mentioned time frame within positive territory, reflecting the inability of the commodity to break higher rather than suggesting downward exhaustion. In the 4 hours chart, the price settled a few cents above its 20 SMA, while the intraday decline stalled above a sharply bullish 20 SMA. In the same chart, technical indicators hold within positive territory, but with no clear directional strength, as the RSI lost upward strength around 53, whilst the Momentum indicator heads lower right above 100.
Support levels: 1,249.45 1.243.60 0 1,230.00
Resistance levels: 1,258.30 1,263.80 1,272.80
WTI CRUDE
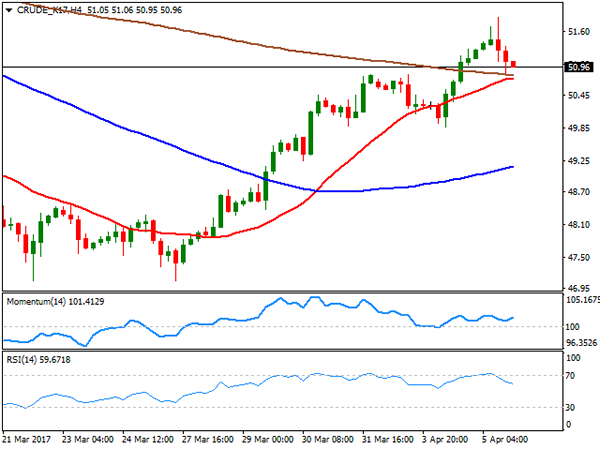
West Texas Intermediate crude oil futures rallied up to $51.86 a barrel backed by the American Petroleum Institute report released late Tuesday, that showed that crude inventories fell by 1.3 million barrels in the week ending March 31st. The commodity however, pulled back and settled around $50.96 a barrel, as the EIA weekly report showed an unexpected build of 1.6 million barrels, denting hopes of a balanced market. Daily basis, the index is midway between bullish 100 and 200 SMAs with the shortest capping the upside around 52.20, and with technical indicators having lost directional strength, but holding within positive territory. Shorter term, the 4 hours chart shows that the price pulled back to its 20 and 200 SMAs, both converging at 50.80, while the Momentum indicator is aiming to bounce from its 100 level and the RSI turned south around 58. The decline could accelerate on a break below 50.80, but it will take a slide below 49.90 to confirm further declines ahead.
Support levels: 50.80 50.30 49.90
Resistance levels: 51.65 52.20 52.90
DJIA
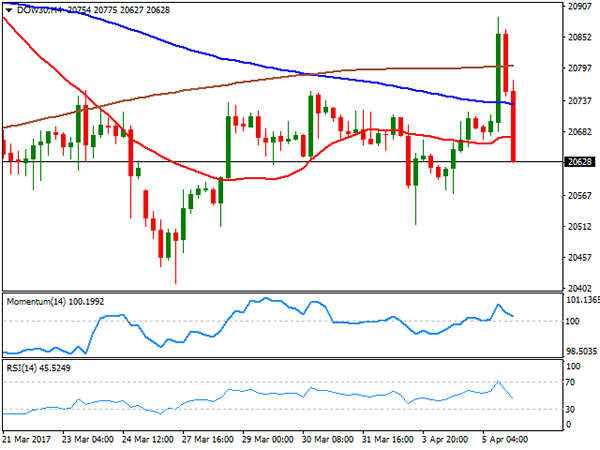
Wall Street opened with a strong tone, with the DJIA posting a three-digit gain before the release of FOMC Minutes. Indexes suffered a sharp reversal afterwards, as the minutes showed that most officials backed a policy change that would begin shrinking the central bank’s $4.5 trillion balance sheet later this year, seen by analyst as an option to rising rates. Furthermore, the document showed that some officials expressed their concerns about equity prices being "quite high." The Dow Jones Industrial Average shed 41 points, and settled at 20,648.15, while the Nasdaq Composite lost 0.58%, to 5,864.48. The S&P closed at 2,352.95, down by 7 points. Most members were down within the Dow, with Cisco Systems being the worst performer, down 1.17%, followed by JPMorgan Chase that shed 1.15%. The best performer was El du Pont that managed to gain 0.84%. The daily chart shows that the index failed to sustain gains beyond a bullish 20 DMA, ending the day below it, whilst technical indicators head lower within negative territory, aiming for fresh weekly lows. In the 4 hours chart, the index settled above all of its moving averages that anyway continue to lack directional strength, whist technical indicators turned sharply lower, with the RSI currently at 46, anticipating some additional declines ahead.
Support levels: 20,616 20,562 20,515
Resistance levels: 20,705 20,751 20,790
FTSE 100
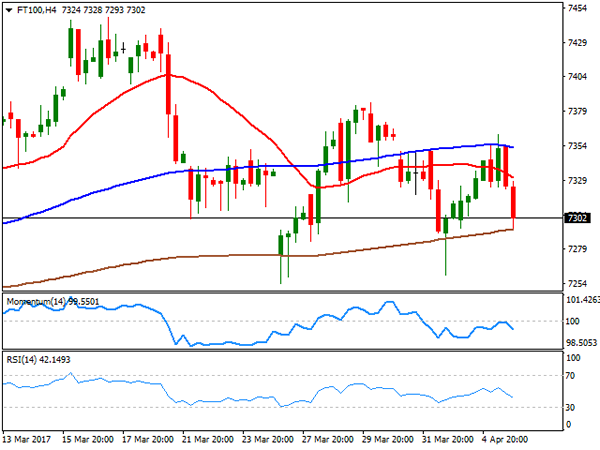
The FTSE 100 added roughly 10 points and settled at 7,331.68, lifted by an advance and mining and energy-related equities, as oil surged to a fresh 1-month high during the London session. The biggest gainer was Whitbread up 2.95%, while BHP Billiton added 1.75% and Antofagasta gained 1.55%. The biggest loser was insurer Old Mutual D down 4.38%, followed by Croda International that shed 3.6% after it received a downgrade from Credit Suisse. The index is currently trading a couple of points below 7,300, and the daily chart shows that an early advance was rejected by selling interest aligned around its 20 DMA , whilst technical indicators head further lower within negative territory, pointing for a continued decline. In the 4 hours chart, the index faltered around its 100 SMA, and now pressures the 200 SMA, whilst technical indicators retreated from their mid-lines, maintaining their bearish slopes into the Asian opening, in line with the longer term perspective.
Support levels: 7,294 7,254 7,210
Resistance levels: 7,349 7,387 7,415
DAX
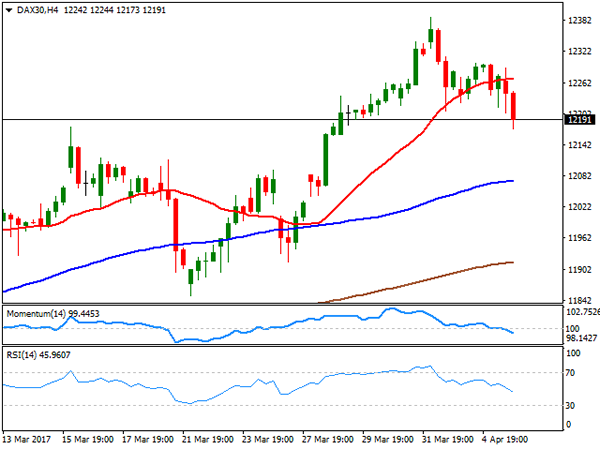
The German DAX closed the day at 12,217.54, down 64 points or 0.53%, with major European indexes ending the day mixed. The German benchmark was dragged lower by automakers, as the sector was the worst performer. Continental topped losers' list down by 1.63%, followed by Daimler AG that shed 1.49%. Banks were the best performers after optimism returned, with Commerzbank adding 2.21% and Deutsche Bank ending the day 0.67% higher. The index fell further in after-hours trading, holding around 12,180 ahead of the Asian opening, as Wall Street suffered a sudden u-turn after in the last hour of trading on following the release of FOMC Minutes. The daily chart shows that the technical indicators gained downward momentum, still holding within positive territory, whilst a bullish 20 DMA offers a critical support at 12,094 now. In the 4 hours chart, the index broke below its 20 SMA for the first time in a week, with the moving average now horizontal, and technical indicators heading sharply lower within negative territory, supporting additional declines ahead.
Support levels: 12,137 12,096 12,052
Resistance levels: 12,206 12,245 12,290
USD/JPY Daily Outlook
Daily Pivots: (S1) 110.33; (P) 110.89; (R1) 111.25; More....
Intraday bias in USD/JPY remains neutral as consolidation continues between 110.10/112.19. On the downside, break of 110.10 will resume the whole corrective decline from 118.65 and target 50% retracement of 98.97 to 118.65 at 108.81. On the upside, however, break of 112.19 resistance will indicate short term reversal and turn bias back to the upside for 115.49 resistance.
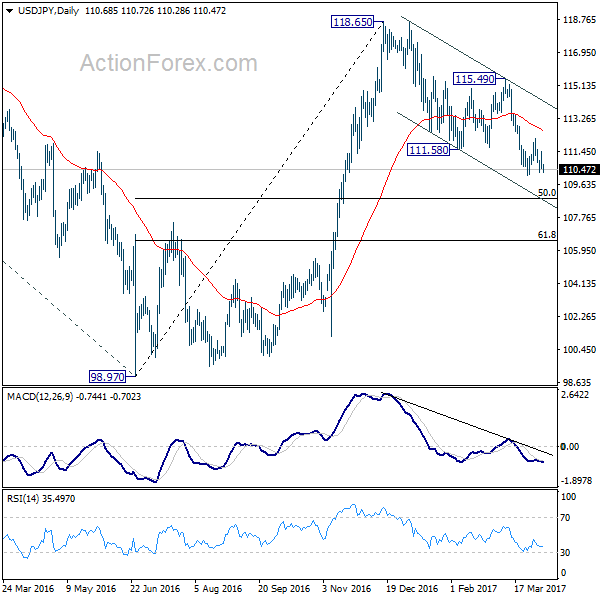
In the bigger picture, price actions from 125.85 high are seen as a corrective pattern. The impulsive structure of the rise from 98.97 suggests that the correction is completed and larger up trend is resuming. Decisive break of 125.85 will confirm and target 61.8% projection of 75.56 to 125.85 from 98.97 at 130.04 and then 135.20 long term resistance. Nonetheless, sustained trading below 55 week EMA (now at 111.16) will extend the consolidation from 125.85 with another fall through 98.97 before completion.
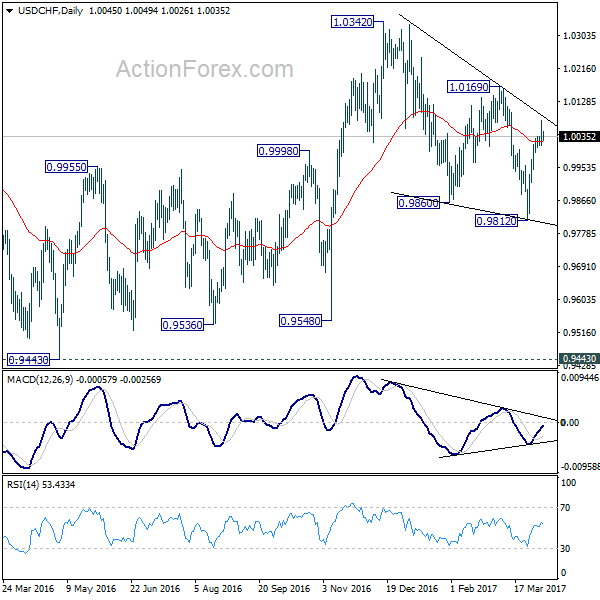
USD/CHF Daily Outlook
Daily Pivots: (S1) 1.0011; (P) 1.0044; (R1) 1.0081; More.....
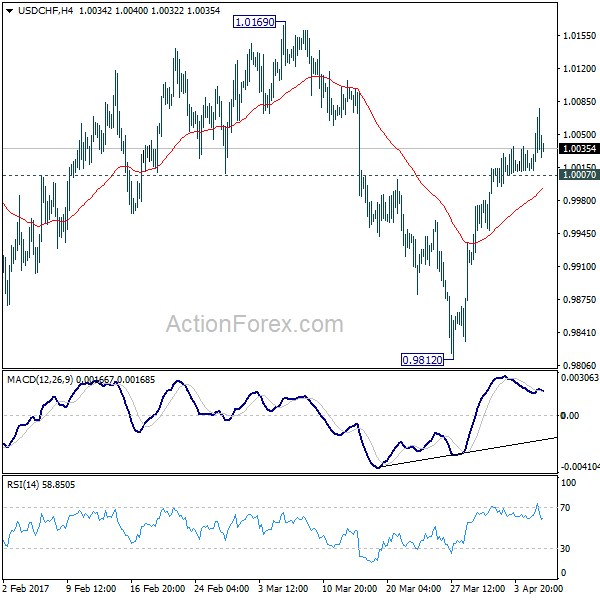
With 1.0007 minor support intact, intraday bias remains on the upside. Rise from 0.9812 should target 1.0169 resistance first. As noted before, corrective decline fall from 1.0342 should have finished with three waves down to 0.9812 already. Break of 1.0169 should confirm this bullish case and target a test on 1.0342 high. On the downside, below 1.0007 minor support will turn bias neutral and bring retreat before staging another rally.
In the bigger picture, USD/CHF is staying in medium term sideway pattern between 0.9443/1.0342. In any case, decisive break of 1.0342 resistance is needed to confirm underlying strength. Otherwise, we'll stay neutral in the pair first. In case of another fall, we'd expect strong support from 0.9443/9548 support zone.
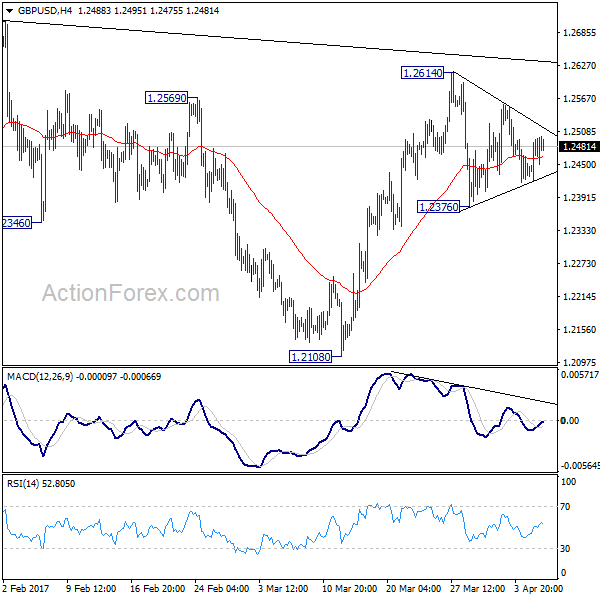
GBP/USD Daily Outlook
Daily Pivots: (S1) 1.2438; (P) 1.2468; (R1) 1.2514; More...
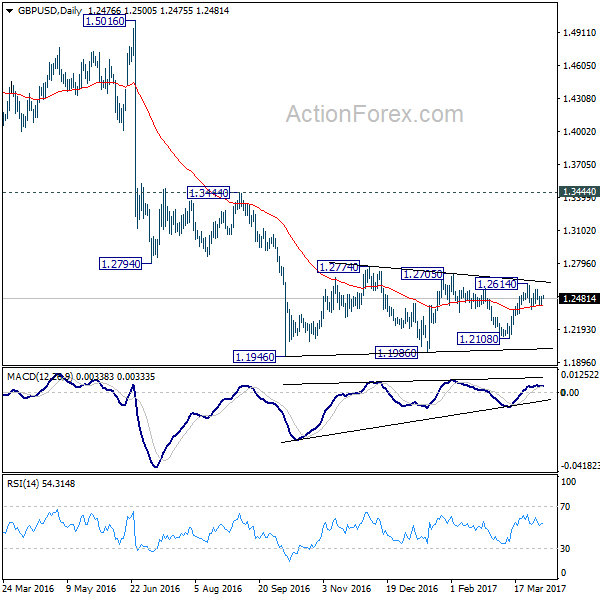
Intraday bias in GBP/USD stays neutral as range trading continues inside 1.2376/2614. Overall, price actions from 1.1946 are viewed as a consolidation pattern pattern. On the downside, break of 1.2376 will turn bias to the downside for 1.2108 support. Decisive break there will be an early sign of larger down trend resumption. On the upside, break of 1.2614 will extend the rise from 1.2108. But upside should be limited by 1.2705/2774 resistance zone to bring larger down trend resumption eventually.
In the bigger picture, fall from 1.7190 is seen as part of the down trend from 2.1161. There is no sign of medium term reversal yet. Sustained trading below 61.8% projection of 2.1161 to 1.3503 from 1.7190 at 1.2457 will target 100% projection at 0.9532. Overall, break of 1.3444 resistance is needed to confirm medium term bottoming. Otherwise, outlook will remain bearish.
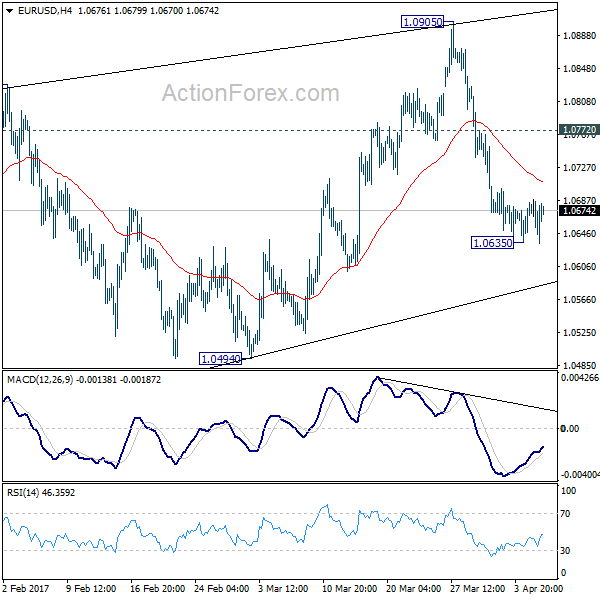
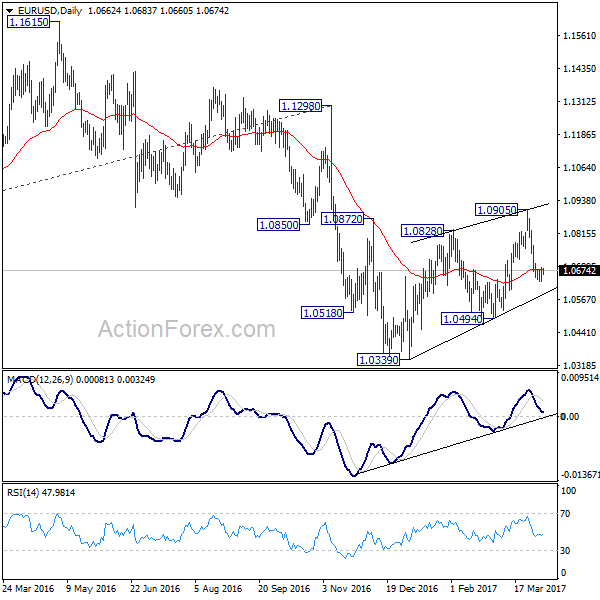
EUR/USD Daily Outlook
Daily Pivots: (S1) 1.0635; (P) 1.0662 (R1) 1.0690; More....
EUR/USD is staying in consolidation from 1.0635 temporary low and intraday bias remains neutral. Stronger recovery cannot be ruled out but upside should be limited by 1.0772 resistance and bring another fall. As noted before, corrective rise from 1.0339 is completed at 1.0905. And more importantly, larger down trend is probably resuming. Below 1.0635 will turn bias back to the downside for 1.0494. Break will confirm this bearish case and target 1.0339 low. However, above 1.0772 will delay this bearish case and bring another rise back to 1.0905 first.
In the bigger picture, as long as 1.1298 key resistance holds, whole down trend from 1.6039 (2008 high) is still expected to continue. Break of 1.0339 low will send EUR/USD through parity to 61.8% projection of 1.3993 to 1.0461 from 1.1298 at 0.9115. However, considering bullish convergence condition in weekly MACD, break of 1.1298 will indicate term reversal. this would also be supported by sustained trading above 55 week EMA.
Market Morning Briefing: The Fed Minutes Didn’t Have Any Impact
STOCKS
Minutes from the FED yesterday aided to losses on the US stocks. The unwinding of the $4.5 trln balance sheet indicated in the minutes may lead to more rate hikes this year. Sharp rise seen in Shanghai today while Nikkei seems to have set out on making fresh 4-month lows in the near term.
Dow (20648.15, -0.20%) rose to 20887 yesterday before coming off to close at 20648. As mentioned yesterday, it is trying to move above 20800 but is possibly unable to sustain at those levels. Broadly we may look at the 20980-20400 region to hold in the near term A break on either side would be crucial to decide on further direction. For now some sideways movement is expected.
Dax (12217.54, -0.53%) is trading just above immediate support near 12200. In case that holds, we may see a bounce back towards 12400-12500 levels else a further dip to 12100-12050 is possible before a bounce is seen. Note the resistance on the 3-day candle is holding well for now and indicates a sharp dip in the near term.
Nikkei (18597.51, -1.40%) has shown its very first break out on the downside from its broad sideways consolidation since Dec'16. The 4-month long sideways consolidation seems to have initiated a resolution on the downside by breaking the crucial support near 18650/18600 levels. In case the index sustains below 18600, we could see a fall towards 18200 in the coming sessions. We need to wait and watch for more confirmation.
Shanghai (3276.99, +0.20%) rose sharply nearing immediate resistance near 3300. It could come off from 3300 in the near term.
Nifty (9265.15, +0.30%) is rising as expected and could test 9280-9300 in the coming sessions.
COMMODITIES
Nothing new to add. Gold (1253) and Silver (18.27) are going nowhere as they keep trading in the narrow range of 1237-1263 and 17.94-18.50 respectively, which may continue for some days. Global cues are in favor of gold and silver too as the break below 99.70 for Dollar Index (100.37) could be resulted in good gains for bullion. We have been expecting 1237 for gold and 17.90 for silver to hold for now and gradual buying at lower levels can't be ruled as buyers are taking every dip as a further opportunity for buying.
Copper (2.66) found support at 2.65 levels in the near term. While 2.65 hold, a bounce to the interim resistance 2.70-72 can be seen. Only above 2.70-72, higher resistances of 2.80 can come into consideration. In the medium term 2.55-57 are going to be a strong support now and the chances of a close above 2.70 have increased.
According to EIA, U.S. weekly crude inventory rose by 1.6M barrels and as a result Brent (52.82) and WTI (50.86) has fallen from their resistance levels of 53.45 and 51.70 respectively. The trend is bearish in the near to medium term time frame. Any corrective bounce may face selling pressure at the higher levels. Increase in U.S. oil inventories is raising a concern whether the United States will remain the world's biggest oil importer, which is a price supporting indicator, or if its soaring production and bloated stocks lead to lower imports and trigger shipments to the rest of the world, which would weigh on oil markets.
FOREX
The Fed minutes didn't have any impact in the markets as Dollar continues its rest mode. The Indian markets may move after the RBI meet conclusion today, though no change in rates is expected. Need to see what the central bank says about liquidity and inflation outlook.
Dollar Index (100.50) has been closing exactly at the day's opening level for the last 4 sessions which indicate total indecision but the lack of selling pressure at the higher levels may push it higher towards 101.00-35 in the next few days.
Euro (1.0671) is in a consolidation mode after the sharp decline last week but the near downtrend may resume next week for the target of 1.0600-0580.
The downside resolution of Nikkei (18597.51, -1.40%) from its 4-month range (Check Equities section) indicates further possible weakness for Dollar-Yen (110.50) but the pair is still holding above our support of 110.10-109.90. These conflicting signals suggest wait and watch for 1-2 sessions though the major trend remains down.
Pound (1.2477) is forming Triangle pattern in the near term, signaling a major expansion of volatility coming by the end of the next week but for a significant trending move, a breakout from the range of 1.2350-1.2600 is required.
Aussie (0.7541) has now achieved our target of 0.7530 and as discussed yesterday, may bounce towards 0.7650-80 in the coming days if 0.7530-00 holds.
Our Resistance at 65.20 mentioned yesterday morning has held well and Dollar-Rupee (64.87) has indeed dipped below 65.00 again and has chances of falling further towards 64.80. Should that break, then levels of 64.60-40 would come into focus.
INTEREST RATES
The FED minutes released yesterday indicated that the officials want to start unwinding the central bank's massive $4.5 trillion balance sheet this year. This could possibly indicate some more rate hike on its way this year. The current probability of a 75bps rate hike in the 3rd May policy meet is at 96%. The US yields have dipped slightly but while the immediate support below current levels hold, we could see a bounce in the near term.
The US-Japan 10Yr (2.27%) is an a crucial point trading just near the previous low seen in end-Feb. If that holds and is able to produce a bounce, it could prevent further fall in Dollar-Yen and Nikkei but in case it breaks on the downside, we will have to look at further downside levels. Wait and watch for more confirmation.
The 10YR GOI (6.8724%) is holding above immediate support near 6.83% and while that holds, we could possibly see a rise back towards 7% in the near term. In that case some weakness in the Rupee could be expected in the near term.
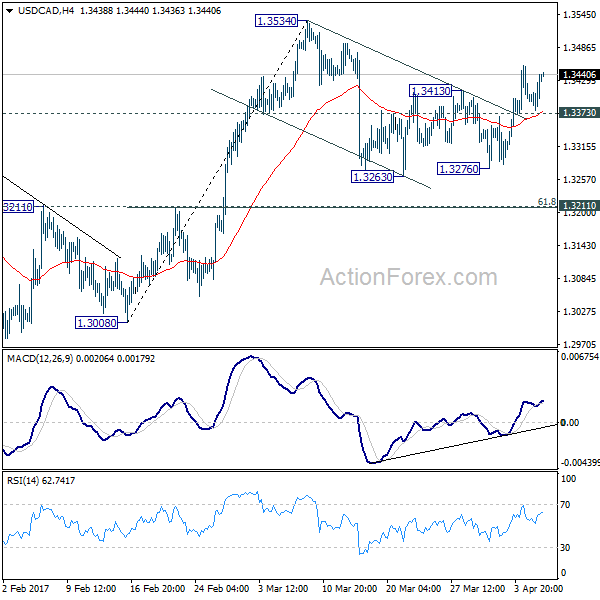
USD/CAD Daily Outlook
Daily Pivots: (S1) 1.3397; (P) 1.3418; (R1) 1.3459; More....
With 1.3373 minor support intact, intraday bias in USD/CAD remains on the upside for 1.3534 resistance. Break will extend whole rise from 1.2698 to 1.3598 resistance. On the downside, below 1.3373 minor support will turn bias back to the downside and could extend the correction from 1.3534 with another fall. But we'd expect strong support from 1.3211 cluster level (61.8% retracement of 1.3008 to 1.3534 at 1.3209) to contain downside and bring rebound. Overall, medium term rebound form 1.2460 is still expected to extend through 1.3598.
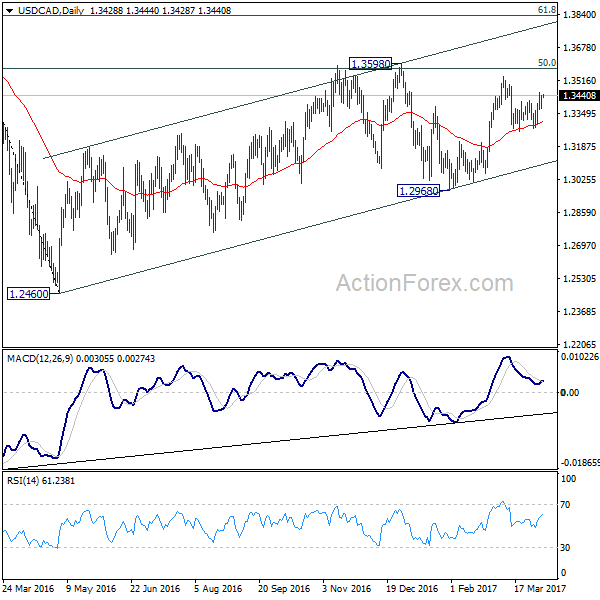
In the bigger picture, price actions from 1.4689 medium term top are seen as a correction pattern. The first leg has completed at 1.2460. The second leg from 1.2460 is likely still in progress and could target 61.8% retracement of 1.4689 to 1.2460 at 1.3838. We'd look for reversal signal there to start the third leg. Break of 1.2968 will argue that the third leg has already started and should at least bring at retest of 1.2460 low. However, sustained trading above 1.3838 would pave the way to retest 1.4689 high.
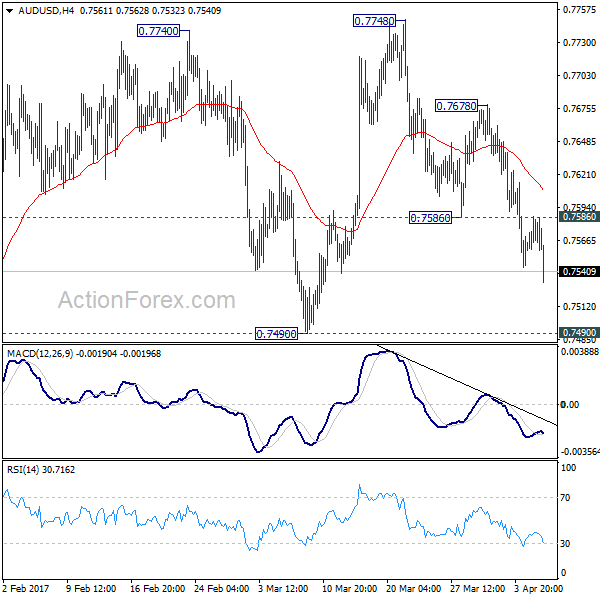
AUD/USD Daily Outlook
Daily Pivots: (S1) 0.7554; (P) 0.7570; (R1) 0.7584; More...
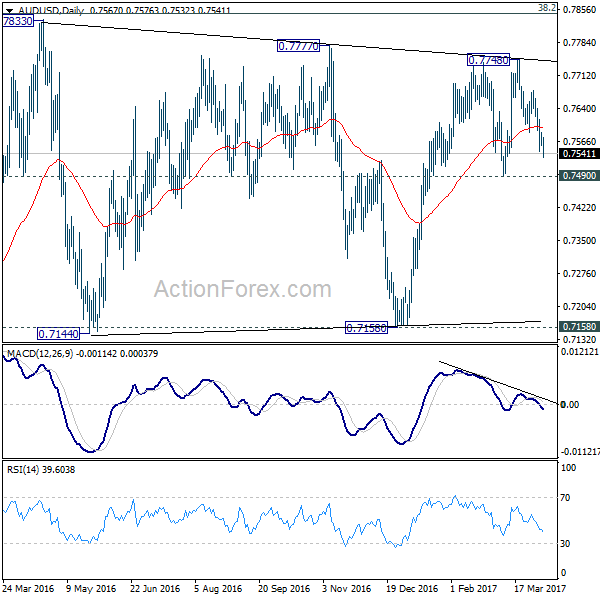
AUD/USD's fall from 0.7748 continues today and reaches as low as 0.7532 so far. Intraday bias remains on downside for 0.7490 support. Decisive break of 0.7490 will confirm completion of rise from 0.7158. In such case, near term outlook will be turned bearish for 0.7158 support. On the upside, above 0.7586 minor resistance will turn bias neutral first. And, break of 0.7678 minor resistance will turn bias back to the upside and could extend the rise fro 0.7158 through 0.7748 resistance.
In the bigger picture, we're still treating price actions from 0.6826 low as a correction. And, as long as 38.2% retracement of 0.9504 to 0.6826 at 0.7849 holds, long term down trend from 1.1079 is expected to resume sooner or later. Break of 0.6826 low will target 0.6008 key support level. However, firm break of 0.7849 will indicate that rise from 0.6826 is developing into a medium term rebound, rather than a sideway pattern. In such case, stronger rise should be seen to 55 month EMA (now at 0.8165) and above.
Dow Reversed as Markets Lose Confidence on Trump’s Tax Reform, Japanese Yen Picks Up Strength
The tones in the financial markets remain unchanged for the week. US equities attempted for a rally overnight. DJIA surged initially on strong US ADP employment and reached as high as 20887.50. But the index then reversed to close down -0.20%, or -41.09 pts, at 20648.15. The hawkish FOMC minutes are seen as a factor weighing on sentiments. But more importantly, House speaker Paul Ryan's comments on tax reform further reduced market confidence on US President Donald Trump's ability to implement what he promised. 10 year yield closed mildly higher by -0.007 at 2.357 but it's kept in tight range well below 55 day EMA. In the currency markets, Japanese yen strengthens again on risk aversion is remains the strongest major currency for the week. Commodity currencies are suffering renewed selling in Asian session. Dollar and Euro are trading mixed.
FOMC Minutes: Shrinking of balance sheet to start later this year
The minutes of the March FOMC meeting was overall hawkish. They outlined the steps to shrink the USD 4.5T balance sheet. The minutes noted that the reduction has to be "gradual and predictable", accomplished by "phasing out" or reinvestment and such process could start "later this year". No detail is provided yet but the minutes said Fed will "its deliberations on reinvestment policy during upcoming meetings and would release additional information as it becomes available." Meanwhile, some officials are concerned that if unemployment falls further, it could pose "significant upside risk" of inflation. The minutes also showed "some participants viewed equity prices as quite high relative to standard valuation measures."
More on FOMC Minutes:
- FOMC Might Begin Shrinking Balance Sheet In Late-2017
- FOMC Mintues: Beginning the Long Process of Fed Balance Sheet Normalization Later This Year
- FOMC Minutes Go Against Dovish Interpretation of March's Meeting
House Speaker Ryan: Tax reforms takes longer than health care
The two day meeting of US President Donald Trump and China President Xi Jinping will start today. It's a closely watched event but we're not anticipating anything substantial to the markets coming out of the meeting. Again, we'd like to emphasize that direction stocks, yields, and Dollar will be heavily dependent on the confidence on Trump to deliver his election promises on fiscal policies. Such confidence was hurt much after the health care act flop. Now that hope is turned to tax reforms, House speaker Paul Ryan said yesterday that tax reform will take longer to accomplish than the health care act. He noted that "the House has a (tax reform) plan but the Senate doesn't quite have one yet. They're working on one. The White House hasn't nailed it down." And, "so even the three entities aren't on the same page yet on tax reform."
BoE Vliegh: Better late than premature
BoE policy maker Gertjan Vliegh warned that "a rate hike that turns out to be premature is a more serious mistake than one that turns out to be somewhat late." He explained that if "inflationary pressures are spreading beyond just exchange-rate pass-through", or there is "re-acceleration of indicators related to household spending and credit", then higher interest rate is warranted. But for now, "caution is warranted." Sterling has been resilient since Kristin Forbes voted for a rate hike last month. And it remains supported in spite of Brexit news since then.
EU Parliament: No parallel approach in Brexit negotiation
Talking about Brexit, the European Parliament voted 516-133, with 50 abstentions, for the phased approach of Brexit negotiation, rather than parallel. European Union chief negotiator Michel Barnier said yesterday that "parallel talks" on Brexit terms and future trade relationship is "a very risky approach". And, he emphasized that to succeed, "we need on the contrary to devote the first phase of negotiations exclusively to reaching an agreement on the principles of the exit."
BoJ Kuroda favorite to get second term
In Japan, it's reported that BoJ Governor Haruhiko Kuroda is Prime Minister Shinzo Abe's favorite for the job. And Kuroda will likely renew for another five year term next year. Reuters quoted unnamed source saying that Abe trusts Kuroda and believed he did a "very good job". Also, the it's believed that Abe's administration is happy with impact of BoJ's QQE program that keep government borrowing costs very low. The selection process for the next BoJ Governor will start in the second half of this year.
Separately, a former BoJ official Kazuo Momma said that the central bank will likely revise down inflation forecast soon, possibly as early as during the quarterly review this month. Momma noted that the BoJ's price forecasts are "too optimistic". Meanwhile, it's "hard to raise interest rates when you're cutting your inflation forecasts." Momma expects core inflation hover around 0.5% in the current fiscal year, and jump to 1.0% next. That's sharply lower than BoJ's expectation of core inflation hitting 1.5% by the end of fiscal 2017 and 1.7% by the end of fiscal 2018.
On the data front...
China Caixin PMI services dropped 0.4 to 52.2 in March. Japan will release consumer confidence today. Germany factory orders, Eurozone retail PMI and Swiss CPI will be featured in European session. In US session, US Challenger job cuts, jobless claims and Canada building permits will be featured.
AUD/USD Daily Outlook
Daily Pivots: (S1) 0.7554; (P) 0.7570; (R1) 0.7584; More...
AUD/USD's fall from 0.7748 continues today and reaches as low as 0.7532 so far. Intraday bias remains on downside for 0.7490 support. Decisive break of 0.7490 will confirm completion of rise from 0.7158. In such case, near term outlook will be turned bearish for 0.7158 support. On the upside, above 0.7586 minor resistance will turn bias neutral first. And, break of 0.7678 minor resistance will turn bias back to the upside and could extend the rise fro 0.7158 through 0.7748 resistance.
In the bigger picture, we're still treating price actions from 0.6826 low as a correction. And, as long as 38.2% retracement of 0.9504 to 0.6826 at 0.7849 holds, long term down trend from 1.1079 is expected to resume sooner or later. Break of 0.6826 low will target 0.6008 key support level. However, firm break of 0.7849 will indicate that rise from 0.6826 is developing into a medium term rebound, rather than a sideway pattern. In such case, stronger rise should be seen to 55 month EMA (now at 0.8165) and above.
Economic Indicators Update
| GMT | Ccy | Events | Actual | Forecast | Previous | Revised |
|---|---|---|---|---|---|---|
| 1:45 | CNY | Caixin PMI Services Mar | 52.2 | 53.2 | 52.6 | |
| 5:00 | JPY | Consumer Confidence Index Mar | 43.4 | 43.1 | ||
| 6:00 | EUR | German Factory Orders M/M Feb | 3.50% | -7.40% | ||
| 7:15 | CHF | CPI M/M Mar | 0.20% | 0.50% | ||
| 7:15 | CHF | CPI Y/Y Mar | 0.50% | 0.60% | ||
| 8:10 | EUR | Eurozone Retail PMI Mar | 49.9 | |||
| 11:30 | EUR | ECB Monetary Policy Meeting Accounts | ||||
| 11:30 | USD | Challenger Job Cuts Y/Y Mar | -40.00% | |||
| 12:30 | CAD | Building Permits M/M Feb | 5.40% | |||
| 12:30 | USD | Initial Jobless Claims (APR 01) | 250k | 258k | ||
| 14:30 | USD | Natural Gas Storage | -43B |