
Sample Category Title
U.S. Services Sector Momentum Slows in March
The Institute for Supply Management's (ISM) non-manufacturing index weakened in March, falling 2.4 points to 55.2 - a print below market consensus, which called for a slight moderation to 57. The monthly pullback erases most of the gains made in the last five months. Still, the index is well into expansionary territory.
The vast majority of sub-indicators deteriorated on the month, with inventory sentiment, new export orders and imports and being the only exception - the last two improving by 5.5 points apiece.
Among the main sub-indicators, business activity and new orders fell 4.7 and 2.3 points respectively to 58.9, employment fell 3.6 points to 51.6 and prices fell 4.2 points to 53.5. The latter is still some 3.5 points above the year-ago level.
Despite the pullback, comments on business conditions and the overall economy remained positive. All but three of the 18 non-manufacturing industries reported growth in March, with information, educational and professional services being the only exceptions.
Key Implications
The ISM nonmanufacturing index followed its manufacturing cousin in decelerating in March, but by a greater degree and with broader weakness across sub-indicators. Nevertheless, when put into context, the index is still well in expansionary territory, industry comments remain largely positive and the vast majority of industries reported growth in March.
With respect to the survey details, the significant pullback in the employment sub-index points to some potential softness in the employment report on Friday. Meanwhile, the prices sub-index remains above year-ago levels and is still indicative of rising inflationary pressures and supportive of the Fed's gradual interest rate hiking cycle.
Putting the numbers together, results from both ISM surveys point to a notable improvement in activity for the first quarter of the year, but this is at odds with 'harder' economic data that suggest that the economy only advanced at a modest 1% pace. This divergence in momentum can be largely attributed to soft consumer spending and inventory adjustment, both of which are likely to be transitory.
What Could Possibly Go Wrong?
This time is different. Stocks will always go up. And pigs can fly. Given that pigs are highly intelligent, don't bet against them. That said, investors might want to take at least the first two statements with a grain of salt.
In the 1990s, stocks continued to rise relentlessly for years, even after then Fed Chair Greenspan warned of irrational exuberance in late 1996.
Last decade, the rally in home prices continued as ever more people appeared convinced that home prices never fall.
This time around, we are eight years into a bull market. As in those times, investors have all but given up betting against conventional wisdom. Much of that is because it has cost investors dearly to bet against the markets. In fact, it has been so costly to bet against the market that some advisors who have been cautious are no longer in business. And I'm not just talking about short sellers, but also many who have - in our view prudently - diversified beyond a traditional "60/40" stock/bond portfolio. We know of advisors who positioned their portfolios more aggressively not because they thought the markets were going higher, but because they were losing clients for underperforming the S&P 500.
Some things are different.
The investment industry has evolved to provide ever more index products, with lots of touting how active management is dead. If that were true, we wouldn't have a plethora of index funds for many slices of the market as selecting anything but a market portfolio is the very definition of active management. Then again, when "everything" goes up, does it really matter what you buy, so long as investors buy something? So what is different?
A new breed of liquidity providers
In the old days, we had banks and floor traders provide liquidity. Dodd Frank has significantly cut back the type of trading banks may engage in. And floor traders have been replaced by computers. Floor traders on the New York Stock Exchange used to have a duty to make orderly markets with the ability to slow down trading to match buyers and sellers. That philosophy lost out to the philosophy that speed is more important than price, meaning that if an investor wants to trade, let them trade instantaneously, even if the price needs to adjust sharply.
Today's liquidity providers include ETF market makers and hedge funds. They will provide all the liquidity in the world, so long as everything appears orderly. But let the algorithms flag an abnormality, and their systems may go offline. Without going into the arcane details how market making works, let's take a common model (there are others) how ETFs trade:
- A so-called lead market maker gets incentivized to offer a tight spread for an ETF (the incentive comes from the exchange giving the market maker a rebate on the price, i.e. giving them a price advantage through actual cash; the rebate comes from the exchange fee investors are paying).
- There's a plethora of other market makers also providing liquidity, enabling what appear to be mostly efficient markets. These other market makers also get incentives from the exchange, albeit lower ones than the lead market maker. As a result, it creates a structure where all market makers can offload their risk to the lead market maker. This makes it comparatively easy for market makers to make markets in thousands of ETFs, as they don't need to understand too well the ETF they are providing liquidity for; all they need to know is that they can offload their risk to the lead market maker.
- This system works great until the lead market maker has a glitch and takes its systems offline. When that happens, other market makers see that the party that is supposed to be best informed (the lead market maker) is stepping away. Not surprisingly, everyone else also steps away, causing spreads to widen.
- A flash crash can then happen if investors place large market orders just as liquidity providers are offline.
Lower volatility?
Markets have been rising on the backdrop of low liquidity. Why has volatility been so low? We see two primary drivers: the rise of machines, as well as central banks:
To the extent that information is processed correctly, trading firms focused on 'big data' scanning the news flow automatically may well speed up how readily new information is absorbed in the market. As such, the rising influence of machines in the market may well contribute to the lower volatility we have seen. That said, we wonder how big that impact is.
When ECB chief Draghi said, he'll do "whatever it takes" to save the euro a few years ago, he put into plain English what had been happening for some time since the onset of the financial crisis: taking risk out of markets. A few weeks ago, he said in a press conference there's no need to be concerned about upcoming events in the Eurozone because we can't do anything about the outcome anyway; and if something bad were to develop for the markets, the ECB would take the appropriate action. Differently said: heads, I win; tails, you lose.
More abstractly speaking, central banks have compressed risk premia through quantitative easing and their forward guidance.
Some things stay the same...
In our analysis, all else equal, lower volatility warrants higher valuations. That's because in a classic valuation model where asset prices reflect the present value of discounted future cash flows. Lower volatility increases valuations because future cash flows are discounted at a lower rate. This warrants the question whether volatility will stay lower, permanently.
I have my doubts. On the contrary, in my assessment the hallmark of any asset bubble is low volatility. Capital misallocations happen when risk is underpriced. When it is a central bank, be that the Fed, the ECB or another central bank causing the underpricing of risk, it doesn't suddenly become rational. Sure, one can argue that it is a quixotic task to fight the Fed, but that doesn't mean an asset bubble won't be created and won't burst.
Get ready for the crash...
We believe one of the reasons the Fed has been so reluctant to raise interest rates is because of the "taper tantrums" the market has exhibited. Because we believe the economic recovery was driven by asset price reflation, the Fed has been hesitant to withdraw stimulus too early, to avoid deflationary forces taking over again. The Fed has been trying to engineer what we call a "cliff walk" trying to normalize interest rates without causing a shock to asset prices.
Of late, the Fed has been emboldened: with a few speeches, the market delivered the Fed a rate hike on a silver platter, without equity markets having a fit. Indeed, some Fed officials have been all chirpy of late, talking about three to four interest rate hikes this year. Fed officials are acting as if they were at cocktail parties bragging about their great trade, pardon, rate decision. The reason I'm skeptical is because the folks at the Fed are so data dependent that they tend to fight yesterday's war. For example, President Trump's inability to pass healthcare legislation at this stage, and the implication that he might be less effective with other items of his agenda, may not appear on the minds of ivory tower academics more concerned about extrapolating data from non-farm payroll reports. By the way, as of this writing, the market is pricing in just under 2 and half rate hikes for the year, including the March rate hike (based on Fed Funds futures).
Let's also not forget that Fed Chair Yellen's term is due to end early next year. In a few months, the talk about her successor will increase. Our chips are with Kevin Warsh; Mr. Warsh was governor at the Fed during the financial crisis. Importantly, he was invited to be part of President Trump's economic round-table earlier this year. And very relevant, he has argued that the Fed's policies have helped owners of stocks, but actually hurt investments in the real economy. In multiple Wall Street Journal OpEds, he has criticized the Fed for a lack of strategy. He has argued that the Fed must revert to focusing on the real economy rather than a focus on the financial markets. We interpret this to mean that a Fed under Kevin Warsh may well raise rates even if the market has a fit. That said, he wouldn't be the first Fed Chair to learn that the markets have a way of convincing the Fed to change course...
Differently said, we believe the Fed may well be thinking that the crisis is behind us, that the time to normalize is now. This may well mean higher volatility and lower asset prices. So should you "get ready for the crash..."? Isn't this alarmist? We don't think so. In fact, you may always want to be ready for a crash. You may want to hope for the best, but that's not a strategy; you should always plan for the worst. As such, stress testing one's portfolio may always be a prudent idea. That said, we do think that the odds of a more serious decline in asset prices have increased sharply given a combination of what we believe are high valuations; a period of low volatility that may be nearing its end; rising interest rates; all of this in the context of what we believe is an over-exposure to equities in both individual and institutional portfolios.
What about gold?
So here I am cautioning that the Fed may drop its reluctance and become more assertive in raising rates. Isn't that bad for the price of gold? It all depends on how one thinks this will play out. I happen to believe that a more assertive Fed will take it away from its path on the cliff walk. And once you take a step to the side when walking on a cliff, well, watch out below. That is, I don't think the Fed can normalize rates even if they wanted to. I happen to think that a more assertive normalization attempt will cause equity prices to plunge. When equity prices plunge, investors may well think the glass is half empty, i.e. interpret any news on the economy or out of Washington to be bad for the markets. Confidence can evaporate rather quickly. The ivory tower club at the Fed will take note of deteriorating financial conditions and, well, not be able to execute the normalization of interest rate policy as underlying economic data increasingly start to disappoint. There are obviously many other scenarios as well, but the above is our baseline scenario for the time being (and subject to change at any moment).
Note that gold has outperformed the S&P in the first quarter despite an interest rate hike. In our analysis, the price of gold has gone up in each bear market since the early 1970s, with the notable exception of the Volcker-induced bear market in the early 1980s where real interest rates were pushed to very high levels. We aren't suggesting investors should dump their equities and buy gold. We mention gold because it is one of the "easiest" diversifiers; easy because gold dynamics are easier to understand than other ways to seek diversification for one's portfolio in an era when most asset prices may be elevated. Easiest also doesn't mean best, as the price of gold doesn't always go up when equities go down.
ISM Non-Manufacturing Signals Activity Cooled in March
Activity outside the manufacturing sector expanded at a slower pace in March. The ISM non-manufacturing index fell to 55.2 amid slower growth in new orders and weaker hiring.
The Start of Survey Data Coming Back to Reality?
The ISM non-manufacturing index signaled economic growth cooled a bit in March. The index fell 2.4 points but, at 55.2, continues to indicate that the economy is expanding at a decent clip, despite expectations for another soft Q1 GDP reading.
Current business activity and new orders grew at a slower clip in March, although both indexes remain solidly in expansion territory at 58.9
Slower Employment Growth
The employment index fell 3.6 points to 51.6, signaling hiring continued to expand in March but at a slower pace. We expect to see a similar result in Friday's employment report, with payrolls estimated to have expanded by 191,000 compared to an average gain of 209,000 over the past three months.
Input price pressures were milder last month and are consistent with only a gradual rise in service-sector inflation.
Currencies: USD/JPY Regains 111 Barrier on Strong ADP Report
Headlines
US equities took a flying start after a bumper ADP Employment report and show gains of 0.4% to 0.7%. European equities moved mostly sideways with eking out some modest gains in the slipstream of US equities.
Companies added workers to US payrolls in March at the fastest pace since December 2014 (263k vs 185k expected) on solid gains in construction and manufacturing and at small businesses, the ADP report showed. ADP downwardly revised the February outcome from 298k to 245k.
US Non-manufacturing ISM disappointed as the headline figure fell to 55.2 from 57.6 previously. It remains a decent level but the easing is clear. Initial market reaction is minimal.
The UK services PMI beat expectations in March, rising from 53.3 to 55 while consensus expected a stabilisation (53.4). The final EMU services PMI was unexpectedly downwardly revised from 56.5 to 56.
Greek prime minister Alexis Tsipras has called for an emergency summit of EU leaders this month if the bloc's finance ministers fail to reach an agreement over the country's bailout at a meeting on Friday.
The time is approaching to "not have the foot pressed down on the gas pedal, but to lift it slightly," ECB Governing Council member Weidmann said in an interview. He would welcome if bond purchases have stopped in one year.
There is no need to contemplate raising interest rates soon, according to BoE Vlieghe, because consumer finances are increasingly squeezed and the rise in inflation appears temporary.
EU finance ministers will try on Friday to find a way to deal with bad loans at European banks that drain their profits and capital and obstruct their financing of the economy. The 2008 financial crisis and subsequent economic downturn in Europe increased NPL's of EU banks, which now amount to €1 trillion, or 5.4% of all bank loans.
South Africa's African National Congress "closed ranks" around President Jacob Zuma after two key allies of the ruling party called for his resignation following a cabinet reshuffle that cost the country one of its investment-grade credit ratings. The ZAR remained under pressure though, with USD/ZAR moving towards the 14-mark.
Rates
Core bonds marginally lower
Global core bonds lost marginally ground today. Most European stock markets trade positive and oil prices extended their recovery. The rise of USD/JPY also suggests an improvement in risk sentiment. The final EMU services PMI was downwardly revised, but attention turned to a stronger than expected ADP employment report which confirms ongoing strength of the US economy and warrants a continuation of the Fed's normalisation process. US Treasuries dipped to an intraday low after the release, but the move remains very limited ahead of US non-manufacturing ISM (later today), FOMC Minutes and payrolls (Friday). FOMC Minutes could give more insight on ending the Fed's reinvestment policy. That could cause some steepening of the US yield curve. Last week's market reaction (bull steepening) showed that the front end of the curve is also sensitive to the debate as running off the BS is an alternative for hiking rates, at least according to NY Fed Dudley.
At the time of writing, the US yield curve bear steepens with yields 0.6 bps (2- yr) to 2.3 bps (30-yr) higher. The German yield curve shifts in similar fashion with yield changes varying between flat (2-yr) and +2.1 bps (30-yr). On intra-EMU bond markets, 10-yr yield spread changes versus Germany range between -1 bp and +3 bps. French bonds didn't outperform on Marine Le Pen's underperformance in the 2nd French presidential election debate.
The German Finanzagentur tapped the on the run 5-yr Bobl (€4B 0% Apr2022). Total bids amounted only €3.94B, below the €4.33B average at the previous 4 Bobl auctions and below the amount on offer. The Bundesbank set aside €0.78B for secondary market operations, resulting in an official bid cover of 1.2. The real bid cover was 0.98 though. The auction tailed one cent with an unchanged auction yield (-0.45%) compared to the March tap.

Currencies
USD/JPY regains 111 barrier on strong ADP report
The dollar initially held tight ranges against the euro and the yen today. The US currency was propelled by a strong ADP labour report early in US dealings. Especially USD/JPY profited. The pair returned well north of 111.00 (currently 111.40). Dollar gains against the euro was much more modest. EUR/USD currently trades in the 1.0660 area. The US non-manufacturing ISM and the Fed Minutes published will be published later today and are next references for USD trading.
Overnight, the picture of the major USD cross rates remained indecisive. USD/JPY traded in the 110.60/80 area, off yesterday's low (110.40 area). However, risk sentiment wasn't strong enough to trigger a further decline of the yen. At the same time, the euro also drifted slightly further north. The single currency was supported by headlines that Marine Le Pen didn't perform well in the second French election debate. EUR/USD hovered in the 1.0680 area.
There was again no clear driver for currency trading in Europe this morning. European equities mostly traded sideways near yesterday's closing level and without spill-over effects on other markets. The final EMU services PMI was revised slightly softer. However, at 56.00, the indictor still points to solid EMU growth at the end of Q1. EUR/USD lost a few ticks after the publication of the report, but we doubt that there was a link. The dollar was slightly better bid overall.
Early in US dealings, the ADP reported 263 000 net job growth in March. The February figure was downwardly revised from 298 000 to 245 000. Even so, the report suggests ongoing healthy US job growth. The market reaction to the ADP report is often very modest as investors prefer to wait for the official US payrolls report. However, this time the positive surprise was big enough to inspire some USD buying (even as the reaction on the interest markets was very limited). Especially USD/JPY profited. The pair trades currently in the 111.40 area going into the publication of the US non-manufacturing ISM. Later this evening USD traders will keep an eye on the Minutes of the March FOMC meeting. The gain of the dollar against the euro was negligible. EUR/USD trades in the 1.0665 area.

Sterling jumps on solid UK services PMI
Today, there was only one factor relevant for sterling trading: the UK services PMI. The January and February PMI's showed a loss of momentum in UK services' growth(Feb 53.3). However, the March measure surprised again on the upside of expectations and printed at a solid 55.00. Sterling jumped higher upon the publication of the report. EUR/GBP dropped from the 0.8585 area to the mid 0.85 area. In a similar way, cable jumped from the 1.2440 area to the 1.2480 area. After this reset, both EUR/GBP and cable settled again in very tight intraday ranges. In a broader perspective, sterling still holds within reach of the recent highs, but at least for now there are no follow-through gains on last week's short-squeeze.

USD/JPY Pushes Above 111 on Sparkling ADP Employment Data
The Japanese yen has lost ground in the Wednesday session. In the North American session, USD/JPY is trading at 111.20. On the release front, US ADP Employment Change soared to 263 thousand, crushing the forecast of 184 thousand. The news was less positive in the services sector, as ISM Non-Manufacturing PMI dropped to 55.2, short of the forecast of 57.0 points. Later in the day, the Federal Reserve will release the minutes of its March policy meeting. There are no Japanese events on the schedule. On Thursday, the US releases the weekly unemployment claims report.
The Japanese economy has shown improvement in recent months, as the manufacturing and export numbers are pointing higher. At the same time, domestic consumption remains soft and inflation levels remain well below the BoJ's target of 2.0% percent. The BoJ's preferred inflation indicator, BoJ Core CPI, remains weak and dipped to 0.1 percent. With such low inflation levels, the Bank of Japan is unlikely to tighten monetary policy anytime soon. The Japanese consumer remains pessimistic about the economy, and Japanese Consumer Confidence is expected to confirm this sentiment, with the March reading standing at 43.5 points.
All eyes are on the Federal Reserve, which will release the minutes of its March policy meeting. At the meeting, the Fed raised rates by a quarter-point, to a range of 0.75%-1.00%. The markets will be paying close attention to the minutes, looking hints about the timing of the next hike, as well as the tone of the minutes are factors which could move the currency markets on Wednesday. The markets considered the rate statement overly cautious, and this sentiment sent the US dollar broadly lower in March. If the reaction to the minutes is one of disappointment, the dollar could again experience broad losses.
With the US economy continuing to perform well, the discussions around the monetary policy tables are not whether the Fed will raise rates, but how many hikes we will see in 2017. There is speculation about whether the Fed will hike rates two more times or three more times, and Fed policymakers seemed divided on this question. Last week, FOMC member called for three more hikes, saying the Fed should raise rates in June, September and December. Rosengren said that employment and inflation levels were close to the Fed's targets, and that three additional hikes were needed in order to prevent the US economy from overheating. However, a majority of FOMC members are in favor of two more hikes this year.
Next Steps for the UK-EU Relationship
- Theresa May triggers Brexit
- Sterling strengthens on US influences
Sterling has been whipped around in the 1.210 - 1.265 range for the last six months and both extremes of that range were tested in March. Brexit, for once, was not the sole reason for volatility, as the US Federal Reserve sought to head off rising inflation with a third interest rate rise since the 2008 financial crash; and the second in three months, taking the base rate to 1%. The US central bank set aside concerns about the impact of higher rates on consumer spending to confirm projections that it is prepared to increase rates several times this year to control rising prices, as inflation pops above 2%. The US Dollar rallied on the news, as it seems that the Federal Reserve will remain hawkish, although most expect them to peak around 2%.
Market nervousness as nature and scope of Brexit debated
The market had been incredibly nervous of the UK looking to negotiate the hardest of Brexits and UK Prime Minister, Theresa May, had made it clear that the UK would be leaving the single market and look to take control of immigration once negotiations had been concluded. The Pound has been sold as a result, as capital outflows increased with investors concerned about growth in the United Kingdom over the next couple of years. Final arguments within the UK continued up until the last minute, however, Mrs May was able to trigger Article 50 on March 29th and the Pound had already begun to rally.
Next steps for the UK-EU relationship
We are now awaiting a detailed response from the European Union, not due to meet until April 29th when they are expected to adopt their Brexit guidelines. Until then, we are in a bit of a vacuum and it is unlikely that there will be any change in sentiment unless we get some clarity around the issue. The EU has insisted that there can be no parallel talks and that we cannot move forward with trade discussions unless there has been an agreement on the "divorce". The negotiations will be tricky, especially as all the EU member states will have a domestic audience to appease. Elections in France and Germany will complicate matters further. In the short term, it is difficult to see how Sterling can rally.
US influences on Sterling strength
Attention will turn to President Trump and his meeting with Chinese Premier Xi Jinping this week. Mr Trump has already labelled the Chinese as currency manipulators. I guess we will have to wait for the official "handshake" to see if there is any further friction between the two leaders. Non-farm payroll data is also due later this week, however, rhetoric from EU/UK policymakers will most likely have more impact on the short term direction of the Pound.
US Dollar Buyers
The range has been set for the last 6 months and the 1.2550/1.2600 area is solid resistance to target. We are close to that level at the moment so it may be prudent to begin reducing any near term exposure.
US Dollar Sellers
A break above 1.2700 would suggest a test of 1.3000. For now, this looks unlikely. If you have time, 1.2200/1.2250 is decent support, as we expect the market to range trade for the time being.
EUR/USD Mid-Day Outlook
Daily Pivots: (S1) 1.0646; (P) 1.0662 (R1) 1.0688; More....
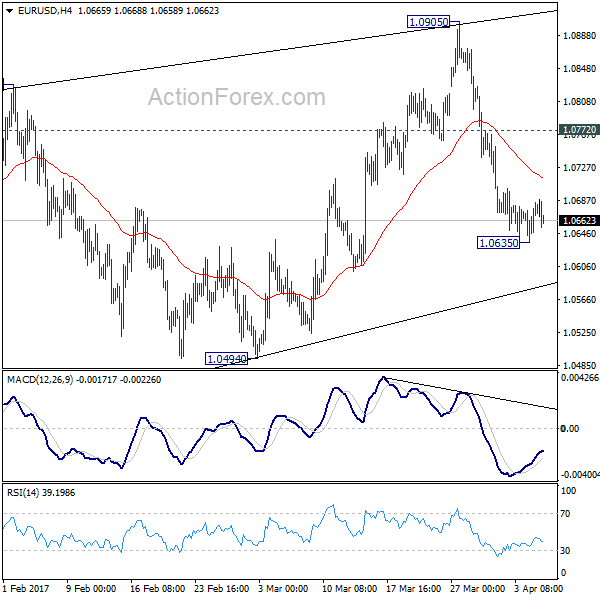
Intraday bias in EUR/USD remains neutral for consolidation above 1.0635 temporary low. Recovery should be limited by 1.0772 resistance and bring another fall. As noted before, corrective rise from 1.0339 is completed at 1.0905. And more importantly, larger down trend is probably resuming. Below 1.0635 will turn bias back to the downside for 1.0494. Break will confirm this bearish case and target 1.0339 low. However, above 1.0772 will delay this bearish case and bring another rise back to 1.0905 first.
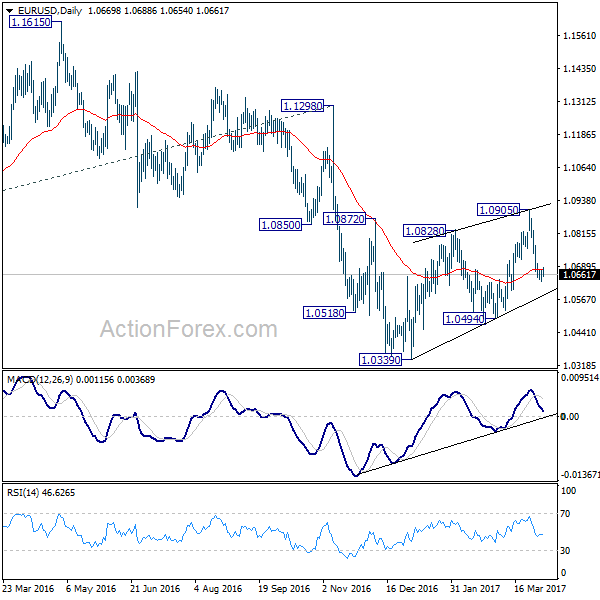
In the bigger picture, as long as 1.1298 key resistance holds, whole down trend from 1.6039 (2008 high) is still expected to continue. Break of 1.0339 low will send EUR/USD through parity to 61.8% projection of 1.3993 to 1.0461 from 1.1298 at 0.9115. However, considering bullish convergence condition in weekly MACD, break of 1.1298 will indicate term reversal. this would also be supported by sustained trading above 55 week EMA.
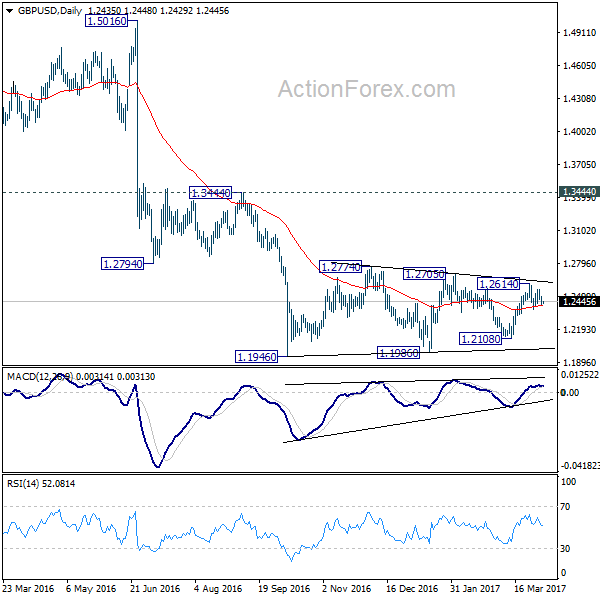
GBP/USD Mid-Day Outlook
Daily Pivots: (S1) 1.2407; (P) 1.2451; (R1) 1.2483; More...
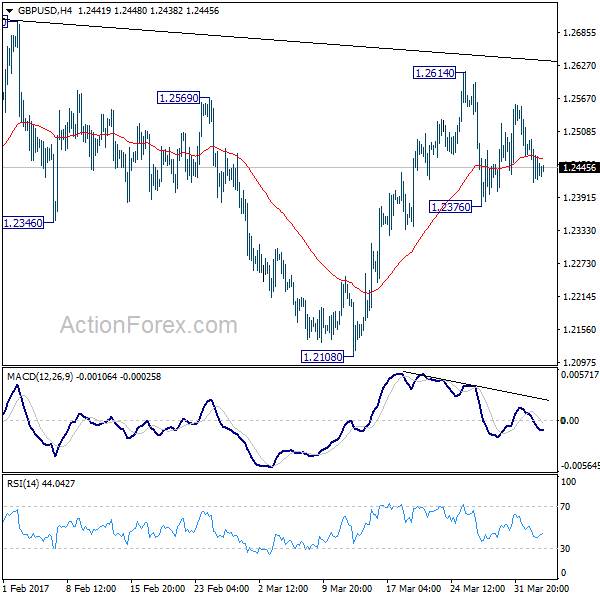
Intraday bias in GBP/USD stays neutral at this point as range trading continues inside 1.2376/2614. Overall, price actions from 1.1946 are viewed as a consolidation pattern pattern. On the downside, break of 1.2376 will turn bias to the downside for 1.2108 support. Decisive break there will be an early sign of larger down trend resumption. On the upside, break of 1.2614 will extend the rise from 1.2108. But upside should be limited by 1.2705/2774 resistance zone to bring larger down trend resumption eventually.
In the bigger picture, fall from 1.7190 is seen as part of the down trend from 2.1161. There is no sign of medium term reversal yet. Sustained trading below 61.8% projection of 2.1161 to 1.3503 from 1.7190 at 1.2457 will target 100% projection at 0.9532. Overall, break of 1.3444 resistance is needed to confirm medium term bottoming. Otherwise, outlook will remain bearish.
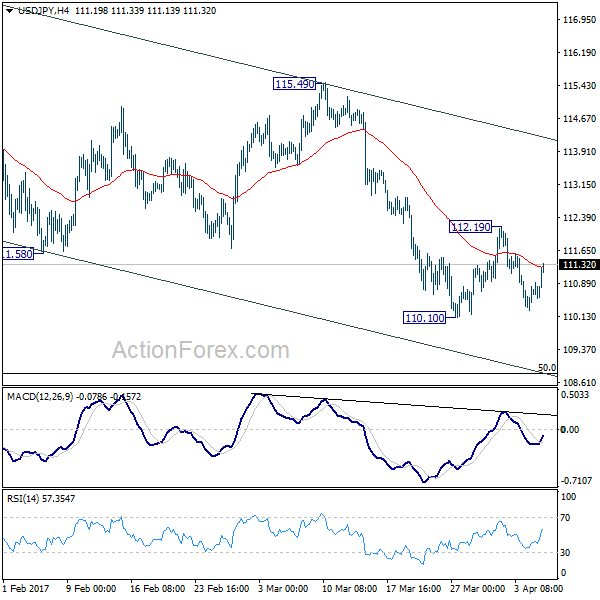
USD/JPY Mid-Day Outlook
Daily Pivots: (S1) 110.35; (P) 110.64; (R1) 111.02; More....
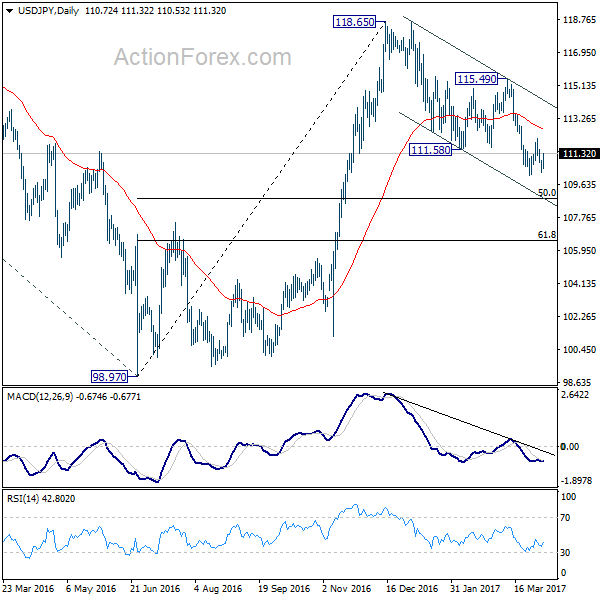
With 4 hour MACD crossed above signal line, intraday bias in USD/JPY is turned neutral first. On the downside, break of 110.10 will resume the whole corrective decline from 118.65 and target 50% retracement of 98.97 to 118.65 at 108.81. On the upside, however, break of 112.19 resistance will indicate short term reversal and turn bias back to the upside for 115.49 resistance.
In the bigger picture, price actions from 125.85 high are seen as a corrective pattern. The impulsive structure of the rise from 98.97 suggests that the correction is completed and larger up trend is resuming. Decisive break of 125.85 will confirm and target 61.8% projection of 75.56 to 125.85 from 98.97 at 130.04 and then 135.20 long term resistance. Nonetheless, sustained trading below 55 week EMA (now at 111.16) will extend the consolidation from 125.85 with another fall through 98.97 before completion.
Dollar Mildly Higher after ADP Employment, But No Follow Through Buying Yet
Dollar strengthens mildly in early US session after stronger than expected job data. But there is no follow through buying seen yet. ADP report showed 263k growth in private sector jobs, versus consensus of 189k. Prior month's figure was revised down fro 298k to 245k, but was still solid. Markets will look into the FOMC minutes of March meeting to be released later today, as well as non-farm payroll report on Friday. The two-day meeting between US President Donald Trump and China President Xi Jinping will also be closely watched. But after all, directions of Dollar and treasury yields will remain dependent Fed expectations. And it's well known that Fed's base case is three hikes in total this year. Change in the base case will require solid input from Trump's implementation of his economic policies. And we're yet to see anything solid. Any movements in the greenback would likely be temporary before Trump delivers.
North Korea missile test ignored
Markets reacted rather calmly to news that North Korea fired another ballistic missile into waters off its east coast into the sea of Japan. Or indeed, some might say that markets didn't react at all. The US department of state also responded by said that "the United States has spoken enough about North Korea. We have no further comment". North Korea is believed to be one of the top issues at the two-day meeting between Xi and Trump. And Trump has also said that China should use its "great influence" to resolve the issue of North Korea. And, Trump said that "if China is not going to solve North Korea, we will". But then again, there is no detail on what US will do in case Trump cannot break the deadlock on North Korea with China.
UK services PMI beat expectations
UK services PMI rose to 55.0 in March, up from 53.3 and beat expectation of 53.5. Markit noted that "the survey data indicate that UK business activity growth regained some momentum after having slipped to a five-month low in February, but the upturn fails to change the picture of an economy that slowed in the first quarter." Meanwhile, the relative weakness of the PMI survey data compared to that seen at the turn of the year suggests the economy will have grown by 0.4% in the first quarter, markedly lower than the 0.7% expansion as seen in the fourth quarter of last year." And, "much of the disappointment in growth so far this year has been evident in consumer-oriented sectors, in part linked to spending and incomes being squeezed by higher prices.
Also from Europe, UK BRC shop price index dropped -0.8% yoy in March. Eurozone services PMI was revised down to 56.0 in March, Germany services PMI unrevised at 55.6, France services PMI revised down to 57.5. Italy services PMI dropped to 52.9, down from 51.4 and missed expectation of 54.3.
ECB Vasiliauskas: too early to discuss stimulus exit
In Eurozone, ECB governing council member Vitas Vasiliauskas said that "it is too early to discuss an exit because still we have a lot of significant uncertainties." He believed that "recovery of inflation is still fragile". Also, he emphasized that ECB has to "end purchases and only then we can discuss other actions." And he found the discussions of raising interest rate before end of QE as "illogical". Meanwhile he stressed that ECB's forward guidance is "very important" and should be "as predictable as possible".
Leftist Jean-Luc Melenchon came out of the chaotic eleven candidate French presidential election TV debate as the best performer. According to an Elabe poll, 25% said Melenchon was the most convincing performer in the debate. Conservative François Fillon got 15% followed by far right candidate Marine Le Pen's 11%. An OpinionWay poll had centrist Emmanuel Macron, Melenchon and Fillon tied at 18% and Le Pen at 11%. Euro showed little reaction to the news.
BoJ may downgrade inflation forecast this month
In Japan, a former BoJ official Kazuo Momma said that the central bank will likely revise down inflation forecast soon, possibly as early as during the quarterly review this month. Momma noted that the BoJ's price forecasts are "too optimistic". Meanwhile, it's "hard to raise interest rates when you're cutting your inflation forecasts." Momma expects core inflation hover around 0.5% in the current fiscal year, and jump to 1.0% next. That's sharply lower than BoJ's expectation of core inflation hitting 1.5% by the end of fiscal 2017 and 1.7% by the end of fiscal 2018.
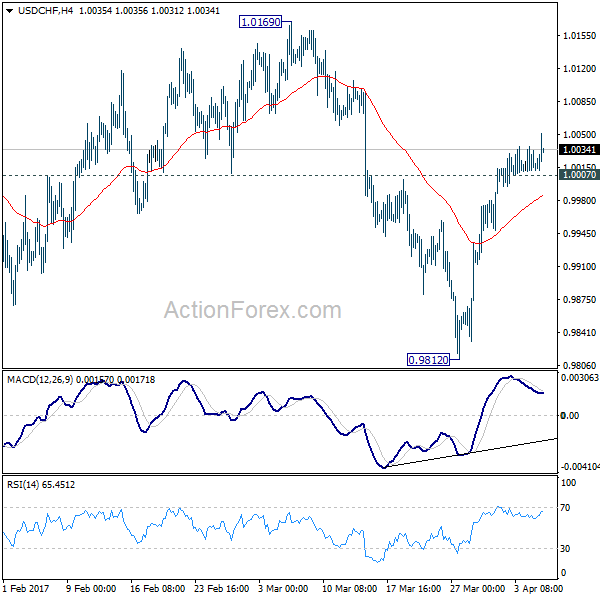
USD/CHF Mid-Day Outlook
Daily Pivots: (S1) 1.0006; (P) 1.0022; (R1) 1.0032; More.....
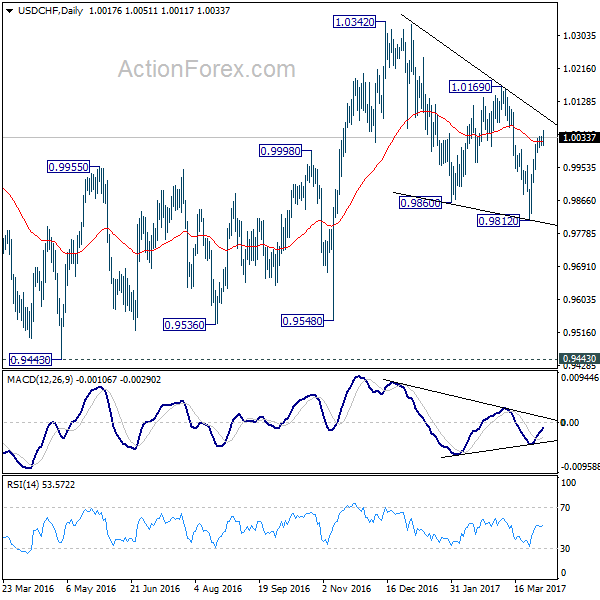
USD/CHF's break of 1.0036 suggests that rise from 0.9812 has resumed. Intraday bias is turned back to the upside for 1.0619 resistance first. As noted before, corrective decline fall from 1.0342 should have finished with three waves down to 0.9812 already. Break of 1.0169 should confirm this bullish case and target a test on 1.0342 high. On the downside, below 1.0007 minor support will turn bias neutral and bring retreat before staging another rally.
In the bigger picture, USD/CHF is staying in medium term sideway pattern between 0.9443/1.0342. In any case, decisive break of 1.0342 resistance is needed to confirm underlying strength. Otherwise, we'll stay neutral in the pair first. In case of another fall, we'd expect strong support from 0.9443/9548 support zone.
Economic Indicators Update
| GMT | Ccy | Events | Actual | Forecast | Previous | Revised |
|---|---|---|---|---|---|---|
| 23:01 | GBP | BRC Shop Price Index Y/Y Mar | -0.80% | -1.00% | ||
| 07:45 | EUR | Italy Services PMI Mar | 52.9 | 54.3 | 54.1 | |
| 07:50 | EUR | France Services PMI Mar F | 57.5 | 58.5 | 58.5 | |
| 07:55 | EUR | Germany Services PMI Mar F | 55.6 | 55.6 | 55.6 | |
| 08:00 | EUR | Eurozone Services PMI Mar F | 56 | 56.5 | 56.5 | |
| 08:30 | GBP | Services PMI Mar | 55 | 53.5 | 53.3 | |
| 12:15 | USD | ADP Employment Change Mar | 263K | 189K | 298K | 245K |
| 14:00 | USD | ISM Non-Manufacturing Composite Mar | 57 | 57.6 | ||
| 14:30 | USD | Crude Oil Inventories | 0.9M | |||
| 18:00 | USD | FOMC Meeting Minutes |