
Sample Category Title
USD/CHF Mid-Day Outlook
Daily Pivots: (S1) 1.0006; (P) 1.0022; (R1) 1.0032; More.....
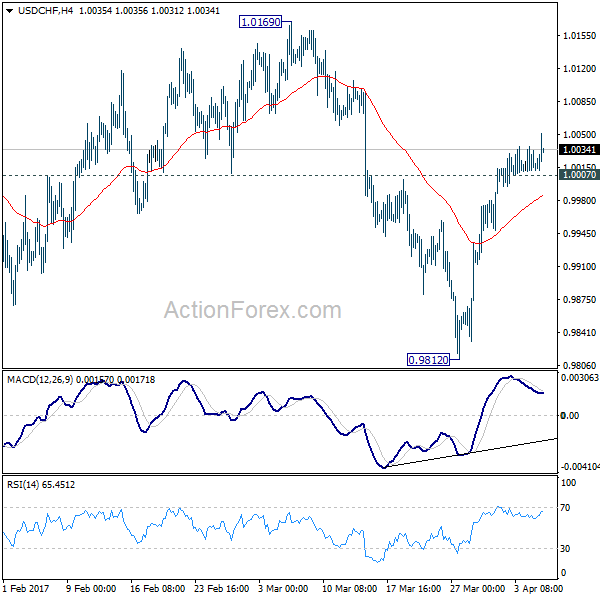
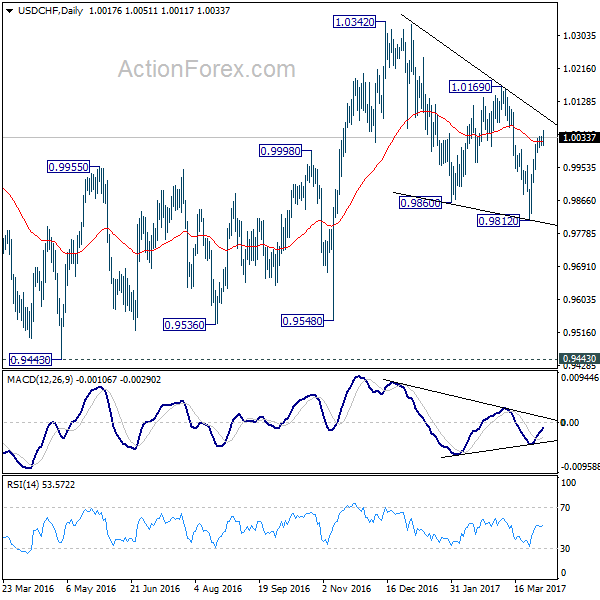
USD/CHF's break of 1.0036 suggests that rise from 0.9812 has resumed. Intraday bias is turned back to the upside for 1.0619 resistance first. As noted before, corrective decline fall from 1.0342 should have finished with three waves down to 0.9812 already. Break of 1.0169 should confirm this bullish case and target a test on 1.0342 high. On the downside, below 1.0007 minor support will turn bias neutral and bring retreat before staging another rally.
In the bigger picture, USD/CHF is staying in medium term sideway pattern between 0.9443/1.0342. In any case, decisive break of 1.0342 resistance is needed to confirm underlying strength. Otherwise, we'll stay neutral in the pair first. In case of another fall, we'd expect strong support from 0.9443/9548 support zone.
Trade Idea: EUR/GBP – Sell at 0.8620
EUR/GBP - 0.8552
Recent wave: Major double three (A)-(B)-(C)-(X)-(A)-(B)-(C) is unfolding and 2nd (A) has possibly ended at 0.6936.
Trend: Near term down
Original strategy :
Sell at 0.8620, Target: 0.8520, Stop: 0.8660
Position : -
Target : -
Stop : -
New strategy :
Sell at 0.8620, Target: 0.8520, Stop: 0.8660
Position : -
Target : -
Stop : -
Euro’s recovery after falling to 0.8485 late last week has retained our view that consolidation above this level would be seen and gain to 0.8590-00 cannot be ruled out, however, renewed selling interest should emerge around 0.8620-25, bring another decline later, below said support at 0.8485 would add credence to our view that top has been formed at 0.8788 and bearishness remains for this fall from there to bring retracement of early upmove, hence further weakness to 0.8470 would be seen, however, oversold condition should prevent sharp fall below 0.8450, risk from there has increased for a rebound to take place later.
In view of this, we are looking to sell euro on recovery as 0.8620-25 should limit upside. Only above 0.8660-65 would defer and suggest low is possibly formed, risk rebound to 0.8680, then 0.8700 but price should falter below said resistance at 0.8735, bring further choppy trading later.
Our preferred count is that, after forming a major top at 0.9805 (wave V), (A)-(B)-(C) correction is unfolding with (A) leg ended at 0.8400 (A: 0.8637, B: 0.9491 and 5-waver C ended at 0.8400. Wave (B) has ended at 0.9413 and impulsive wave (C) has either ended at 0.8067 or may extend one more fall to 0.8000 before prospect of another rally. Current breach of indicated resistance at 0.9043 confirms our view that the (C) leg has ended and bring stronger rebound towards 0.9150/54, then towards 0.9240/50.

Trade Idea: USD/CAD – Buy at 1.3375
USD/CAD - 1.3396
Recent wave: Only wave v of c has ended at 0.9407 and wave C of major A-B-C correction is underway for headway to 1.4700
Trend: Near term up
Original strategy :
Buy at 1.3375, Target: 1.3550, Stop: 1.3315
Position: -
Target: -
Stop: -
New strategy :
Buy at 1.3375, Target: 1.3550, Stop: 1.3315
Position: -
Target: -
Stop:-
As the greenback has retreated after rising to 1.3456 yesterday, suggesting consolidation below this level would be seen and initial downside risk remains for weakness to 1.3370-75, however, reckon 1.3340-50 would hold and bring another rise later, above said resistance at 1.3456 would add credence to our view that the correction from 1.3535 has ended and bring further gain to 1.3495-00 but break there is needed to signal upmove has resumed for retest of 1.3535, once this level is penetrated, this would extend recent recent upmove from 1.2969 to 1.3575-80 but previous chart resistance at 1.3599 should hold on first testing.
In view of this, we are looking to buy on pullback as 1.3370-75 should limit downside and bring another rise. Below 1.3340 would abort and suggest the rebound from 1.3264 has ended instead, bring further fall to 1.3300-10 but said support at 1.3264 should remain intact. Only a break below this level at 1.3264 would shift risk back to downside for the fall from 1.3535 to extend weakness to 1.3235-40 (61.8% Fibonacci retracement of 1.3056-1.3535) and then 1.3200-10.
To recap, wave B from 1.3066 is unfolding as an a-b-c and is sub-divided as a: 1.2192, b: 1.2716 and wave c is a 5-waver with i: 1.1983, ii: 1.2506, extended wave iii with minor iii at 1.0206, wave iv ended at 1.0781 and wave v as well as wave iii has ended at 0.9931, hence the subsequent choppy trading is the wave iv which is unfolding as (a)-(b)-(c) with (a) leg of iv ended at 1.0854, followed by (b) leg at 1.0108 and (c) leg as well as the wave iv ended at 1.0674. The wave v is sub-divided by minor wave (i): 0.9980, (ii): 1.0374, (iii): 0.9446, (iv): 0.9913 and (v) as well as v has possibly ended at 0.9407, therefore, consolidation with upside bias is seen for major correction, indicated target at 1.3700 and 1.4000 had been met and further gain to 1.4700 would be seen later.

Trade Idea Update: USD/CHF – Buy at 0.9950
USD/CHF - 1.0029
Original strategy :
Buy at 0.9950, Target: 1.0050, Stop: 0.9915
Position : -
Target : -
Stop : -
New strategy :
Buy at 0.9950, Target: 1.0050, Stop: 0.9915
Position : -
Target : -
Stop : -
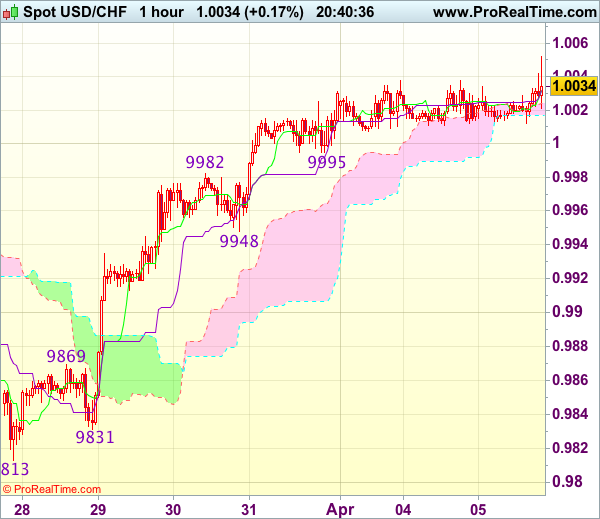
As the greenback has continued trading with a firm undertone after last week’s rally above 1.0003 resistance, suggesting recent rise from last week’s low at 0.9813 is still in progress and bullishness remains for this move to extend gain to previous support at 1.0060 (now resistance), however, loss of upward momentum should prevent sharp move beyond resistance at 1.0109, risk from there has increased for a retreat to take place later.
In view of this, would not chase this rise here and would be prudent to buy dollar on pullback as said support at 0.9948 should limit downside. Below 0.9931 (50% Fibonacci retracement of 0.9831-1.0031) would abort and signal top is formed instead, bring correction to 0.9905-10 (61.8% Fibonacci retracement) but reckon previous resistance at 0.9869 would hold from here.
Trade Idea Update: GBP/USD – Hold short entered at 1.2465
GBP/USD - 1.2483
Original strategy :
Sold at 1.2465, Target: 1.2365, Stop: 1.2500
Position : - Short at 1.2465
Target : - 1.2365
Stop : - 1.2500
New strategy :
Hold short entered at 1.2465, Target: 1.2365, Stop: 1.2500
Position : - Short at 1.2465
Target : - 1.2365
Stop : - 1.2500
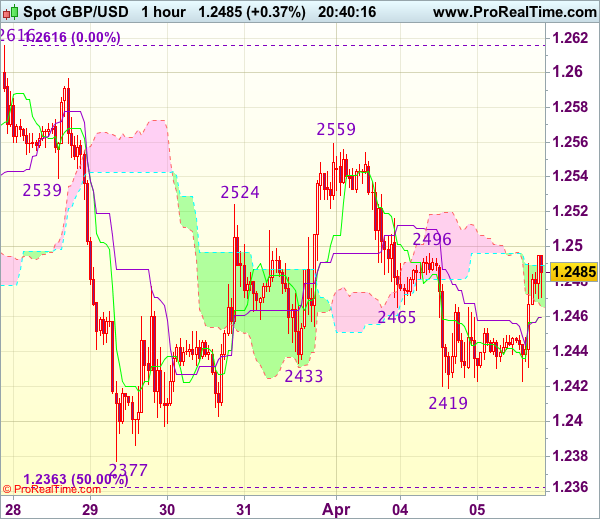
As cable has rebounded again after holding above support at 1.2419, suggesting further consolidation above this level would be seen, however, as long as indicated resistance at 1.2496 holds, mild downside bias remains for another fall, below said support at 1.2419 would bring test of 1.2400 but break there i needed to add credence to our view that the rebound from 1.2377 has ended at 1.2559, bring further fall towards support at 1.2377. Looking ahead, only a drop below 1.2377 would confirm the fall from 1.2616 is still in progress for subsequent decline towards key support at 1.2335.
In view of this, we are holding on to our short position entered at 1.2465 but one should exit on such decline. Only break of said resistance at 1.2496 would abort and suggest an intra-day low is formed instead, risk a stronger rebound to 1.2525-30.
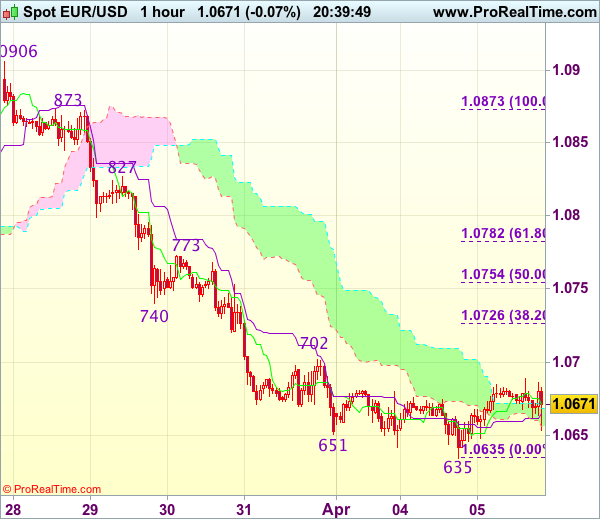
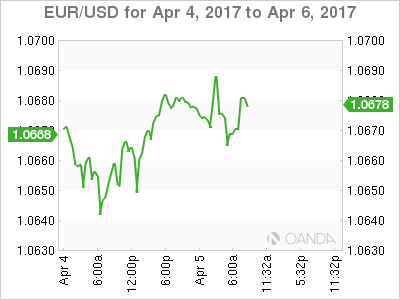
Trade Idea Update: EUR/USD – Sell at 1.0730
EUR/USD - 1.0669
Original strategy :
Sell at 1.0730, Target: 1.0610, Stop: 1.0765
Position : -
Target : -
Stop : -
New strategy :
Sell at 1.0730, Target: 1.0610, Stop: 1.0765
Position : -
Target : -
Stop : -
As the single currency has recovered after falling to 1.0635 yesterday, suggesting minor consolidation above this level would be seen and corrective bounce to 1.0702 cannot be ruled out, however, reckon 1.0730-40 would limit upside and bring another decline, below said support at 1.0635 would add credence to our bearish view that the decline from 1.0906 top is still in progress and extend further weakness to 1.0620, then test of previous chart support at 1.0600, however, a sustained breach below the latter level is needed to retain downside bias for subsequent selloff to 1.0570-75 first.
In view of this, would not chase this fall here and would be prudent to sell dollar on recovery as 1.0730-40 should limit upside. Only a firm break above resistance at 1.0773 would suggest low is formed instead, bring a stronger rebound to 1.0800 but resistance at 1.0827 should remain intact.
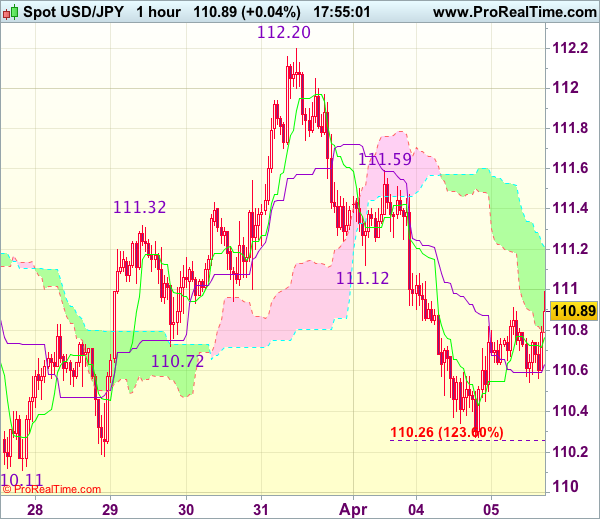
Trade Idea Update: USD/JPY – Sell at 111.55
USD/JPY - 111.13
Original strategy :
Sell at 111.55, Target: 110.35, Stop: 111.90
Position : -
Target : -
Stop : -
New strategy :
Sell at 111.55, Target: 110.35, Stop: 111.90
Position : -
Target : -
Stop : -
As the greenback has rebounded again in European morning, suggesting near term upside risk remains for the rebound from 110.27 (yesterday’s low) to bring retracement of the decline from 112.20, hence further gain to previous support at 111.12 cannot be ruled out, however, resistance at 111.59 would cap upside and bring another decline later, below 110.50-55 would suggest the rebound from 110.27 has ended, bring retest of this level, break there would extend the fall from 112.20 to last week’s low at 110.11. Looking ahead, break there is needed to retain downside bias and confirm medium term decline has resumed for further subsequent fall to 109.80-85 (1.618 times projection of 112.20-111.12 measuring from 111.59) which is likely to hold on first testing.
In view of this, would not chase this fall here and would be prudent to sell dollar on further subsequent recovery as 111.59 resistance should limit upside. Above 111.80 would shift risk to upside and signal the fall from 112.20 has ended, bring subsequent rise to 112.00-05 first.
Canadian Dollar Dips as Canada Posts Trade Deficit
USD/CAD has taken a pause on Wednesday, as the pair trades slightly below the 1.34 line. On the release front, there are no Canadian events. In the US, ADP Nonfarm Payrolls as well as the ISM Non-Manufacturing PMI. As well, the Federal Reserve releases its minutes from the March policy meeting.
The Canadian dollar briefly fell to 3-week lows on Tuesday, following a disappointing trade balance report. Canada recorded its first trade deficit in four months, with a decline of C$1.0 billion. The markets had expected a surplus of C$0.7 billion. On Friday, Canada will release key employment data, with the markets expecting a modest gain of 5.7 thousand jobs. An unexpected reading could trigger some movement from USD/CAD.
What's next for the Federal Reserve? With the US economy continuing to perform well, the discussions around the monetary policy tables are not whether the Fed will raise rates, but how many hikes we will see in 2017. The markets will be paying close attention to the minutes of the March meeting, when the Fed raised rates by a quarter-point, to a range of 0.75%-1.00%. Any hints about the timing of the next hike, as well as the tone of the minutes are factors which could move the currency markets on Wednesday. The markets considered the rate statement overly cautious, and this sentiment sent the US dollar broadly lower in March. If the reaction to the minutes is one of disappointment, the dollar could again experience broad losses.
USD Direction Depends on FOMC Minutes and Turmp-Xi Summit
Wednesday April 5: Five things the markets are talking about
Two and two are not adding up - softer U.S data is flying in the face of consumer sentiment, now at 17- and 11-year highs.
The retreat in the U.S auto sector report on Monday mirrors the lackluster broader consumer spending data released last Friday. Will the Fed shed some light on their fears in today's March FOMC minutes? (2:00 pm EST). Investors want to know how much the Fed has discussed its balance sheet reductions.
For various reasons market moves have been rather limited for the start of this month, however there are many crowded trades across the various asset classes - FX, debt, equity, and commodity markets - whose unwinding will surely trigger sharp moves in financial markets.
Expect Thursday's high profile meeting with President Trump and China counterpart China counterpart Xi to be more significant now that North Korea continues to defy U.S warnings to suspend its nuclear program with another missile test overnight.
In Europe, the results from France's second Presidential television debate seem to have reduced the demand for safe-haven bonds.
With Easter break around the corner and the reduced hope of U.S Congress moving forward on economic policy, market risk attractiveness continues to decrease.
1. Global stocks find support after holidays
Global equities rose as Chinese shares soared the most since August, while other markets fluctuated before a meeting between the U.S and China leaders.
Returning after two-days of holidays, the Shanghai Composite (+1.5%) was the best performing index in Asia overnight. Reports of a new special economic zone in Xiongan helped lift local property and industrials names. The Hang Seng rose +0.2%.
Note: The rally comes even as the PBoC continues to pull liquidity out of the market with no reverse repo operations for an eight consecutive day.
In Japan, the Nikkei share average gained (+0.3%) as the yen (¥110.94) rally paused, although investors remain cautions ahead of the U.S/China summit. The broader Topix index ended flat, while Australia's S&P/ASX 200 Index added +0.3%.
In Europe, equity indices are trading mixed. The DAX is underperforming weighed by shares of car manufacturers. Energy stocks are trading notably higher on higher oil prices. Homebuilder stocks are trading notably lower in the FTSE 100.
U.S stocks are set to open in the red (-0.1%).
Indices: Stoxx50 flat at 3,479, FTSE +0.2% at 7,335, DAX -0.3% at 12,245, CAC-40 flat at 5,102, IBEX-35 +0.4% at 10,401, FTSE MIB +0.1% at 20,276, SMI -0.1% at 8,640, S&P 500 Futures -0.1%
2. Oil hits one-month high on tighter supplies
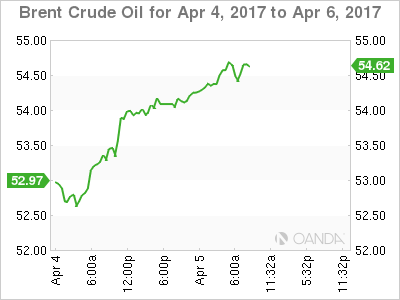
Ahead of the U.S open, oil has hit a one-month high near $55 a barrel as a drop in U.S. crude inventories Tuesday raised hopes that OPEC-led supply restraint is clearing a global glut. Also lending support is an outage at a U.K North Sea oilfield.
Note: API data yesterday reported that U.S. crude inventories fell by a more-than-expected -1.8m barrels last week. The focus is now on whether today's U.S government's supply report confirms the decline (10:30 am EST).
Brent crude futures have risen +50c to +$54.67 a barrel. It reached +$54.80 intraday, the highest since March 8, while U.S. crude (WTI) was up +47c at +$51.50.
Both benchmarks have recovered from last week's four-month lows on expectations that OPEC would manage to tighten supply by cutting production.
Nevertheless, global inventories remain stubbornly high and the market bears continue to bet that it will take months for oil prices to respond convincingly to lower OPEC output.
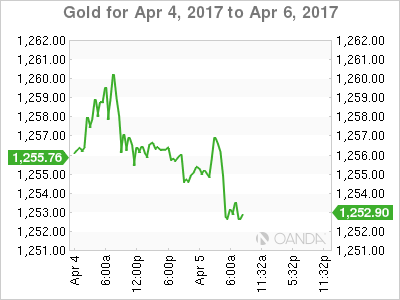
Gold prices are holding steady (+0.1% to +$1,256.38 per ounce) near one-month highs as appetite for riskier assets ease ahead of a meeting between U.S/China. Market focus is also turning towards the FOMC minutes; investors are looking for any clues on the pace of further U.S. interest rate rises.
3. Fixed income looks for Fed guidance
The demand for safer haven bonds has eased a tad overnight after a second televised debate of French presidential hopefuls. Early poll results suggest that Melenchon, Macron, Fillon and Le Pen showed the most convincing performance, but Mr. Macron seems to remain in front when it comes to voting preference. The 10-year German Bund yield is currently trading at +0.25%, unchanged from yesterday's close.
Note: Bund yields have declined from highs of almost +0.5% in March to current levels. Aside from political concerns in France, investors are paring their fears of a rate rise by the ECB.
U.S Treasury yields trade atop of their five-week lows. The yield on U.S 10's fell -1 bps to +2.35%, after rising +4 bps Tuesday. Expect the shape of the U.S curve to change after today's March FOMC minutes (2:00 pm EST).
Elsewhere, Aussie 10-year yields are flat at +2.61% after dropping -7 bps yesterday.
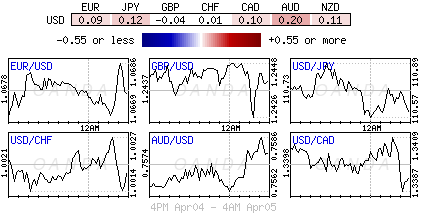
4. Dollar prices show caution
The FX market is retaining a cautious tone after North Korea fired a ballistic missile into the sea ahead of a two-day summit between U.S and Chinese leaders tomorrow.
The USD/JPY (¥110.94) is little changed ahead of the U.S open despite the traditional 'safe-haven status' of the yen in such a scenario. The U.K's pound (£1,2475) has found some early traction after this morning's U.K data for Mar. PMI services beat expectations (see below).
Note: Sterling watchers are currently following European Parliament members debate its position in the Brexit negotiations.
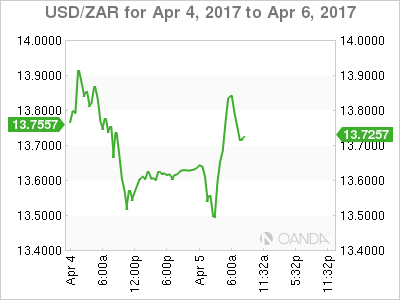
Elsewhere, the USD/ZAR ($13.8375) is +1.5% higher after reports that South African President Jacob Zuma again survived calls to resign by members of the ruling ANC.
5. Euro Services PMI's produce a mixed bag
Major European PMI's Services numbers remain in expansion, but most are succumbing to a slower pace - France and Eurozone are revised lower in their final readings, while the U.K handily beats expectations.
Despite hitting a 15-month high of 55.6 in March, Germany's services PMI highlights rising cost pressure in the sector due to higher wages and fuel prices. Input price inflation hit "a near-six year high," while output prices rise at the sharpest rate in three-years. The data underpin expectations of a pickup in economic growth during Q1.
In the U.K, the Services Sector was lifted by financial services. The headline print registered 55 in Mar., up from 53.3 in Feb. and the strongest reading in three-months. A weakened pound continues to aid exporters, however, quickening inflation is beginning to squeeze consumer-facing sectors. Businesses reported rising costs and tepid job growth.
Crude Oil Nears Resistance Ahead Of Inventories Report
Oil prices have rebounded since March 27, trading above the short term 10 and 20 SMAs on the 4-hourly chart. The rally was helped by OPEC’s consideration of a 6-month output cut extension, and a noticeable drop in EIA crude oil inventories figure (the week ending March 24).
Although OPEC member states have executed the output cut effectively since the agreement was made in December. However, the drop in oil supply has been slower than expected, mainly because the US shale oil industry has been thriving helped by the rising oil prices. Saudi Arabia’s energy minister has warned that 'no free ride' for non-OPEC oil producer competitors.
OPEC will likely decide whether to extend the output cut in their scheduled meeting on May 25 in Vienna. It was reported on March 30 that Kuwait and some other OPEC member states support an extension of output cut, providing oil prices some support. At present, the supply remains high, whether OPEC will extend output cut is still vague.
The trend of spot WTI remains bullish, as it still trades above the short term SMAs. However, the current price is nearing the short-term major resistance level at 52.00. The selling pressure is heavy above the level. Be aware that the bullish momentum is likely to be restrained here.
Both the 4-hourly and the daily Stochastic Oscillators are above 80, suggesting a retracement.
Crude oil inventory (the week ending Mar 31) will be released at 15:30 BST today – always a major influencer in Oil price volatility. It will likely cause volatility for oil prices.
The resistance level is at 52.00, followed by 52.50 and 52.80.
The support line is at 51.50, followed by 51.00 and 50.50.

