Sample Category Title
USDJPY: Set Eye On 110.00
'The foreign exchange market's main focus remains whether or not Trump can carry out his policies, and whether the U.S. economy will stay strong enough for the Fed to stick to the path of rate hikes.' – Sony Financial Holdings (based on Business Recorder)
Pair's Outlook
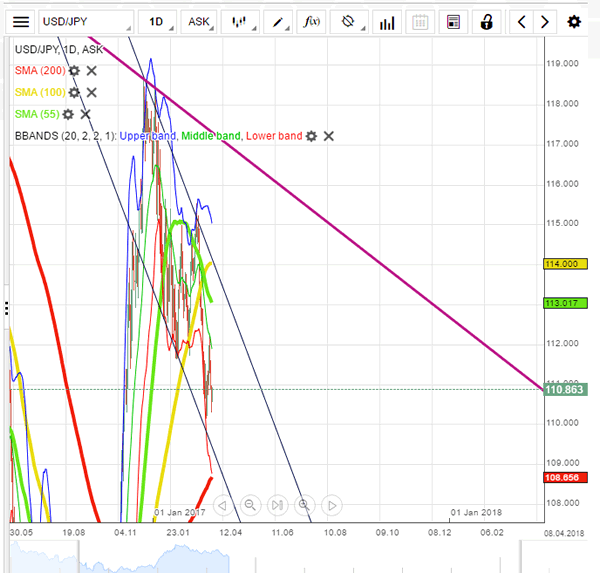
The US Dollar weakened against the Yen on Tuesday, marking a third consecutive decline. The pair is set for another leg down today, with the weekly S1 still acting as the nearest support at 110.27. This support, however, is unlikely to limit the losses should the US ADP Employment Change reading disappoint, with the 110.00 level open to exposure. Further below lies the descending channel's support line, bolstered by the weekly S2, the monthly S1 and the lower Bollinger band, all marking the expected intraday low. Meanwhile, technical indicators keep giving bearish signals, bolstering the possibility of the bearish scenario.
Traders' Sentiment
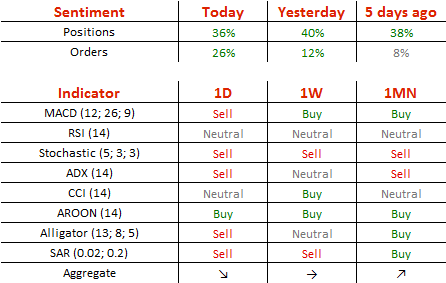
Today 68% of traders are long the Greenback (previously 70%), while 63% of all pending orders are to acquire the American Dollar.
GBPUSD: Set To Retest The Down-Trend
'We do not believe the USD will weaken through key technical and psychological levels in the coming month.' – HSBC (based on PoundSterlingLive)
Pair's Outlook
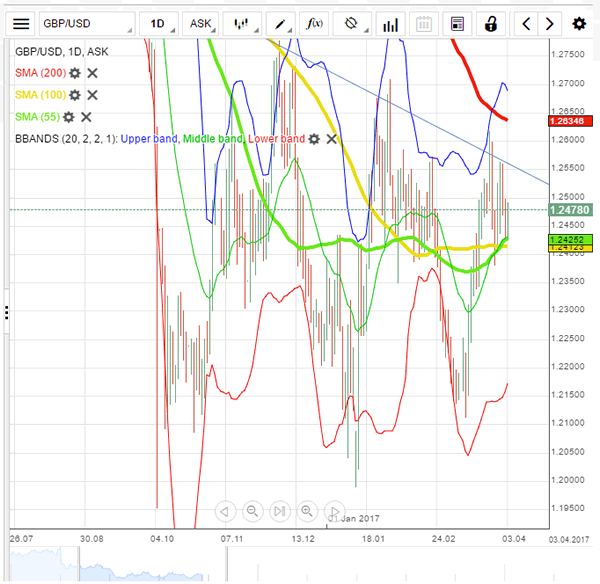
The Cable weakened for the second day in a row yesterday, finding support in front of the tough demand area, represented by the weekly S1, the monthly PP, the 55 and the 100-day SMAs. The same cluster is now also reinforced by the 20-day SMA, bolstering the chance the Sterling is to rebound today. Technical indicators are also in favour of the positive outcome. The GBP/USD pair could even surge back above 1.25 and put the six-month down-trend to the test again. However, downside risks also persist, a driver for which would be the ADP data later today.
Traders' Sentiment
Bullish traders' sentiment returned to its last Wednesday's level of 57%, whereas the share of purchase orders declined from 54 to 51% in the last 24 hours.
EUR/CAD Elliott Wave Analysis
EUR/CAD – 1.4451
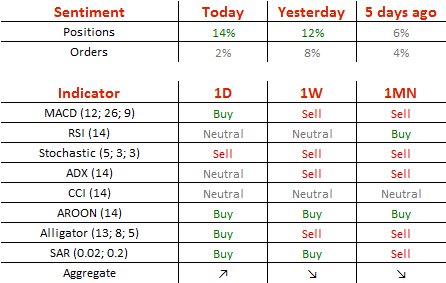
EUR/CAD: Wave 4 ended at 1.4380 and wave 5 as well as circle wave C has possibly ended at 1.2129, major (A)-(B)-(C) correction has commenced and indicated target at 1.6000 had been met.
Despite last week’s initial rise to 1.4600, the subsequent deeper-than-expected retreat suggests top has been formed there and consolidation below this level would be seen with mild downside bias for another test of last week’s low at 1.4176, break there would extend weakness to 1.4100, however, as broad outlook remains consolidative, reckon downside would be limited to 1.4000 and bring another rebound later.
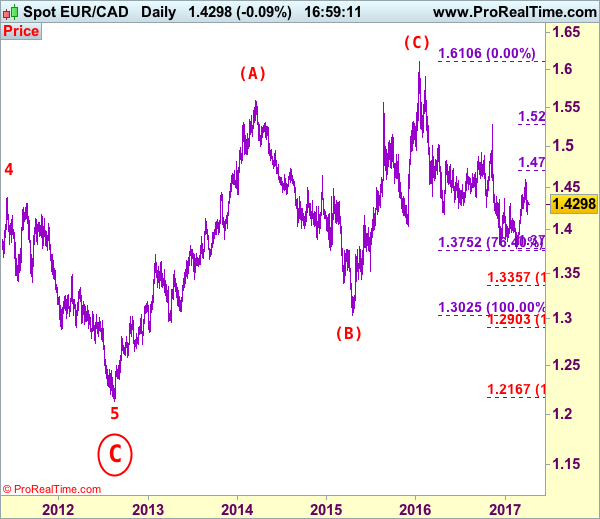
Our latest preferred count is that larger degree wave [C] from 1.3289 as well as circle wave B ended at 1.7509 in Dec 2008 with (A): 1.6325, (B): 1.4719 followed by wave (C) at 1.7509, hence circle wave C is unfolding with wave 1 ended at 1.5186 (diagonal wave 1), wave 2 at 1.6096, impulsive wave 3 has ended at 1.2451, followed by wave 4 at 1.4380, in view of recent strong rebound, we are now treating the wave 5 as well as larger degree circle wave C has ended at 1.2129, hence (A)-(B)-(C) correction has commenced from there with impulsive wave (C) now unfolding and indicated initial upside target at 1.6000 had been met and reckon 1.6500 would hold.
On the upside, whilst initial recovery to 1.4350 and 1.4400 cannot be rule out, reckon upside would be limited and 1.4500-10 would hold from here, bring another retreat later. Above 1.4550-60 would bring test of said resistance at 1.4600 would revive bullishness and extend the rise from 1.3784 low for further gain to 1.4710 (61.8% Fibonacci retracement of 1.5282-1.3784) and later towards 1.4800.
Recommendation: Stand aside for this week.
On the bigger picture, our long-term count on the monthly chart is that a big sideways consolidation from 2000 low of 1.2557 has possibly ended at 1.7509 as circle wave B with [A]: 1.6976 ( (A): 1.4513, (B): 1.2612, (C): 1.6976), wave [B]: 1.3289 is a double three with 1st a-b-c: 1.5384, x: 1.6709 and 2nd a-b-c: 1.3289. As indicated above, the wave [C] has ended at 1.7509. The selloff from there is now unfolding which itself should be labeled as an impulsive wave with wave 1: 1.5186 (diagonal wave 1), followed by wave 2: 1.6096 and wave 3: 1.2451, wave 4: 1.4380, wave 5 as well as larger degree circle wave C has possibly ended at 1.2129 and major correction has possibly commenced for retracement of recent decline towards 1.4000, then 1.4180-90 (38.2% Fibonacci retracement of 1.7509-1.2129). Below said support at 1.2129 would risk weakness to psychological support at 1.2000 and then 1.1851 (50% projection of 1.7509-1.2451 measuring from 1.4380) but reckon 1.1500 would remain intact, bring reversal later.
EURUSD: Attempts To Break Resistance
'In reality Madame Le Pen has no economic policy.' – Francois Fillon (based on Bloomberg)
Pair's Outlook
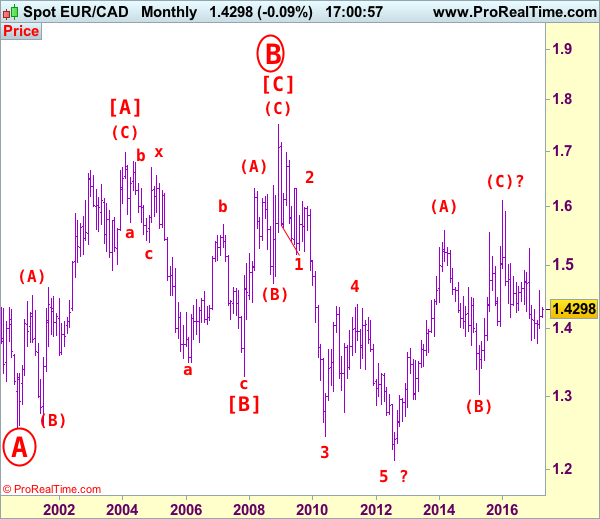
During the early hours of Wednesday's trading session the common European currency attempted to break the resistance against the US Dollar put up by the monthly pivot point at the 1.0685 level. The attempt failed and the currency exchange rate retreated to trade below the 55-day SMA, which was located at the 1.0674 mark. Due to the facts that the pair now faces a strong resistance, and the range of almost 50 base points is almost free below it, a decline of the currency pair is expected. The pair is likely set to decline once more to the 23.60% Fibonacci retracement level, which is located at the 1.0639 level.
Traders' Sentiment
SWFX traders remain bearish on the pair, as 56% of open positions are short. Meanwhile, trader set up orders are neutral.
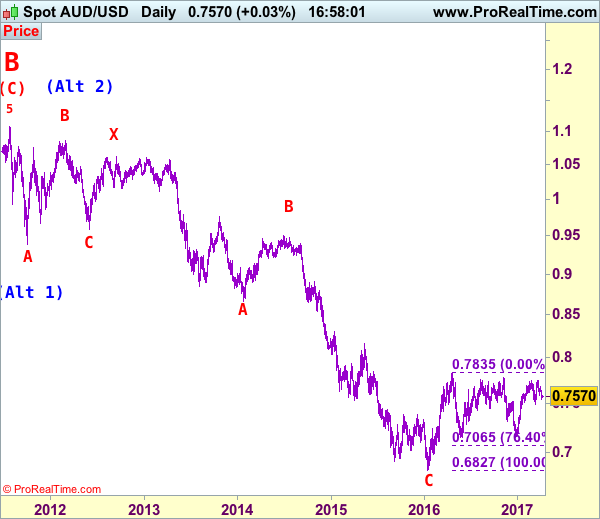
AUD/USD Elliott Wave Analysis
AUD/USD – 0.7574
AUD/USD – Wave 5 of C and (B) has possibly ended at 1.1081
Although aussie met resistance at 0.7680 last week and has slipped again, retaining our view that further consolidation would take place and marginal weakness from here cannot be ruled out, however, reckon 0.7540-45 would limit downside and bring rebound later, above resistance at 0.7680 would suggest low is possibly formed but break of indicated resistance at 0.7750 is needed to extend recent rise from 0.7158 to previous chart resistance at 0.7778. Having said that, a break there is needed to retain bullishness and signal another leg of major corrective upmove from 0.6827 low is underway for headway to 0.7835 resistance first, then 0.7900, however, psychological resistance at 0.8000 should hold from here.
We are keeping our count that top has been formed at 1.1081 (wave 5 of V) and major correction (A-B-C-X-A-B-C) has commenced, indicated downside targets at 0.7945 (61.8% Fibonacci retracement of entire rise from 0.6007-1.1081) and 0.7750 had been met and downside bias is seen for further weakness to 0.6800, then 0.6700 but reckon 0.6500 would hold from here.
Our preferred count is that the rally from 0.6007 to 0.7270 (7 Jan 2009) is marked as wave A, the retreat to 0.6248 (2 Feb 2009) is wave B and the subsequent upmove is labeled as wave C with wave (iii) and wave (iv) ended at 0.8265 and 0.7700 respectively and wave (v) as well as 3 ended at 0.9407, then wave 4 ended at 0.8066 (instead of 0.8578). The wave 5 has met our indicated projection target of 1.1060 and could ended at 1.1081, this level is now treated as the peak of wave (C) as well as larger degree wave B, hence major fall in wave C has commenced, our initial downside target at psychological support at 0.7000 has just been met and further weakness to 0.6500 would be seen later.
On the downside, expect pullback to be limited to 0.7540-45 and bring another rise later. Only a drop below indicated support at 0.7491 would abort and signal the aforesaid rise from 0.7158 has ended, bring further fall to 0.7450, then towards 0.7400.
Recommendation: Hold long entered at 0.7600 for 0.7800 with stop below 0.7550
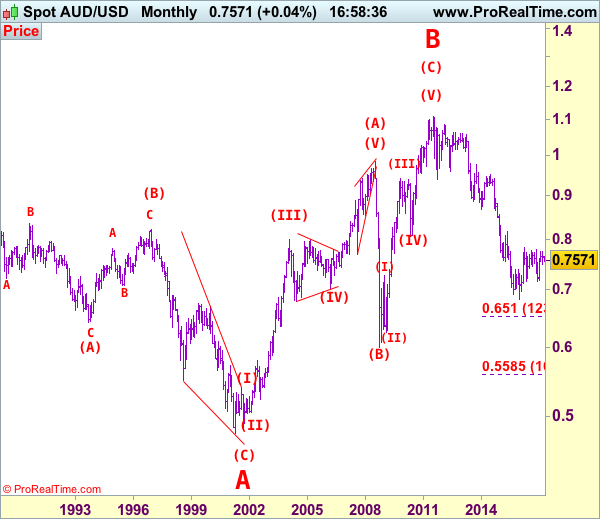
Our alternate count on the daily chart treated the top formed in 2008 at 0.9851 could be a larger degree wave I and was followed by a deep and sharp correction in wave II to 0.6007 and wave III is unfolding from there.
The long-term uptrend started from 0.4775 (2 Apr 2001) with an impulsive structure. Wave I is labeled as 0.4775 to 0.9851 (15 Jul 2008), wave II has ended at 0.6007 (Oct 2008) and wave III is still in progress which may extend further gain to 1.1265.
How Will FOMC Minutes And US ISM Data Affect USD ?
The dollar index hit a 3-week high of 100.59 yesterday. However, it pulled back after testing the near-term major resistance at 100.50. It currently holds above the support level at 100.30. The crucial US ISM figure will be released this afternoon at 15:00 BST; the non-manufacturing PMI (Mar). This data release will affect USD and USD crosses. US ISM non-manufacturing PMI readings have kept above 50 since February 2010, showing the service sector remains sound.
US ISM manufacturing PMI released on Monday has seen an uptrend since September 2016. The latest figure for March, released on Tuesday, was 57.2 which saw the 94th straight month above 50 indicating the manufacturing sector is still expanding. However, the figure was lower than the previous figure of 57.7. It saw a slowdown for the first time since September 2016 caused by a rise of production costs.
Although rising prices weigh on the manufacturing sector it has pushed inflation up to the Fed's 2% target. The PCE (YoY) inflation figure for February rose to 2.1% which was the first time above 2% for the past five years.
The UK Markit services PMI (March) will be released at 09:30 BST today. This figure has seen an uptrend since August 2016, however, it has declined since January 2017. GBP/USD has retraced in the past two days; the current price holding above the near-term major support line at 1.2400. The service sector accounts for over 80% of the UK economy, the UK service PMI released today will likely affect GBP and GBP crosses.
This afternoon we will see a series of important US data released – be aware that it will likely cause volatility for USD and USD crosses. ADP employment change (March) at 13:15 BST, which is regarded as a prediction of the non-farm payrolls (March) released this Friday. The Markit services and composite PMIs (Mar) at 14:45 BST. Most importantly we see the release of ISM non-manufacturing PMI (Mar) at 15:00 BST. Crude oil inventory (the week ending Mar 31) is also released at 15:30 BST – always a major influencer in Oil price volatility.
The FOMC minutes will be released this evening at 19:00 BST. The Fed raised rates in the March 15 meeting. Recently several Fed officials have commented on prospective rate hikes, mostly in an optimistic tone, with the likelihood of two more rate hikes by the end of the year. We will likely get more clues about the probability of a rate hike in upcoming FOMC meetings and from the resulting minutes. Per the CME's FedWatch tool the probability of a rate hike in June is around 59%.
The first Trump-Xi meeting is scheduled for Thursday April 6; be aware that this political event will likely outweigh the economic data performance.
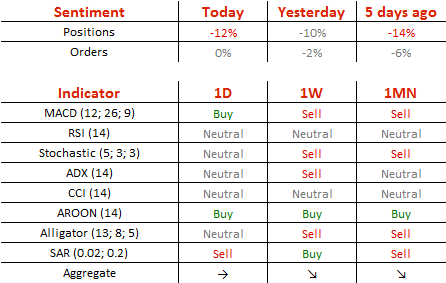
Technical Outlook: AUDUSD Is Consolidating Above 200SMA – Bears Look For Break Lower
The Aussie extended weakness deep in the daily cloud on strong four-day bearish acceleration from 0.7677 (30 Mar lower top) that hit low at 0.7543 but so far failing to close below pivot at 0.7548 (200SMA) and generate another bearish signal. The pair is riding on the third wave of five-wave cycle from 0.7747 high that is eyeing target at 0.7528 (Fibonacci 100% expansion) and could extend towards 0.7472 (FE 138.2%) on break below other strong supports at 0.7507 (100SMA) and 0.7489 (09 Mar low). Daily studies are negative and favor further weakness, as formation of daily Tenkan-sen/Kijun-sen bear cross maintains bearish pressure. Consolidation above 200SMA could be anticipated, with initial barrier at 0.7585 (session high) and extended upticks expected to hold below daily Tenkan-sen (0.7610).
Res: 0.7585, 0.7610, 0.7618, 0.7638
Sup: 0.7548, 0.7528, 0.7507, 0.7489
Technical Outlook: USDJPY – Hourly Cloud Limits Recovery Attempts And Keeps Bearish Bias
The pair maintains bearish bias despite yesterday's Hammer that could be seen as initial reversal signal. Bounce from yesterday's low at 110.25 remains capped under thick falling hourly Ichimoku cloud (spanned between 110.77 and 111.25) and suggests consolidation before final attempts below key 110.00 support zone. Firm bearish setup of daily studies supports scenario. However, attack at 110.00 zone may be delayed on extension above hourly cloud and Friday's close above weekly cloud top (111.36)
Res: 110.77, 111.05, 111.14, 111.36
Sup: 110.52;110.25, 110.09, 109.91
Technical Outlook: Cable – Bears Are Pausing Ahead UK Data
Cable is consolidating above 100SMA (1.2413) which so far contained strong two-day fall from 1.2553 high. Recovery attempts were so far limited, keeping the downside at risk, as the pair is awaiting UK Services PMI data for fresh signals. Negative tone is prevailing on near-term studies and could be boosted if UK data disappoint. This could result in final break below 100SMA and attack at next supports at 1.2360 (daily Kijun-sen) and 1.2345 (daily cloud base), loss of which would generate strong bearish signals. At the upside, key barriers lay at 1.2494/97 (daily Kijun-sen / Ichimoku cloud top) and only sustained break above would sideline downside threats. Daily cloud is narrowing and lowering tops continue to weigh.
Res: 1.2446, 1.2494, 1.2529, 1.2553
Sup: 1.2413, 1.2390, 1.2374, 1.2360
Technical Outlook: EURUSD – Reversal Signals Need Sustained Break Above 1.0700 Pivot For Confirmation
Repeated failure to close below 1.0650 Fibo 61.8% support, despite yesterday’s marginally lower low at 1.0634, signal strong hesitation ahead of key supports at 1.0622 (100SMA / daily cloud top).
Long lower shadows of daily candles of past two days suggest possible basing attempt, as Tuesday’s trading was shaped in Hammer candle.
The notion is supported by slow stochastic reversal from oversold territory.
However, bounce was so far unable to clearly break above 55SMA (1.0672), despite upticks to 1.0683 (session high), keeping upper pivot at 1.0700 (daily Kijun-sen) intact for now.
Close above 1.0700 is needed to generate firmer bullish signal for stronger correction of the downleg from 1.0905 (27 Mar high).
Conversely, prolonged consolidation under 1.0700 could be expected ahead of fresh push lower.
Res: 1.0683, 1.0700, 1.0721, 1.0737
Sup: 1.0665, 1.0650, 1.0634, 1.0622