Sample Category Title
Canada Posts A Surprise Trade Deficit In February
For the 24 hours to 23:00 GMT, the USD rose 0.1% against the CAD and closed at 1.3397.
The Canadian Dollar lost ground, after Canada surprisingly posted an international merchandise trade deficit of C$0.97 billion in February, following a revised surplus of C$0.42 billion in the previous month, whereas markets were expecting the nation to record a surplus of C$0.60 billion.
In the Asian session, at GMT0300, the pair is trading at 1.3392, with the USD trading a tad lower against the CAD from yesterday’s close.
The pair is expected to find support at 1.3358, and a fall through could take it to the next support level of 1.3323. The pair is expected to find its first resistance at 1.3441, and a rise through could take it to the next resistance level of 1.3489.
The currency pair is trading between its 20 Hr and 50 Hr moving averages.

Further Losses Coming Down The Line For The New Zealand Dollar
Key Points:
- Long-term ABC wave could carry the pair substantially lower.
- MACD signal line hinting at a continuation of the long-term downtrend.
- Current support could present a challenge to this forecast.
The Kiwi Dollar's losses may still have a ways to go before the long-term downtrend finally releases the pair. Specifically, we could even see the 0.6668 handle in the crosshairs as the final stages of a corrective wave take place over the coming week. As a result, it's likely to be worth one's while to take a closer look at this generally embattled pair.
First and foremost, whilst the downtrend thatbegan in February probably hasn't gone unnoticed by many, the fact that this might simply be the latest leg of a much larger pattern may be news to some. In particular, it looks as though this most recent slide represents the 'C' leg of a broader corrective ABC wave that took hold in the wake of the last year'supswing. As for what this could mean moving forward, it now looks as though losses for the NZDUSD could extend far beyond where we might have initially expected them to
Indeed, chart patterns aside, a number of other instruments seem to be in favour of an overall bullish phase for the Kiwi Dollar in the weeks and months to come. Namely, we have the parabolic SAR firmly in bearish territory which would usually predispose the pair to move lower moving ahead. Of course, this is in line with the EMA bias which is highly indicative of downside risks. However, the most telling insight comes from the MACD oscillator which is on the verge of seeing a full signal line crossover which would typically precede a notable downtrend.
Despite this rather compelling argument for further losses, an important level of indication to keep an eye on is the 0.6956 mark. Predominantly, the presence of a rather well-tested reversal point is casting some doubt of continued losses in the near-term. However, this price also corresponds with the 76.8% Fibonacci retracement which could also add to fears of a short ranging phase prior to any further downside action. Ultimately, this level should givein, especially if the US fundamental data continues to come in above expectations in the coming sessions so monitor the NFP figures closely moving ahead.
Overall, the technical case for the above forecasted downtrend seems to have some legs, in this author's opinion at least. As a result, keep a close eye on the Kiwi Dollar over the coming sessions as it could present us with substantial downside potential. Moreover, monitor the fundamental front as any major uptick in the US data could be all that is needed to see the current support smashed and get this downtrend kick started.
Will Crude Oil (WTI) Prices Decline As Libyan Exports Come Back Online?
Key Points:
- Libyan 'Force Majeure' event ceases.
- Russia meets around 66% of their pledged production cuts.
- Medium term outlook on oil remains unchanged with Q2 estimate of $47.20-$48.40.
Crude Oil prices largely headed in a positive direction last week as the market was beset by the risk of falling production following, what was termed, a 'Force Majeure' event. Subsequently, West Texas Intermediate (WTI) prices received an immediate boost and rallied back above the $50.00 handle. However, we now know that the event was largely due to warring factions blocking access to Libyan pipelines and that supply might have just been restored. Subsequently, it begs the question as to whether crude prices will face pressure as the additional supply returns to the global markets.
The return of the Shahara and Wafa oil fields to full production is definitely an unexpected surprise and required significant intervention following their blockading by armed factions early last week. The overall impact on Libyan crude oil production was stark given that those two fields represent around 36% of the embattled countries current output. Subsequently, the return of around 252k b/pd of crude production to the world markets is likely to have an immediate impact on prices.
However, although there is likely to be additional downward pressure on Crude Oil prices, Libya is likely to remain relatively unstable in the face of ongoing warfare amongst the various militias. Subsequently, it is highly likely that there will be further supply disruptions over the medium term until some form of government is re-established within the war torn state. The current regimes output goals remain focused on increasing productive capacity to 1.1 million b/pd within 2017 but that supply is likely to remain unstable at best.
In contrast, Russia is following through with much of their purported production cuts and, at last count, has cut over 200k b/pd, about two thirds of their original pledge. Although, the target for the OPEC and non-OPEC agreed cuts remains in place it seems difficult to foresee many nations fully reaching the pledged levels. Subsequently, there could be significant pressure on producers to cheat on the original agreement, or at least reduce their commitments, given the present levels of compliance by other nations. As always with OPEC deals, the devil is in the details and most members are not known for their adherence to cartel targets.
Subsequently, although crude oil prices might currently be residing around the $51.20 a barrel price (WTI), the old pressures of rebalancing are likely to return in the near term. Therefore, our medium term forecasts remain in place for WTI prices to return to the $47.20 - $48.400 level by the end of Q2, 2017. Rebalancing must still occur within the market and OPEC needs to get on board and realise that the new oil order is upon us.
Daily Technical Outlook And Review: EUR/USD, GBP/USD, USD/JPY, AUD/USD, USD/CAD, XAU/USD, WTI
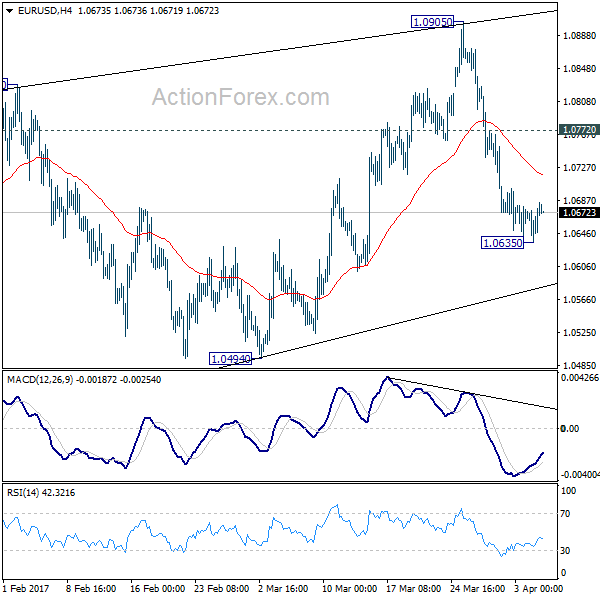
EUR/USD
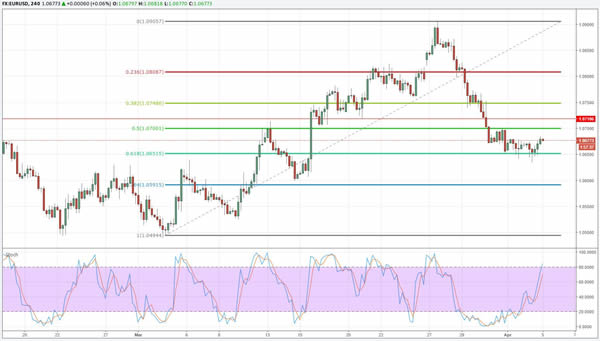
Price has bounced slightly overnight. While the outlook remains negative, the currency pair does look oversold in the short-term. Initial resistance is noted at 1.07, with stronger resistance then seen at 1.0718 and 1.0750 (38.2 % Fibonacci of the March Rally).
A rally to one of those aforementioned levels is likely to attract decent selling interest.
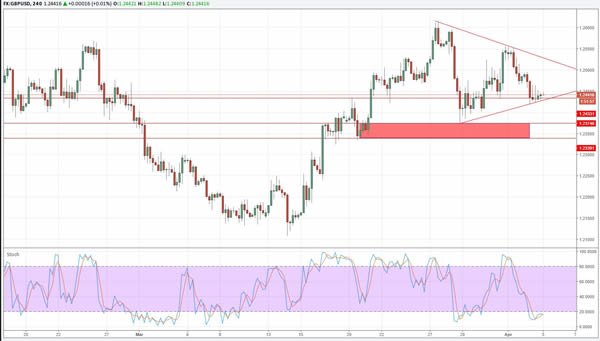
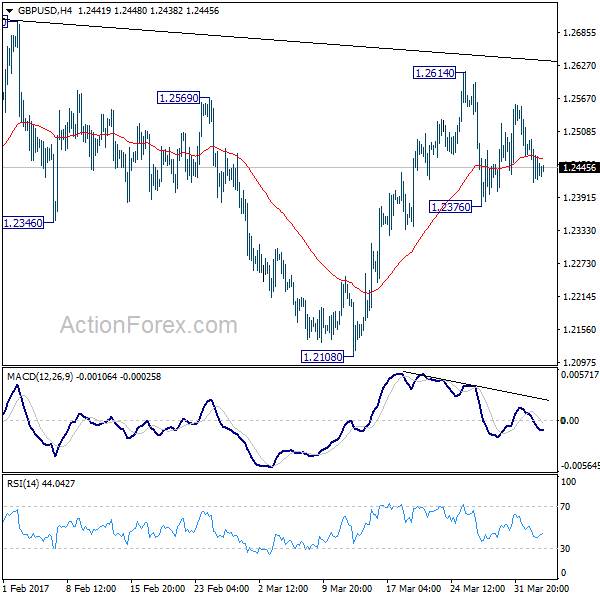
GBP/USD
The Cable came under pressure yesterday and broke below 1.2465 support. The currency pair extended losses to 1.2420, and while it bounced from there, it still lacks momentum for a larger recovery.
Should GBP/USD break below the trendline support and 1.2420, a test of the key 1.2340-75 area seems likely. The pair is likely to encounter strong support there, and buying it there seems attractive given the risk-reward.
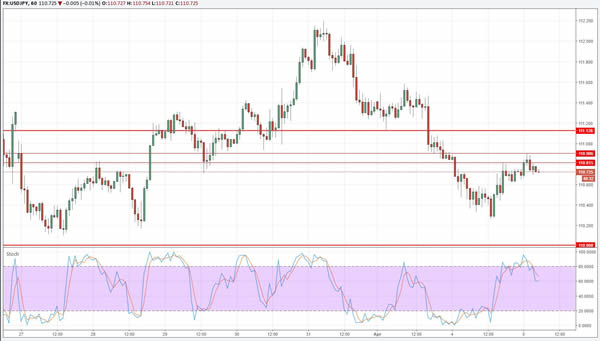
USD/JPY
The Yen has recovered slightly in the past 12 hours of trading, but struggled with resistance in the 110.80-90 area. The short-term outlook remains negative, and selling rallies still the appropriate strategy.
Keep an eye on the 111.12 level, as USD/JPY is likely to encounter strong resistance there. A test of 110 seems likely in the near-term. Should the pair break below, downside momentum will accelerate sharply and a decline towards 108 is possible.
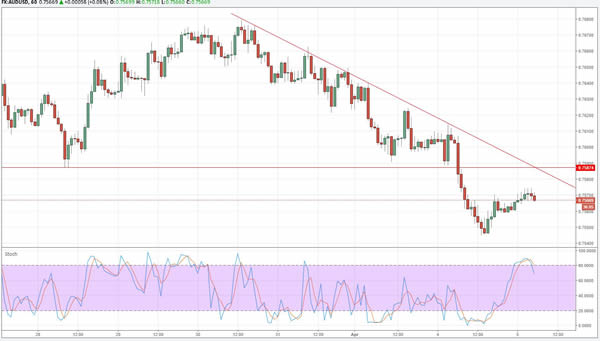
AUD/USD
Fell sharply after the RBA rate decision yesterday and remained under pressure during the rest of the day. Former support between 0.7580 and 0.7590 is now an interesting selling area for AUD bears.
Selling the Aussie Dollar there with a stop above 0.7610 could be an option. The currency pair has immediate support in form of the 200 DMA around 0.7550, but the next important level now lies at 0.7490.
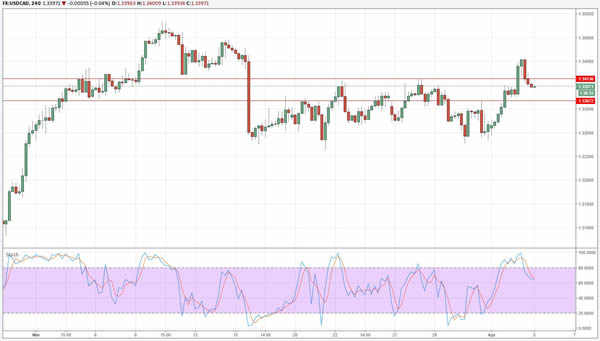
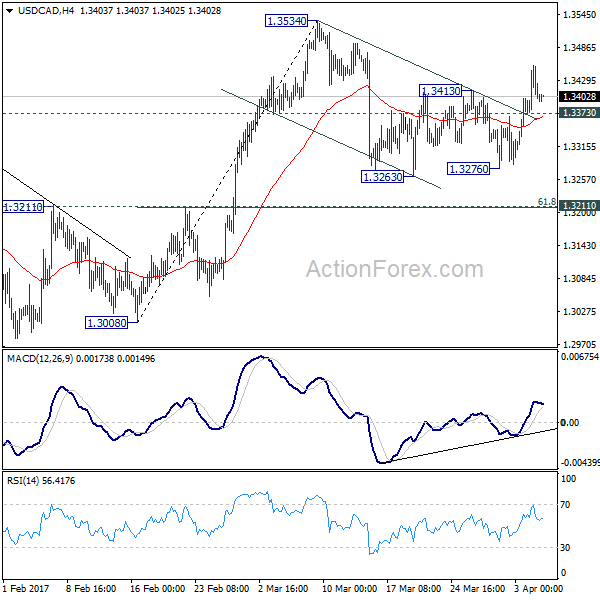
USD/CAD
Price has gathered some positive momentum in the past two trading days. This comes after a period of consolidation in a 1.33-1.34 range. However, the currency pair failed to sustain gains above 1.34 and yesterday's candle on the Daily chart suggests a fake breakout.
The level to watch intraday is 1.3367 support. Should it fall back below this level, the fake breakout would be confirmed and a move towards the lower side of the range is highly likely.
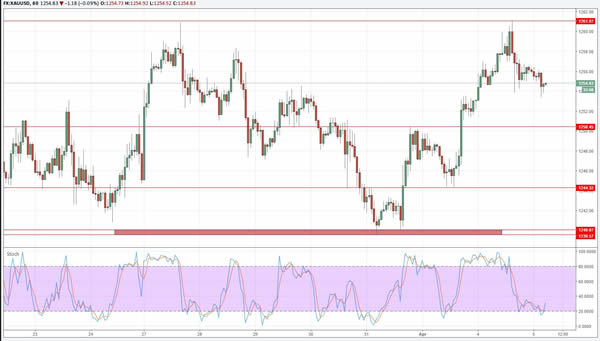
XAUUSD
Gold failed once again at $1260-62 resistance yesterday. Nevertheless, momentum is still strong and demand should be good on any larger dip. $1240 is key – a break below that level would signal that Gold currently lacks the strength to clear resistance above $1260, and that a deeper correction is needed.
This seems unlikely at this point, though. Intraday, look at the $1250 and $1244 levels for good support.
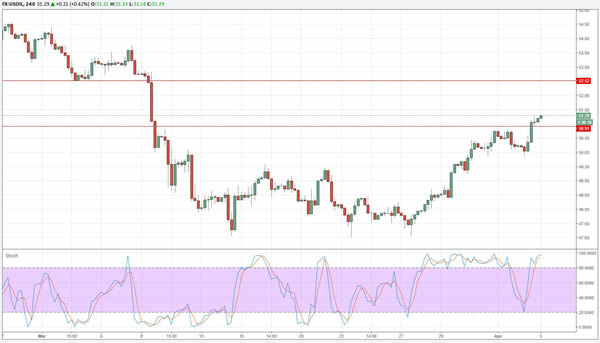
WTI
WTI is showing increased strength. While the hourly charts suggest that the commodity is slightly overbought in the short-term, it will likely continue the rally towards $52.50 without any large pullback. Intraday, keep an eye on $50.90, which should act as solid support now.
For WTI bulls, buying here might be an option, as there is now little resistance until $52.50.
AUD/USD Daily Outlook
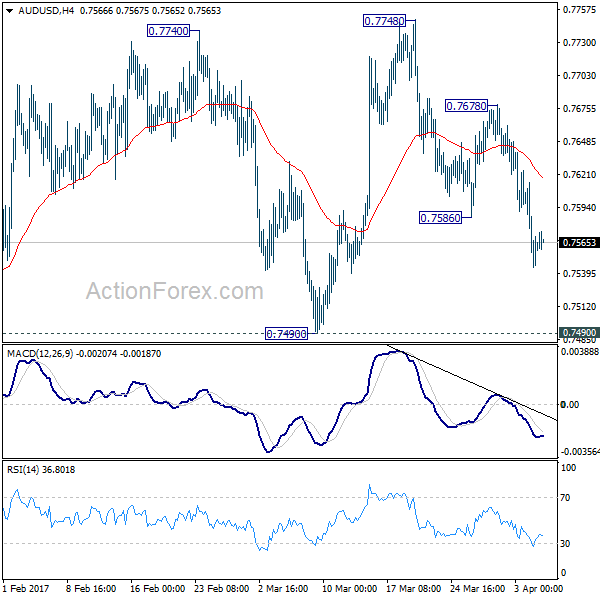
Daily Pivots: (S1) 0.7534; (P) 0.7574; (R1) 0.7604; More...
Intraday bias in AUD/USD remains on the downside as fall from 0.7748 should target 0.7490 support first. Firm break of 0.7490 will confirm completion of rise from 0.7158. In such case, near term outlook will be turned bearish for 0.7158 support. On the upside, however, above 0.7678 minor resistance will turn bias back to the upside. And in this case, rise from 0.7159 could extend towards long term retracement level at 0.7849 before completion.
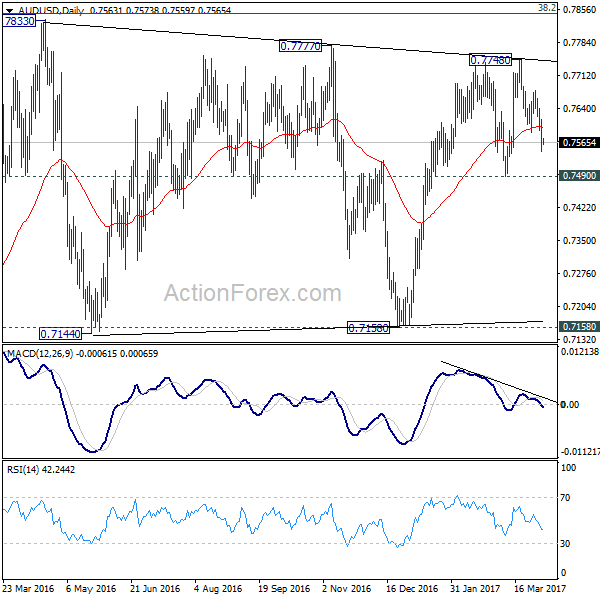
In the bigger picture, we're still treating price actions from 0.6826 low as a correction. And, as long as 38.2% retracement of 0.9504 to 0.6826 at 0.7849 holds, long term down trend from 1.1079 is expected to resume sooner or later. Break of 0.6826 low will target 0.6008 key support level. However, firm break of 0.7849 will indicate that rise from 0.6826 is developing into a medium term rebound, rather than a sideway pattern. In such case, stronger rise should be seen to 55 month EMA (now at 0.8165) and above.
USD/CAD Daily Outlook
Daily Pivots: (S1) 1.3365; (P) 1.3410; (R1) 1.3448; More....
Intraday bias in USD/CAD remains mildly on the upside for the moment. The corrective decline from 1.3534 should have completed already. Further rise would be seen to retest 1.3534 resistance first. Break will extend whole rise from 1.2698 to 1.3598 resistance. On the downside, below 1.3373 minor support will turn bias back to the downside and could extend the correction from 1.3534 with another fall. But we'd expect strong support from 1.3211 cluster level (61.8% retracement of 1.3008 to 1.3534 at 1.3209) to contain downside and bring rebound. Overall, medium term rebound form 1.2460 is still expected to extend through 1.3598.
In the bigger picture, price actions from 1.4689 medium term top are seen as a correction pattern. The first leg has completed at 1.2460. The second leg from 1.2460 is likely still in progress and could target 61.8% retracement of 1.4689 to 1.2460 at 1.3838. We'd look for reversal signal there to start the third leg. Break of 1.2968 will argue that the third leg has already started and should at least bring at retest of 1.2460 low. However, sustained trading above 1.3838 would pave the way to retest 1.4689 high.

European Open Briefing: Quiet Trading Session In Asia
Global Markets:
- Asian stock markets: Nikkei down 0.10 %, Shanghai Composite gained 1.05 %, Hang Seng declined 0.40 %, ASX 200 lost 0.15 %
- Commodities: Gold at $1257 (-0.10 %), Silver at $18.25 (-0.40 %), WTI Oil at $51.30 (+0.55 %), Brent Oil at $54.40 (+0.45 %)
- Rates: US 10 year yield at 2.35, UK 10 year yield at 1.07, German 10 year yield at 0.27
News & Data:
- Australian AIG Services Index Mar: 51.7 (prev 49.0)
- Japanese Nikkei PMI Services Mar: 52.9 (prev 51.3)
- Japanese Nikkei PMI Composite Mar: 52.9 (prev 52.2)
- New Zealand ANZ Commodity Price Index (MoM) Mar: 0.4% (prev 2.0%)
- South Korean BoP Current Account Balance (USD) Feb: 8400.2M (prev 5377.8M)
- South Korean BoP Goods Balance (USD) Feb: 10545M (prev 7814M)
- UK BRC Shop Price Index (YoY) Mar: -0.8% (exp -0.8%; prev -1.0%)
- PBoC Fixes USDCNY Reference Rate At 6.8906 (prev fix 6.8993 prev close 6.8835)
- Asian stocks rise as China gains; oil up on North Sea outage – RTRS
- Oil rises on signs of gradual tightening in global supply – RTRS
Markets Update:
Another quiet trading session in Asia. There were only minor movements in the major currency pairs. USD/JPY reached a high of 110.90 in the early session, inspired by gains in the Japanese stock markets. However, the pair came under pressure shortly after the Shanghai Open and eventually declined back to 110.50. The short-term outlook is negative and a test of 110 should follow soon.
The Australian Dollar bounced off the 200 DMA around 0.7550, but failed to recover much. Support there looks fragile, and a test of 0.75 seems likely in the near-term. The Aussie Dollar is suffering from weak risk appetite in the markets, and the slightly dovish RBA minutes yesterday increased the pressure on the currency.
Upcoming Events:
- 08:45 GMT – Italian Services PMI
- 08:50 GMT – French Services PMI
- 08:55 GMT – German Services PMI
- 09:00 GMT – Euro Zone Services PMI
- 09:30 GMT – UK Services PMI
- 13:15 GMT – US ADP Nonfarm Employment Change
- 14:45 GMT – US Markit Services PMI
- 15:00 GMT – US ISM Services PMI
- 15:30 GMT – US Crude Oil Inventories
- 19:00 GMT – FOMC Meeting Minutes
EUR/USD Daily Outlook
Daily Pivots: (S1) 1.0646; (P) 1.0662 (R1) 1.0688; More....
A temporary low is in place at 1.0635 in EUR/USD with 4 hour MACD staying above signal line. Intraday bias is turned neutral for consolidation. Recovery should be limited by 1.0772 resistance and bring another decline. As noted before, corrective rise from 1.0339 is completed at 1.0905. And more importantly, larger down trend is probably resuming. Below 1.0635 will turn bias back to the downside for 1.0494. Break will confirm this bearish case and target 1.0339 low. However, above 1.0772 will delay this bearish case and bring another rise back to 1.0905 first.
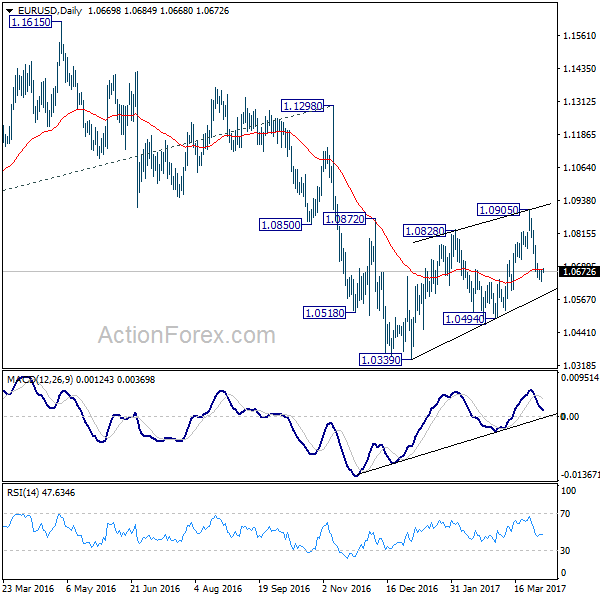
In the bigger picture, as long as 1.1298 key resistance holds, whole down trend from 1.6039 (2008 high) is still expected to continue. Break of 1.0339 low will send EUR/USD through parity to 61.8% projection of 1.3993 to 1.0461 from 1.1298 at 0.9115. However, considering bullish convergence condition in weekly MACD, break of 1.1298 will indicate term reversal. this would also be supported by sustained trading above 55 week EMA.
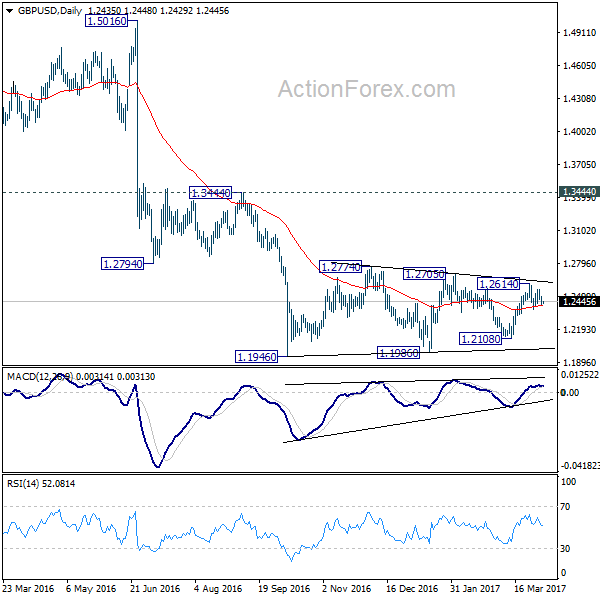
GBP/USD Daily Outlook
Daily Pivots: (S1) 1.2407; (P) 1.2451; (R1) 1.2483; More...
The consolidation in range of 1.2376/2614 continues in GBP/USD. Intraday bias remains neutral for the moment. Overall, price actions from 1.1946 are viewed as a consolidation pattern pattern. On the downside, break of 1.2376 will turn bias to the downside for 1.2108 support. Decisive break there will be an early sign of larger down trend resumption. On the upside, break of 1.2614 will extend the rise from 1.2108. But upside should be limited by 1.2705/2774 resistance zone to bring larger down trend resumption eventually.
In the bigger picture, fall from 1.7190 is seen as part of the down trend from 2.1161. There is no sign of medium term reversal yet. Sustained trading below 61.8% projection of 2.1161 to 1.3503 from 1.7190 at 1.2457 will target 100% projection at 0.9532. Overall, break of 1.3444 resistance is needed to confirm medium term bottoming. Otherwise, outlook will remain bearish.
USD/CHF Daily Outlook
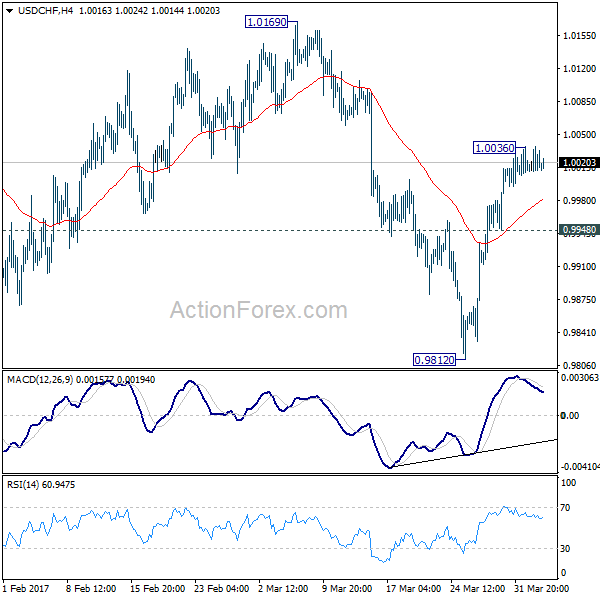
Daily Pivots: (S1) 1.0006; (P) 1.0022; (R1) 1.0032; More.....
Intraday bias in USD/CHF remains neutral for consolidation below 1.0036 temporary top. Overall, we're holding on to the view that corrective decline fall from 1.0342 should have finished with three waves down to 0.9812 already. Break of 1.0036 will turn bias to the upside for 1.0169 resistance. Break there will confirm this bullish case and target a test on 1.0342 high. On the downside, however, below 0.9948 minor support will turn bias back to the downside for 0.9812 instead.
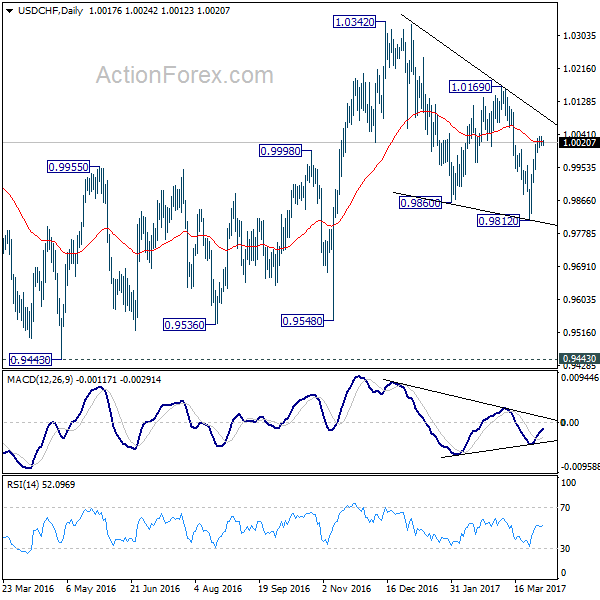
In the bigger picture, USD/CHF is staying in medium term sideway pattern between 0.9443/1.0342. In any case, decisive break of 1.0342 resistance is needed to confirm underlying strength. Otherwise, we'll stay neutral in the pair first. In case of another fall, we'd expect strong support from 0.9443/9548 support zone.