
Sample Category Title
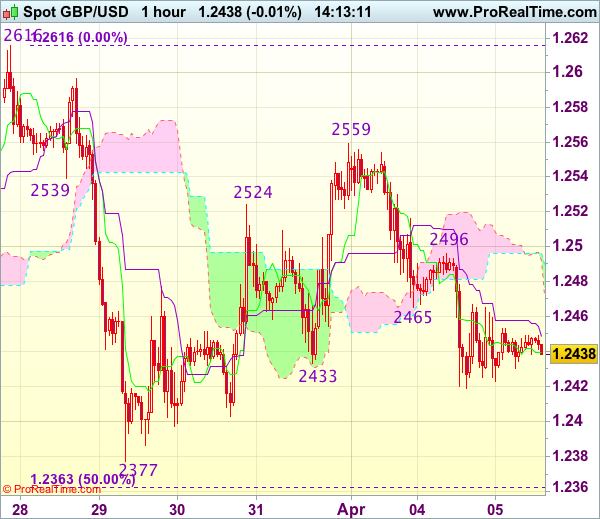
Trade Idea : GBP/USD – Hold short entered at 1.2465
GBP/USD - 1.2445
Most recent candlesticks pattern : N/A
Trend : Near term down
Tenkan-Sen level : 1.2438
Kijun-Sen level : 1.2449
Ichimoku cloud top : 1.2496
Ichimoku cloud bottom : 1.2492
Original strategy :
Sold at 1.2465, Target: 1.2365, Stop: 1.2500
Position : - Short at 1.2465
Target : - 1.2365
Stop : - 1.2500
New strategy :
Hold short entered at 1.2465, Target: 1.2365, Stop: 1.2500
Position : - Short at 1.2465
Target : - 1.2365
Stop : - 1.2500
Outlook remains mildly bearish for the fall from 1.2559 to extend weakness to 1.2400, however, break there i needed to add credence to our view that the rebound from 1.2377 has ended at 1.2559, bring further fall towards support at 1.2377. Looking ahead, only a drop below 1.2377 would confirm the fall from 1.2616 is still in progress for subsequent decline towards key support at 1.2335.
In view of this, we are holding on to our short position entered at 1.2465 but one should exit on such decline. Only break of said resistance at 1.2496 would abort and suggest an intra-day low is formed instead, risk a stronger rebound to 1.2525-30.
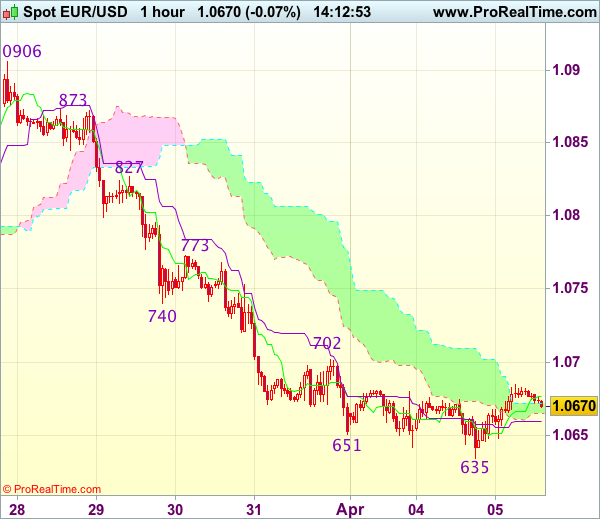
Trade Idea : EUR/USD – Sell at 1.0730
EUR/USD - 1.0670
Most recent candlesticks pattern : N/A
Trend : Near term down
Tenkan-Sen level : 1.0677
Kijun-Sen level : 1.0660
Ichimoku cloud top : 1.0672
Ichimoku cloud bottom : 1.0666
Original strategy :
Sell at 1.0730, Target: 1.0610, Stop: 1.0765
Position : -
Target : -
Stop : -
New strategy :
Sell at 1.0730, Target: 1.0610, Stop: 1.0765
Position : -
Target : -
Stop : -
As the single currency has recovered after falling to 1.0635 yesterday, suggesting minor consolidation above this level would be seen and corrective bounce to 1.0702 cannot be ruled out, however, reckon 1.0730-40 would limit upside and bring another decline, below said support at 1.0635 would add credence to our bearish view that the decline from 1.0906 top is still in progress and extend further weakness to 1.0620, then test of previous chart support at 1.0600, however, a sustained breach below the latter level is needed to retain downside bias for subsequent selloff to 1.0570-75 first.
In view of this, would not chase this fall here and would be prudent to sell dollar on recovery as 1.0730-40 should limit upside. Only a firm break above resistance at 1.0773 would suggest low is formed instead, bring a stronger rebound to 1.0800 but resistance at 1.0827 should remain intact.
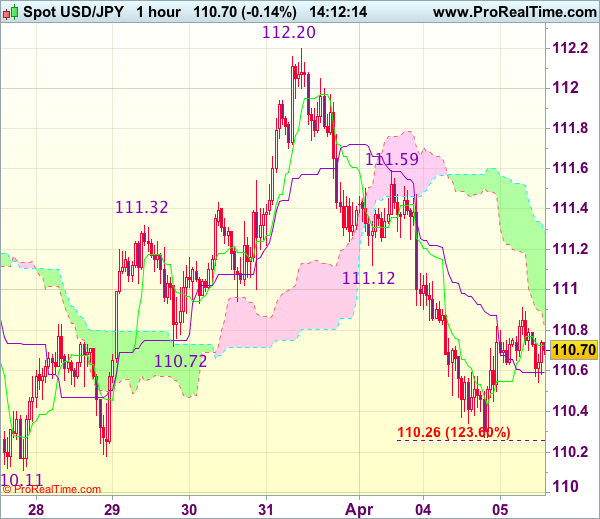
Trade Idea : USD/JPY – Sell at 111.10
USD/JPY - 110.68
Most recent candlesticks pattern : N/A
Trend : Near term down
Tenkan-Sen level : 110.73
Kijun-Sen level : 110.59
Ichimoku cloud top : 111.29
Ichimoku cloud bottom : 110.82
Original strategy :
Sell at 110.95, Target: 109.95, Stop: 111.30
Position : -
Target : -
Stop : -
New strategy :
Sell at 111.10, Target: 110.00, Stop: 111.45
Position : -
Target : -
Stop : -
Dollar’s recovery after falling to 110.27 yesterday suggests minor consolidation above this level would be seen and test of 111.00 cannot be ruled out, however, reckon upside would be limited and resistance at 111.12 should remain intact, bring another decline later to 110.26-27 (1.236 times projection of 112.20-111.12 measuring from 111.59 and said intra-day support), break there would extend the fall from 112.20 to last week’s low at 110.11. Looking ahead, break there is needed to retain downside bias and confirm medium term decline has resumed for further subsequent fall to 109.80-85 (1.618 times projection of 112.20-111.12 measuring from 111.59) which is likely to hold on first testing.
In view of this, would not chase this fall here and would be prudent to sell dollar on recovery as 110.90-95 should limit upside. Above previous support at 111.12 (now resistance) would defer but only break of resistance at 111.59 would abort and signal the fall from 112.20 has ended instead.
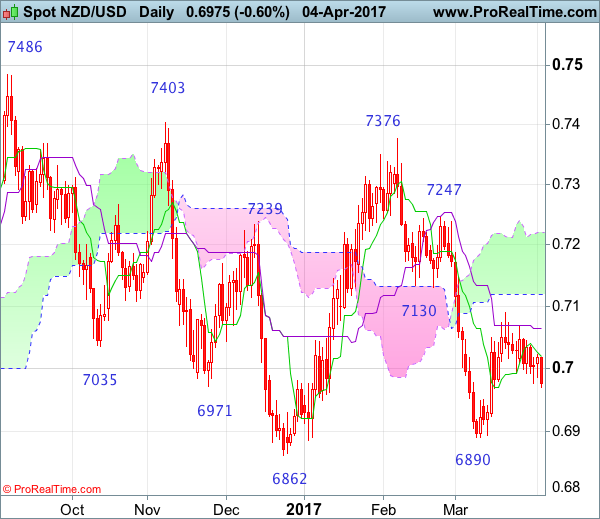
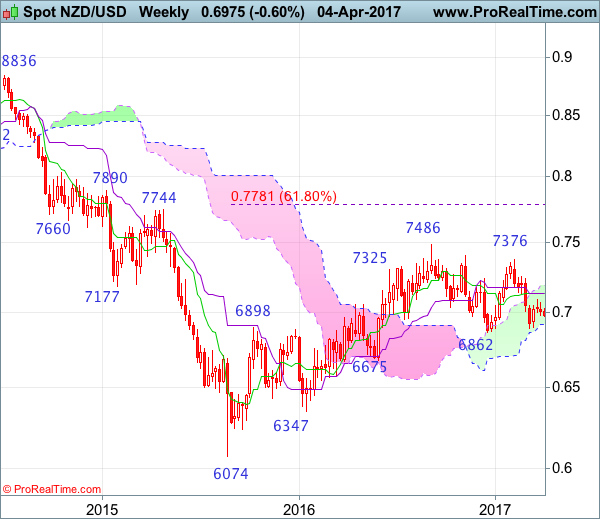
NZD/USD Candlesticks and Ichimoku Analysis
Weekly
- Last Candlesticks pattern: Shooting star
- Time of formation: 5 Sep 2016
- Trend bias: Down
Daily
- Last Candlesticks pattern: Hammer
- Time of formation: 14 Mar 2017
- Trend bias: Near term up
NZD/USD – 0.6974
Although kiwi met resistance at 0.7090 and has retreated since latter part of March and marginal weakness from here cannot be ruled out, as long as support at 0.6890 holds, further consolidation would be seen with mild upside bias for another rebound, above 0.7045-50 would bring test of said resistance at 0.7090 but break there is needed to signal another leg of rebound from 0.6890 low is underway for at least a retracement of recent decline from 0.7376 to the lower Kumo (now at 0.7119), however, break of previous support at 0.7130 is needed to retain bullishness and encourage for further subsequent rise to 0.7185-90 but resistance at 0.7247 should remain intact.
On the downside, whilst marginal weakness from here cannot be ruled out, reckon downside would be limited to 0.6930-40 and said support at 0.6890 should remain intact, bring another rebound later. Only a break below 0.6890 would revive bearishness and extend the fall from 0.7376 top to 0.6862, then towards 0.6775-80 (50% Fibonacci retracement of 0.6074-0.7486) but price should stay well above previous chart support at 0.6675.
Recommendation: Hold long at 0.6980 for 0.7180 with stop below 0.6880
On the weekly chart, as kiwi has retreated after meeting resistance at 0.7090 last month and initial downside risk is seen, reckon indicated support at 0.6890 would hold and bring another rebound later, above 0.7045-50 would bring test of said resistance at 0.7090, break there would suggest low is possibly formed but a weekly close above Kijun-Sen (now at 0.7133) is needed to add credence to this view and encourage for further gain towards resistance at 0.7247. Having said that, as broad outlook remains consolidative, reckon upside would be limited to 0.7300-10 and price should falter below said resistance at 0.7376, bring retreat later.
On the downside, expect pullback to be limited to 0.6930-40 and bring another rebound. Only below said support at 0.6890 would abort and bring test of previous support at 0.6862, however, a breach of latter level is needed to retain bearishness and extend the erratic decline from 0.7486 top to 0.6780 (50% Fibonacci retracement of 0.6074-0.7486) and later towards previous chart support at 0.6675 which is likely to hold from here.
Market Update – Asian Session: Another North Korea Missile Test Raises The Stakes For Trump-Xi Meeting
US Session Highlights
(US) FEB TRADE BALANCE: -$43.6B V -$44.6BE: China: -$23.0B v -$31.3B prior
(US) Mar ISM New York: 56.5 v 51.3 prior
(US) FEB FINAL DURABLE GOODS ORDERS: 1.8% V 1.7%E; DURABLES EX-TRANSPORTATION : 0.5% V 0.4% PRELIM
(US) President Trump: going to do a “very major haircut” on Dodd-Frank regulations
Equities spent the day mostly flat, managing to close slightly higher on the day with little change from yesterday's close. Investors remained on the sidelines as they wait to see how the Supreme Court nomination and healthcare revival play out. With Easter break around the corner and reduced hope of Congress moving forward on economic policy, risk attractiveness has been decreasing.
US markets on close: Dow +0.2%, S&P500 +0.1%, Nasdaq +0.1%
Best Sector in S&P500: Energy
Worst Sector in S&P500: Real Estate
Biggest gainers: SPLS +9.8%; SWN +8.9%; CHK +6.8%; VRTX +4.5%; RRC +4.2%
Biggest losers: AYI -14.8%; NVDA -7.0%; JWN -5.5%; RL -4.5%; LB -4.4%
At the close: VIX 11.8 (-0.6pts); Treasuries: 2-yr 1.25% (flat), 10-yr 2.35% (flat), 30-yr 2.99% (flat)
US movers afterhours
INNL: Gurnet Point Capital said to be near agreement to acquire Innocoll - press; +62.1% afterhours
PNRA: JAB Holding reportedly in advanced talks to acquire Panera - press; +12.3% afterhours
LNDC: Reports Q3 $0.13 v $0.18e, R$136.6M v $136Me; +6.0% afterhours
SHLM: Reports Q2 $0.31 v $0.30e, R$568.7M v $574Me; Affirms FY17 EPS $2.08-2.18 v $2.11e, sales $2.5-2.6B v $2.44Be; +5.7% afterhours
TASR: CEO to hold a live broadcast at 12pmET on Apr 5th to "announce biggest news in company history" - press; +3.5% afterhours
Key economic data
(AU) AUSTRALIA MAR AIG PERF OF SERVICES INDEX: 51.7 V 49.0 PRIOR
(JP) JAPAN FEB SERVICES PMI: 52.9 (Highest reading since Aug 2015) V 51.3 PRIOR; COMPOSITE PMI: 52.9 V 52.2 PRIOR
(SG) SINGAPORE MAR PMI COMPOSITE: 52.2 V 51.4 PRIOR; Highest reading since Nov 2016
(KR) SOUTH KOREA MAR CURRENT ACCOUNT BALANCE: $8.4B V $5.3B PRIOR; GOODS BALANCE: $10.5B V $7.8B PRIOR
(NZ) NEW ZEALAND MAR ANZ JOB ADVERTISEMENTS M/M: 1.6% V 0.4% PRIOR
(NZ) New Zealand Mar QV House Prices Y/Y: 12.9% v 13.5% prior
(NZ) Fonterra Global Dairy Trade Auction: Dairy Trade price index: +1.6% v +1.7% prior; 2nd straight increase
Asia Session Notable Observations, Speakers and Press
Asian equity markets are mixed in the wake of a modest gain on Wall St, as US stocks shook off two days of losses. The Energy sector was the best performer as oil rallied thanks in part to reports of a North Sea oil-field shutdown, adding to gain in electronic trade after API inventories data showed a surprise draw in crude. Real Estate and Financials lagged, even though US interest rates were little changed across the curve. High-end retail names were also sold after downgrades and a Ralph Lauren announcement it was shutting its flagship Fifth Avenue store.
Shanghai Composite is the best performing index in Asia, returning after two days of holidays on strong footing. Reports of a new special economic zone in at Xiongan New area in Hebei Province helped lift local property and industrials names. The rally comes even as PBoC continued to pull liquidity with no reverse repo ops for 8th straight day, draining estimated CNY90B.
High-profile meeting between Pres Trump and China counterpart Xi has been layered with added significance. North Korea continued to defy US warnings to suspend its nuclear program with another missile test as projectile flew 60km and fell into the East Sea.. Recall Trump said US would be prepared to take unilateral action if he cannot get China to apply more pressure on Pyongyang. Japan has also convened a NSC meeting to discuss North Korean threat, while US State Sec Tillerson remarked that US has spoken enough about North Korea, declining to comment further.
Economic data were centered around Services PMI figures that saw Japan hit mid-2015 highs, Singapore late-2016 highs, and Australia return from contraction into expansion.
China
(CN) China govt announced new special economic zone at Xiongan New area in Hebei Province - financial press
(CN) BoCom Chief economist Lian Ping: China Q1 CPI may come below expectations - China Daily
Korea
(KR) North Korea said to have fired a projectile missile - Korean press citing military officials
(KR) US Sec of State Tillerson: North Korea launched yet another intermediate range ballistic missile; the US has spoken enough about North Korea, no further comment
(KR) Estimates by global investment banks expect South Korea Q1 GDP to accelerate from Q4 levels - Korean press
(KR) South Korea Fin Min Yoo: Economy showing signs of recovery - press
(KR) Bank of Korea (BOK) Gov Lee: Seeing signs of a recovery in sentiment; Policy efforts needed to boost domestic consumer sentiment
Asian Equity Indices/Futures (00:30ET)
Nikkei -0.1%, Hang Seng -0.2%, Shanghai Composite +1.1%, ASX200 flat, Kospi -0.6%
Equity Futures: S&P500 -0.1%; Nasdaq -0.1%, Dax -0.2%, FTSE100 -0.3%
FX ranges/Commodities/Fixed Income (00:30ET)
EUR 1.0670-1.0685; JPY 110.55-90; AUD 0.7560-0.7575; NZD 0.6970-0.6985
June Gold -0.1% at 1,257/oz; May Crude Oil +0.6% at $51.32/brl; May Copper +1.0% at $2.65/lb
(US) Weekly API Oil Inventories: Crude: -1.8M v +1.9M prior; first draw in 3 weeks
iShares Silver Trust ETF daily holdings fall to 10,242 tonnes from 10,274 tonnes prior; 4th straight decline
(CN) PBoC skips open market operations for 8th straight session; Drains CNY90B
(CN) PBOC SETS YUAN MID POINT AT 6.8906 V 6.8993 PRIOR
(CN) China MoF sells 1-yr bonds at 2.9463%; bid-to-cover 1.5x; Sells 10-yr bonds at 3.2733%; bid-to-cover 1.64x
(JP) Japan MoF sells ¥2.66T in 6-month bills; avg yield -0.149%; bid-to-cover ratio 4.49x
(KR) Bank of Korea (BOK) sells KRW2.7T v KRW2.7T indicated in 2-yr 1.6% monetary stabilization bonds
(AU) Australia MoF sells A$800M in 2.75% 2028 bonds; avg yield 2.7480%; bid-to-cover 3.03x
Asia equities notable movers
Australia
SBM.AU St. Barbara +3.2% (Q3 result)
BPT.AU Beach Energy +3.9%, WPL.AU Woodside Petroleum +1.5% (oil gains)
WES.AU Wesfarmers -1.8% (JPMorgan downgrades)
IAG.AU Insurance Australia -1.8% (adjusts outlook)
Japan
6502.JP Toshiba Corporation +1.9% (possible buyer for Westinghouse)
2670.JP ABC-MART +0.3% (earnings speculation)
Hong Kong
322.HK Tingyi Cayman Islands Holding +3.2%
2038.HK FIH Mobile -12.8% (Credit Suisse downgrades)
China
600340.CN China Fortune Land Development +10.0%, 000401.CN Tangshan Jidong Cement Co +10.0%, 601992.CN BBMG +10.0%, 600717.CN Tianjin Port Development Holdings +10.0% (China new special economic zone)
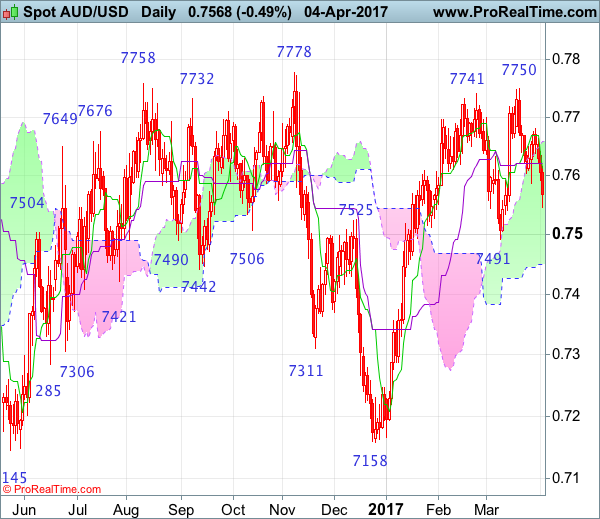
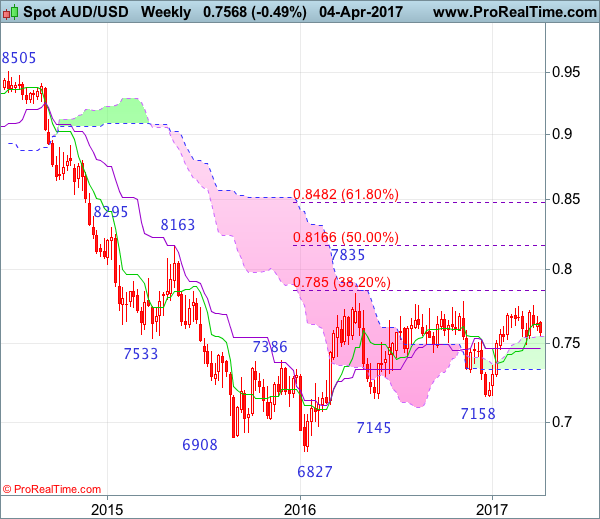
AUD/USD Candlesticks and Ichimoku Analysis
Weekly
• Last Candlesticks pattern: Morning star
• Time of formation: 2 Jan 2017
• Trend bias: Sideways
Daily
• Last Candlesticks pattern: Long white candlestick
• Time of formation: 15 Mar 2017
• Trend bias: Up
Although aussie has slipped again after meeting resistance at 0.7680 and consolidation with initial downside bias is seen, as long as support at 0.7491 holds, prospect of another rebound remains and break of said resistance at 0.7680 would signal the retreat from 0.7750 has ended, bring retest of this level, break there would extend gain to previous chart resistance at 0.7778, however, break there is needed to retain bullishness and confirm early erratic upmove from 0.6827 (2016 low) has resumed for retest of 0.7835 (2016 high) first but sharp move beyond 0.7900-10 should not be repeated and price should falter well below psychological resistance at 0.8000.
On the downside, whilst marginal weakness from here cannot be ruled out, reckon said support at 0.7491 would hold and bring another rise. A daily close below indicated support at 0.7491 would abort and signal recent rise from 0.7158 has ended, risk weakness to the lower Kumo (now at 0.7450) and then towards 0.7400 which is likely to hold from here, bring another upmove later.
Recommendation: Hold long entered at 0.7600 for 0.7800 with stop below 0.7500.
On the weekly chart, aussie’s retreat after marginal rise to 0.7750 suggests consolidation below previous resistance at 0.7778 would be seen and pullback to the upper Kumo (now at 0.7545) cannot be ruled out before prospect of another rise later to 0.7750 and possibly test of 0.7778 resistance but as broad outlook remains consolidative, reckon upside would be limited and price should falter below 2016 high at 0.7835. Looking ahead, only above this level would suggest an upside break of recent established broad range has occurred, bring further subsequent rise to 0.7900 and later towards psychological level at 0.8000.
On the downside, whilst pullback to the upper Kumo (now at 0.7545) cannot be ruled out, price should stay well above support at 0.7491 and bring another rise later. A weekly close below said support at 0.7491 would suggest top is formed, bring test of the Kijun-Sen (now at 0.7468), a sustained breach below this level would signal the rise from 0.7158 has ended instead, risk further fall to 0.7400.
Australia’s Services Sector Back In Expansion Territory In March
For the 24 hours to 23:00 GMT, the AUD declined 0.49% against the USD and closed at 0.7565.
LME Copper prices declined 1.6% or $92.5/MT to $5724.5/MT. Aluminium prices declined 0.5% or $10.5/MT to $1938.0/MT.
In the Asian session, at GMT0300, the pair is trading at 0.7570, with the AUD trading 0.07% higher against the USD from yesterday's close, after overnight data showed an expansion in Australia's service sector in March.
Data revealed that Australia's AIG performance of services index recorded a rise to a level of 51.7 in March, crawling out of the expansion territory, compared to a level of 49.0 in the prior month.
The pair is expected to find support at 0.7537, and a fall through could take it to the next support level of 0.7505. The pair is expected to find its first resistance at 0.7607, and a rise through could take it to the next resistance level of 0.7645.
The currency pair is trading between its 20 Hr and 50 Hr moving averages.

UK’s Construction Sector Growth Cools In March
For the 24 hours to 23:00 GMT, the GBP declined 0.38% against the USD and closed at 1.2436, after data showed that British construction sector lost momentum last month.
UK's Markit construction PMI unexpectedly fell to a level of 52.2 in March, offering latest sign that the nation's economy may be running out of steam. Markets expected the PMI to remain steady at a level of 52.5.
In the Asian session, at GMT0300, the pair is trading at 1.2441, with the GBP trading a tad higher against the USD from yesterday's close.
The pair is expected to find support at 1.2407, and a fall through could take it to the next support level of 1.2374. The pair is expected to find its first resistance at 1.2484, and a rise through could take it to the next resistance level of 1.2528.
Looking ahead, market participants will keep a close watch on UK's Markit services PMI for March, set to release in a few hours.
The currency pair is showing convergence with its 20 Hr moving average and trading below its 50 Hr moving average.

Japan’s Service Sector Growth Expanded At Strongest Pace In 19 Months In March
For the 24 hours to 23:00 GMT, the USD marginally declined against the JPY and closed at 110.82.
In the Asian session, at GMT0300, the pair is trading at 110.70, with the USD trading 0.11% lower against the JPY from yesterday's close.
The Japanese Yen gained ground, after early morning data indicated that activity in Japan's services sector jumped to a level of 52.9 in March, accelerating at its fastest pace in 19 months and hinting that the world's third largest economy continues to strengthen. The PMI had registered a reading of 51.3 in the previous month.
The pair is expected to find support at 110.32, and a fall through could take it to the next support level of 109.95. The pair is expected to find its first resistance at 110.99, and a rise through could take it to the next resistance level of 111.29.
Going ahead, traders would concentrate on Japan's consumer confidence index for March, scheduled to release tomorrow.
The currency pair is trading between its 20 Hr and 50 Hr moving averages.

Swiss Franc Trading On A Weaker Footing This Morning
For the 24 hours to 23:00 GMT, the USD marginally declined against the CHF and closed at 1.0015.
In the Asian session, at GMT0300, the pair is trading at 1.0023, with the USD trading 0.08% higher against the CHF from yesterday’s close.
The pair is expected to find support at 1.0009, and a fall through could take it to the next support level of 0.9995. The pair is expected to find its first resistance at 1.0037, and a rise through could take it to the next resistance level of 1.0051.
The currency pair is showing convergence with its 20 Hr and 50 Hr moving averages.
