Sample Category Title
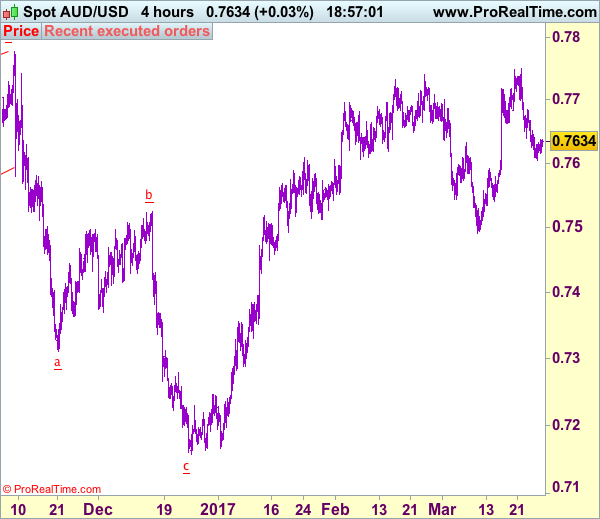
Trade Idea: AUD/USD – Hold long entered at 0.7645
AUD/USD – 0.7632
Recent wave: Wave 5 ended at 1.1081 and major correction has commenced for fall to 0.7000 and then towards 0.6500-10
Trend: Near term up
Original strategy :
Bought at 0.7645, Target: 0.7800, Stop: 0.7585
Position: - Long at 0.7645
Target: - 0.7800
Stop: - 0.7585
New strategy :
Hold long entered at 0.7645, Target: 0.7800, Stop: 0.7585
Position: - Long at 0.7645
Target: - 0.7800
Stop:- 0.7585
Although aussie has trade defensively after last week’s sharp retreat from 0.7750 (last week’s high) and marginal weakness from here cannot be ruled out, reckon downside would be limited and as long as 0.7592 (previous resistance) holds, mild upside bias remains for another rise, above said resistance would extend gain to 0.7778 (last year’s high), however, break there is needed to retain bullishness and extend headway to 0.7840-50 but price should falter below 0.7900.
In view of this, we are holding on to our long position entered at 0.7645. Only below previous resistance at 0.7592 would abort and signal top is formed instead, then further choppy trading would take place and risk is seen for pullback to 0.7530-40 but indicated support at 0.7491 should remain intact.
On the 4-hour chart, the move from 0.8066 is the wave 5 with i: 0.8860, ii: 0.8315, wave iii is an extended move ended at 1.0183, iv: 0.9706 and wave v has ended at 1.1081 (also the top of entire wave 5). The subsequent selloff is the major correction which is unfolding as ABC-X-ABC and 2nd A leg has ended at 0.8848, followed by a-b-c wave B which ended at 0.9758, hence, 2nd C wave is now in progress and indicated downside target at 0.7000 and 0.6950 had been met, so further fall to 0.6710-20 cannot be ruled out.
EUR/JPY 4h Trend Line Broken For Further Drop
The EUR/JPY has broken a 4h trend line and currently it is supported by W L3 pivot. If the prices retraces to POC zone (EMA 89, W H3, 50.0, inner trend line, ATR high) 120.60-85 we might see a rejection towards 119.90 and 119.25. If there is no retracement to the upside, than traders should pay attention to 4h close below 119.20 for further continuation down to 118.75.
Quick Summary:
W H3 - Weekly H3 Camarilla (Weekly resistance)
POC - Point Of Confluence (The zone where we expect price to react aka entry zone)
W L3 - Weekly L3 Camarilla (Weekly support)
Daily Technical Analysis
EURUSD
The EURUSD continued its bullish momentum last week topped at 1.0824 and hit 1.0849 earlier today in Asian session. Price is still in a bullish phase, moving convincingly above the H1 EMA 200 and a trend line support as you can see on my H1 chart below. The bias is bullish in nearest term testing 1.0870 key resistance which is a good place to sell with a tight stop loss. Immediate support is seen around 1.0795. A clear break below that area could lead price to neutral zone in nearest term testing 1.0750 area where H1 EMA 200 and the trend line support converge which is a good place to buy with a tight stop loss as a clear break below that area (especially if that happen after a rejection above 1.0870 ) would be a serious threat to the current short term bullish bias. On the upside, a clear break and daily close above 1.0870 could quickly target 1.1000 this week.
GBPUSD
The GBPUSD continued its bullish momentum last week topped at 1.2531. Price is still moving convincingly above the H1 EMA 200 as you can see on my H1 chart below suggests a valid short-term bullish trend. The bias remains bullish in nearest term testing 1.2570 – 1.2600 region. Immediate support is seen around 1.2460. A clear break below that area could lead price to neutral zone in nearest term testing 1.2400 support area. On the upside, a clear break and daily close above 1.2570 – 1.2600 would expose 1.2770 region this week. Overall I remain neutral.
USDJPY
The USDJPY continued its bearish momentum last week slipped below 111.30 and daily EMA 200 key support as you can see on my daily chart below suggests a bearish outlook and hit 110.25 earlier today in Asian session. The bias remains bearish in nearest term testing 109.80. Immediate resistance is seen around 110.80. A clear break above that area could lead price to neutral zone in nearest term testing 111.30 which is a good place to sell with a tight stop loss. On the downside, a clear break and daily close below 109.80 would expose 108.50/00 region. I am bearish on this pair.
USDCHF
The USDCHF continued its bearish momentum last week bottomed at 0.9881 and hit 0.9875 as a part of the bearish scenario after fell below the bullish channel as you can see on my H4 chart below. The bias is bearish in nearest term testing 0.9800. Immediate resistance is seen around 0.9930. A clear break above that area could lead price to neutral zone in nearest term testing 1.0000 area. Overall I remain neutral.
DAX Steady As German Business Climate Climbs
The DAX Index has edged upwards on Monday, as the DAX trades at 11,963.25. On the release front, German Ifo Business Climate climbed to 112.3, above the forecast of 111.2 points.
The week has started on a positive note in the eurozone. German Ifo Business Climate rose to 112. 3 points, its highest level since July 2011. The release underscores high optimism in the business sector, despite rumblings of protectionism from the US and the uncertainty over Brexit. Germany, the largest economy in Europe, continues to post strong numbers, which has been good news for the eurozone economy. Last week’s PMIs pointed to expansion in the manufacturing and service sectors. German and eurozone Manufacturing PMIs both beat their estimates and hit their highest levels since 2011. The markets are keeping a close eye on Germany, which later this week releases CPI, retail sales and unemployment claims. One soft spot in the economy, however, is consumer confidence. GfK German Consumer Climate lost ground for a second straight month, as the indicator dropped to 9.8 in March, its lowest level since November 2016. Eurozone Consumer Confidence remains weak, as the indicator posted a decline of -5 in March, almost unchanged from a month earlier. These soft numbers are largely a result of higher inflation, as consumers are concerned about their reduced purchasing power.
Global stock markets enjoyed a strong bull run after Donald Trump’s election last November. However, the euphoria over President Trump’s upset election win is long past. The inquiry into the Trump administration’s links with Russia continues to make headlines, and is another cause for concern for nervous investors. Trump has been in office for over two months, but he has yet to provide any details over even an outline of economic policy. Last week, Trump’s proposed bill to change Obamacare was not even voted on, as the White House could not garner enough support to pass the bill. This debacle will only increase market uneasiness over Trump, and could send the DAX lower.
European Market Update: Germany’s Mar IFO Business Climate Near 7-Year Highs
Germany's Mar IFO Business Climate near 7-year highs
Notes/Observations
Investors question reflation Trump trade after healthcare reform bill failed; concerns that rifts within the GOP could not only delay but even reduce the size of the anticipated tax reform project
Germany Mar IFO Business Climate hits highest since July 2011 (112.3 v 111.1e)
Overnight:
Asia:
Bank of Japan March meeting summary: Policy will remain easy for some time
PBoC Gov Zhou: must be vigilant to reflation globally, too early to say if it is a trend globally
Hong Kong electoral committee picked pro-China candidate Carrie Lam over John Tsang to be the next leader
China Feb YTD Industrial Profits Y/Y: 31.5% v 2.3% prior; as commodity prices rally
Europe:
Chancellor Merkel's CDU party was victorious in Saarland state regional election with 40.7% of the vote vs 29.5% for SPD. Results seen bolstering her prospects of winning a fourth term in September's national election
EU Leaders (without UK) sign Rome Declaration and pledge to work toward creating a so-called "two-speed" Europe
German Chancellor Merkel:A Europe of different speeds still means a common Europe; Europe is not just about rules, also about freedoms
France President Hollande: French politicians who want to leave Europe must first prove to the French people we'd be better on our own
ECB's Villeroy (France) warns against the idea of leaving the euro zone, as Presidential candidate Le Pen has suggested
PM May looking to keep Britain under remit of some EU agencies after Brexit for a transition period; UK did not have time nor expertise to replace them with new regulatory regime from scratch within two years
Americas:
Concerns that rifts within the GOP could not only delay but even reduce the size of the anticipated tax reform project
President Trump to sign Executive Order on Tuesday, Mar 28th aimed at promoting domestic oil, coal & natural gas (dismantle climate regulations)
Energy:
OPEC and non-OPEC Joint Compliance Committee agree to review whether oil output cuts should be extended by 6 months. Called for OPEC Secretariat to "review the oil market conditions and revert in April, 2017 regarding the extension of the voluntary production adjustments".
Weekly Baker Hughes US Rig Count: 809 v 789 w/w (+2.5%) (10th straight weekly rise and largest weekly increase since Jan)
Economic Data
(FI) Finland Mar Consumer Confidence: 22.9 v 20.8 prior; Business Confidence: 4 v 1 prior
(SE) Sweden Feb Household Lending Y/Y: 7.2% v 7.2%e
(DE) Germany Mar IFO Business Climate: 112.3 v 111.1e (highest since July 2011); Current Assessment: 119.3 v 118.3e, Expectations Survey: 105.7 v 104.3e
(EU) Euro Zone Feb M3 Money Supply Y/Y: 4.7% v 4.9%e
(HK) Hong Kong Feb Trade Balance (HKD): -56.3B v -39.4Be; Exports Y/Y: +18.2% v +15.7%e; Imports Y/Y: 25.4% v +16.4%e
Fixed Income Issuance:
(ID) Indonesia sold total IDR18.7T in 10-year, 15-year and 20-year bonds
SPEAKERS/FIXED INCOME/FX/COMMODITIES/ERRATUM
Index snapshot (as of 10:00 GMT)
Indices [Stoxx50 -0.5% at 3,426, FTSE -0.8% at 7,280, DAX -0.8% at 11,967, CAC-40 -0.5% at 4,996, IBEX-35 -0.6% at 10,246, FTSE MIB -0.8% at 20,024, SMI -0.6 % at 8,561, S&P 500 Futures -0.9%]
Market Focal Points/Key Themes: European equity indices are trading sharply lower after the House pulled a US healthcare bill vote, raising questions about Trump's ability to progress his pro-growth agenda through Congress; Banking stocks hit across the board as a result; energy, commodity and mining stocks trading notably lower as both copper and oil prices trade lower intraday; Indices paring back some of the morning's losses at the time of writing.
Upcoming scheduled US earnings (pre-market) include Cal-Maine Foods, G-III Apparel.
Equities (as of 09:50 GMT)
Consumer Discretionary: [Exova Group EXO.UK +13.3% (Received proposals regarding a possible cash offer for the company), First Group FGP.UK +3.1% (South Western rail franchise award)]
Energy: [Hurricane Energy HUR.UK +5.5% (completion of Halifax Well operations)]
Financials: [Old Mutual OML.UK -0.4% (to sell stake in OMAM to HNA Capital for ~$446M), Zurich Insurance Group ZURN.CH -2.1% (reportedly mulling €8B capital increase)]
Healthcare: [Erytech ERYP.FR +20.6% (positive phase 2b data for eryaspase), Paion PA8.DE +6.2% (positive headline data in US clinical safety trial of Remimazolam), Stada Arzneimittel SAZ.DE +0.4% (Consortium said to consider offer well above €60/shr)]
Industrials: [AMG AMG.NL -1.1% (receives notice of cancellation of Tantalum supply contract), Paragon PGN.DE +5.8% (FY16 results)]
Technology: [Sepura SEPU.UK +1.8% (German and Spanish competition approvals update)]
Telecom: [BT Group BT.UK -1.2% (To be fined £42M for contract breaches)]
Utilities: [Capital Stage CAP.DE +0.6% (prelim FY16 results)]
Speakers
BOE's Financial Policy Committee (FPC) stress test scenario: Financial stability risk level broadly unchanged since November. Maintained Countercyclical buffer rate at 0%, would assess return to more neutral level with 12-Month lag at the next FPC meeting. Progress on track to ensure largest UK banks were fully resolvable by 2022
German Bundesbank's Wuermeling: forward guidance of the ECB council now presumed that interest rate hikes were currently to be expected at the earliest after the end of net monetary policy purchases. Everything was in a state of flux and ECB could hike deposit rate before QE ended
German IFO Economists commented that its saw a significantly improved mood as German business were unaffected by political uncertainties. Domestic GDP growth outlook was good and the export sector expected to increase.
Austria Fin Min Schelling said to be the top candidate to be new chairman of Eurogroup should Dijsselbloem leave
Poland Central Bank's Osiatynski reiterated view that temporary factors driving inflation; CPI to slow to 1.6-1.7% by end of 2017 and be slightly below 2.5% through 2018. Best not to over-react to monthly inflation data
Japan Fin Min Aso reiterated price stability was primarily the BOJ's responsibility. Govt would continue to work with BOJ to escape deflation
China PBoC: To deepen CNY currency (Yuan) exchange rate formation system. To push forward Yuan capital account convertibility
Currencies
Dealer noted that failure of the US health reform bill was raising worries concerning the US administration's ability to push through a meaningful tax reform was weighing upon the USD. The Dollar Index hit a near four-month low after Trump's healthcare debacle. USD Index 99.299 (had risen to a 14-year high near 104.00 early in January). Long Dollar' trades were currently seen unwinding in both Asia and European sessions.
USD/JPY led the way lower as the pair approached the lower end of the 110 handle.
EUR/USD was higher by over 0.6% to test 1.0870 area. Helping the Euro was Chancellor Merkel's CDU weekend victory a local election in the German state of Saarland. The election weakened hopes that the SPD and its new leader Schulz would be aiming for easy victories in the upcoming state elections of North-Rhine Westphalia and Schleswig Holstein ahead of the German General Election in September. German IFO survey for March was near a 7-year high.
GBP/USD also was firmer in the session ahead of the article 50 trigger this week. Pair at 1.2570 for 6-week highs just ahead of the NY mornring.
Fixed Income:
Bund futures trade at 160.56 up 35 ticks trading up on the back of the failed bid for the Trump administration to pass Health Care reform. Futures are off the highs however with stronger German IFO data helping ease some of the upside pressure. Resistance moves to 161.06 followed by 161.44. Support moves to 160.27 gap fill followed by 159.73.
Gilt futures trade at 126.97 up 30 ticks, having breached 127 earlier printing a high of 127.29. Support moves to 126.30 followed by 126.05. Resistance moves to 127.35 followed by 127.89. Short Sterling futures trade up 1bp to flat with Jun17Jun18 spread remaining steady at 22Bp.
Monday's liquidity report showed Friday's excess liquidity fell to €1.334B a fall of €2B from €1.336T prior. Use of the marginal lending facility rise to €325M from €283M prior.
Corporate issuance saw the week end with $20.8B at the low end of analysts guided range, with Issuance for the month topping $100B coming at $108.1B via 143 tranches. Euro denominated issuance was active last week with just over €38B coming to market via 39 issuers and 49 tranches exceeding the €30B seen by analysts. Thursday saw the bulk of the issuance with over €12B priced.
Looking Ahead
(BR) Brazil Mar CNI Consumer Confidence: No est v 104.4 prior
06:00 (IL) Israel to sell 2020, 2021, 2025 and 2045 bonds - 06:45 (US) Daily Libor Fixing
07:00 (IN) India announces details of upcoming bond sale (held on Fridays)
07:00 (BR) Brazil Mar FGV Consumer Confidence: No est v 81.8 prior
07:25 (BR) Brazil Central Bank Weekly Economists Survey
07:30 (TR) Turkey Mar Real Sector Confidence (Seasonally adj): 104.0e v 106.5 prior; Real Sector Confidence (unadj): 103.0e v 105.3 prior
07:30 (TR) Turkey Mar Capacity Utilization: 75.3%e v 75.4% prior
08:00 (BE) ECB's Praet (Belgium, chief economist) in Madrid
08:15 (UK) Baltic Dry Bulk Index
08:50 (FR) France Debt Agency (AFT) to sell combined €5.2-6.4B in 3-month, 6-month and 12-month BTF Bills
09:30 (EU) ECB announces Covered-Bond Purchases
09:35 (EU) ECB calls for bids in 7-Day Main Refinancing Tender
10:00 (MX) Mexico Feb Trade Balance: -$0.4Be v -$3.3B prior
10:00 (MX) Mexico Jan IGAE Economic Activity Index (Monthly GDP) Y/Y: 1.9%e v 2.1% prior
10:30 (US) Mar Dallas Fed Manufacturing Activity: 22.0e v 24.5 prior
11:30 (US) Treasury to sell 3-Month and 6-month Bills
13:00 (US) Treasury to sell 2-Year Notes
12:45 (US) Fed's Evans with ECB's Praet in Madrid
13:15 (US) Fed's Evans in Madrid
18:30 (US) Fed's Kaplan in TX
GOLD – Fresh Rally Approaches 200SMA
Spot Gold approached 200SMA barrier ($1259) on Monday's strong acceleration, driven by fresh weakness of the dollar and rising political uncertainty in the US.
Fresh rally ended congestion of past three days that was generating negative signals on candlesticks and overbought slow stochastic.
Targets at $1259 and $1263 (27 Feb high) are in near-term focus and break higher could drive Gold price towards $1278 (Fibo 61.8% of $1375/$1122 descend).
Technical studies on daily chart are firmly bullish and supportive for further gains, however, the price may show hesitation at key $1257/63 barriers.
Friday's low at $1240 is seen ideally containing dips and guarding cluster of MA supports that lay below.
Res: 1257, 1263, 1270, 1278
Sup: 1253, 1244, 1240, 1234
FTSE Dipped Below 55SMA On Stronger Pound
FTSE fell to two-month low at 7179, following lower opening on Monday and subsequent bearish acceleration.
Significantly stronger pound keeps the index under increased pressure that resulted in break below 55SMA which held bears in past three days.
Fresh weakness cracked next strong support at 7184 (Fibo 61.8% of 7024/7444 upleg) and came ticks ahead of another strong support, daily cloud top (currently at 7169).
Daily studies are turning in bearish setup and favor further weakness. Consolidation above daily cloud could be expected, with broken 55SMA now acting as solid resistance and expected to ideally cap upticks.
Res: 7219, 7229, 7254, 7280
Sup: 7184, 7179, 7169, 7123
GOLD Back To 1-Month High, SILVER Increasing Demand, Crude Oil Heading Downwards
GOLD (in USD) Back to 1-month high.
Gold has risen sharply invalidating the bearish outlook. The momentum seems back to bullish. Strong resistance is located at 1263 (27/02/2017 high). Hourly support can be found at 1224.10 (16/03/2017 low). Expected to show further strengthening.
In the long-term, the technical structure suggests that there is a growing upside momentum. A break of 1392 (17/03/2014) is necessary ton confirm it, A major support can be found at 1045 (05/02/2010 low).
SILVER Increasing demand.
Silver has surged on Friday. Resistance given at 17.56 resistance (16/03/2017 high) has been broken. Hourly support is given at 16.82 (15/03/2017 low).
In the long-term, the death cross indicates that further downsides are very likely. Resistance is located at 25.11 (28/08/2013 high). Strong support can be found at 11.75 (20/04/2009).
Crude Oil Heading downwards
Crude oil's bearish pressures continues despite correct bounce due to a short-squeeze. The commodity had been unable to mount a serious challenge to resistance at 49.61 (08/12/2017 low) hourly support given at 47.09 (016/03/2017 low) Expected to see deeper selling pressures.
In the long-term, crude oil has recovered after its sharp decline last year. However, we consider that further weakness are very likely. Strong support lies at 24.82 (13/11/2002) while resistance can now be found at 55.24 (03/01/2017 high).
EUR/USD Candlesticks and Ichimoku Analysis
Weekly
• Last Candlesticks pattern: Shooting star
• Time of formation: 03 May 2016
• Trend bias: Down
Daily
• Last Candlesticks pattern: Shooting star
• Time of formation: 3 May 2016
• Trend bias: Sideways
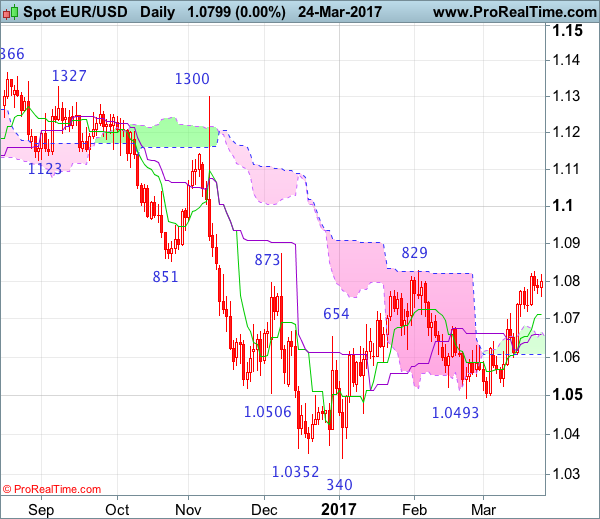
EUR/USD – 1.0868
The single currency only eased to 1.0719 (we recommended to buy at 1.0690 last week and missed our long entry) before finding renewed buying interest and euro has rallied again since, price broke above indicated previous resistance at 1.0829, adding credence to our view that early erratic rise from 1.0340 low is still in progress and may extend further subsequent gain to 1.0930-35 (61.8% Fibonacci retracement of 1.1300-1.0340), then towards 1.1000, however, near term overbought condition should prevent sharp move beyond 1.1050 and reckon 1.1100 would hold from here, risk from there is seen for a retreat later.
On the downside, whilst initial pullback to 1.0830-35 cannot be ruled out, reckon 1.0780-85 would limit downside and bring another upmove later to aforesaid upside targets. A daily close below support at 1.0760 would risk test of the Tenkan-Sen (now at 1.0741) but support at 1.0719 should remain intact, bring another rise later. A drop below the Kijun-Sen (now at 1.0684) would defer and suggest top is possibly formed, bring test of the upper Kumo (now at 1.0654) but a drop below the lower Kumo (now at 1.0607) is needed to signal top is formed, bring further fall to 1.0550 later.
Recommendation: Buy again at 1.0785 for 1.0985 with stop below 1.0685.
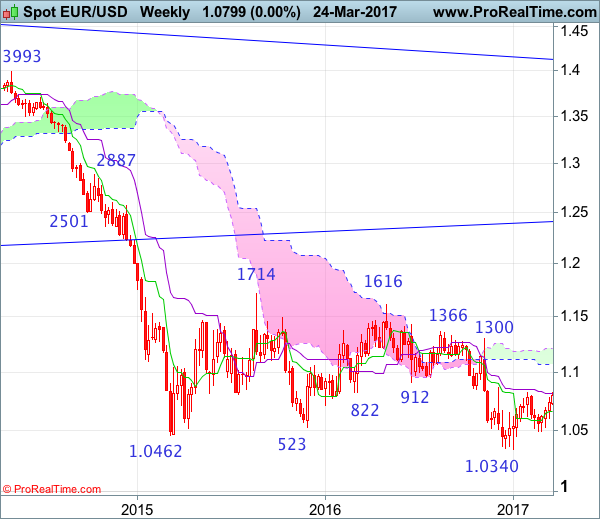
On the weekly chart, the single currency finally broke above previous resistance at 1.0829, adding credence to our near term bullish view for the erratic rise from 1.0340 low is still in progress for retracement of recent decline, hence upside bias remains for further gain to 1.0930-35 (61.8% Fibonacci retracement of 1.1300-1.0340) and possibly 1.1000, however, reckon upside would be limited to 1.1050-60 and price should falter below 1.1100-10, risk from there is seen for a retreat to take place later.
On the downside, although initial pullback to 1.0825-30 is likely, reckon downside would be limited to 1.0785-90 and bring another rise later. Below last week’s low at 1.0719 would defer and risk test of the Tenkan-Sen (now at 1.0684) but break of indicated support at 1.0600 is needed to signal top is formed, bring further subsequent decline to 1.0525 support but support at 1.0493 should remain intact. A drop below 1.0493 would suggest the corrective rise from 1.0340 has ended instead, bring further fall to key support at 1.0454, only a sustained breach below this level would provide confirmation, then further fall to 1.0390-00 and later retest of this January low would follow.
EUR/CHF Moving Sideways, EUR/JPY Continued Bearish Pressures, EUR/GBP Riding Downtrend Channel.
EUR/CHF Moving sideways.
EUR/CHF's is moving up and down. The medium-term pattern suggests us to see continued bearish pressures towards key support that can be found at 1.0623 (24/06/2016 low).
In the longer term, the technical structure is mixed. Resistance can be found at 1.1200 (04/02/2015 high). Yet,the ECB's QE programme is likely to cause persistent selling pressures on the euro, which should weigh on EUR/CHF. Supports can be found at 1.0184 (28/01/2015 low) and 1.0082 (27/01/2015 low).
EUR/JPY Continued bearish pressures.
EUR/JPY rejection at 122.88 has triggered a correction. The pair is also very volatile. Hourly support can be found at 119.33 (23/03/2017 low). Resistance stands at 122.88 (13/03/0217 high). Expected to show continued weakness.
In the longer term, the technical structure validates a medium-term succession of lower highs and lower lows. As a result, the resistance at 149.78 (08/12/2014 high) has likely marked the end of the rise that started in July 2012. Strong support at 94.12 (24/07/2012 low) looks nonetheless far away.
EUR/GBP Riding downtrend channel.
EUR/GBP continues to head lower. Closer resistance can be found at 0.8787 (13/03/2017 high). Key resistance is given at 0.8854 (15/01/2017 high). Hourly support located at 0.8645( 05/02/2017 low) has been broken but the pair has failed to hold below this level. Expected to show continued weakness.
In the long-term, the pair has largely recovered from recent lows in 2015. The technical structure suggests a growing upside momentum. The pair is trading above from its 200 DMA. Strong resistance can be found at 0.9500 psychological level.