Sample Category Title
US Trade Deficit Narrows More than Expected in February
The U.S. international trade deficit narrowed by $4.6bn, or more than $1bn more than expected, declining to $43.6bn from January's downwardly revised $48.2bn.
Goods exports increased by 0.2% m/m in February, with a sharp uptick in consumer goods (+4.0%) and automotive (+1.4%) nearly offset by a decline in food & beverage (-6.0%) and capital goods (-1.4%). Services exports were largely unchanged in February from the month prior.
Imports declined -1.8% m/m in February, on lower automotive (-8.3%) and consumer goods (-5.9%) imports. Imports of other categories were more robust. Petroleum imports were up as the effect of higher prices was offset by lower import volumes.
After adjusting for price fluctuations, the rise in merchandise exports was far more apparent, with real goods exports up a stronger 0.3% on the month. The decline in goods imports was also more accentuated in volume terms, down by 2.6% in February.
Most of the goods improvement was related to the trade deficit narrowing vis-à-vis Europe (-$12.0bn vs. -$13.4bn in January). On the other hand, the trade deficit with China (-$31.7.0bn vs. -$30.1bn in January) continued to expand. The goods trade deficit with North America also widened slightly, as the wider gap with Mexico (-$6.2 vs. -$5.5bn in January) was compounded by a slight widening of the Canadian one (-$2.4bn vs. -$1.8bn in January).
Key Implications
This was a relatively decent report. Exports saw a small uptick, following outsized gains in the previous two months, while imports declined after a four month expansion. Still, despite the narrowing this month from an elevated January gap, the U.S. trade deficit remains sizeable.
Despite vows to bring it down, it's unlikely that the new administration's policies will be able to alter the course of the trade balance, which is buttressed by the high dollar and comparatively strong U.S. demand vis-à-vis the rest of the world. Moreover, any policies that serve to disrupt global trade may result in unintended negative consequences for the American economy.
Neither the high dollar nor subdued global growth are likely to go away anytime soon, but the backdrop has become somewhat more supportive recently, with global growth strengthening and the dollar paring back gains in light of the very gradual pace of rate increases by the Fed.
After subtracting 1.8 percentage points in the last quarter of 2016, net-trade looks to be more even keeled at the start of 2017. Ultimately, we expect only modest drag on economic activity. Still, in light of the expected drawdown in inventory investment, the U.S. economy appears to have expanded by only 1% in the first quarter of the year.
Canada’s Trade Balance Slips into Deficit in February
Canada's trade balance moved back into deficit (-$972 million) in February, ending three months in surplus territory. Exports fell 2.4%, while imports rose 0.6%.
The weakness in exports was broad-based, with eight of eleven segments declining. The rise in imports was less broad, mainly focused in motor vehicles and parts, agriculture and special transactions trade.
The decline was mostly a volume story. In inflation-adjusted terms, real exports fell 2.5%, while imports rose 0.3%.
The widening in Canada's trade deficit was entirely with countries outside of the United States where it rose to $5.4 billion (from $4.0 billion in January). Meanwhile, the surplus with the U.S. widened slightly to $4.5 billion (from $4.4 billion previously).
Key Implications
The pullback in exports is disappointing and overall net-exports will subtract as much as 2 percentage points from economic growth in the first quarter of this year. Nonetheless, with a string of strong releases and positive signals for domestic demand, we are still comfortable with our expectation for real GDP growth of 3.4% in the first quarter.
February's weakness notwithstanding, the outlook for export growth in Canada remains solid. One of the brightest spots in the U.S. outlook over recent months has been manufacturing activity, which exhibits a sturdy and leading relationship with Canadian exports.
Potential changes to NAFTA continue to make headlines and will be a point of concern for Canadian policymakers. Still, given the depth of the two-way trading relationship between the two countries and encouraging comments from the U.S Commerce Secretary, we do not expect to see major changes to the agreement between the two countries.
US Trade Gap Improved in February But Size of Deficit Will Draw Attention
Highlights:
- The US trade deficit in goods and services narrowed to $43.6 billion in February from January's $48.2 billion shortfall that was the largest in nearly two years.
- Imports declined 1.8% on lower auto and consumer goods imports while exports edged up slightly.
- Today's report is consistent with our forecast for net trade to provide a modest lift to growth in Q1/17.
- Our GDP monitoring is unchanged at 1.7% in Q1/17
Our Take:
Today's report shows a welcomed improvement in the trade deficit after months of deterioration although that is unlikely to placate the new Administration that has made the US trade gap a central issue. The deficit in goods with NAFTA partners widened relative to last year; while that was largely due to a return to deficits with Canada (averaging $2.6 billion over the last three months), it is the more sizeable gap with Mexico ($4.7 billion) that will likely continue to draw attention. These figures will remain in the spotlight in the coming months as the Trump administration seeks to renegotiate NAFTA. Outside North America, China is likely to remain a focal point as the US is running a $27.3 billion trade deficit with that country even if that is no worse than year ago figures. Given the Trump Administration's discomfort with these deficits, the threat of protectionist trade measures continues to loom large. Our forecast does not assume any major disruptive trade policies will be implemented though the risks are not insignificant.
Canadian Net Trade Balance Back in Deficit in February
Highlights:
- The merchandise trade balance returned to deficit in February, posting a $1.0 billion shortfall following three-consecutive surpluses November through January.
- Nominal exports declined 2.4%, led by a 2.5% decline in the volume of shipments. Imports rose 0.6% in nominal terms and 0.5% in volume terms.
- Regionally, the return to a nominal trade deficit was led by deterioration in the balance of trade with countries other than the U.S. The Canadian goods trade surplus with the U.S. was little-changed in February.
- Export volumes are tracking little growth in Q1 alongside a jump in imports that leaves the real net trade balance tracking a 3 percentage point drag from Q1 annualized GDP growth.
Our Take:
A deterioration in the 'real' international trade balance in February (which occurred alongside the first nominal trade deficit in four months) suggests that net trade will likely provide a larger-than-expected subtraction from economic growth in Q1/17 than we previously assumed. We're currently tracking a ~3 percentage point drag versus the 0.9% subtraction expected ahead of the report. A monthly pull-back in export volumes (led by an almost 3% drop in non-energy exports) also provides the first evidence that the three-month run of outsized monthly GDP gains November through January came to an end in February. Nonetheless, earlier strength - a 0.6% jump in GDP in January left the level of activity in that month already an annualized 4.1% above its Q4 average - still leaves GDP tracking in line with our monitoring for a 3.8% jump in Q1 as a whole and a silver lining in the recent trade data is that much of a sizeable import boost Q1 to-date has come from rising equipment imports that bode well for domestic equipment investment to bounce back into positive growth territory in Q1. Looking through monthly and quarterly data volatility, our view remains that underlying economic activity continues to improve at a modestly above-potential pace as weakness in oil & gas sector investment eases and the rest of the economy continues to grow.
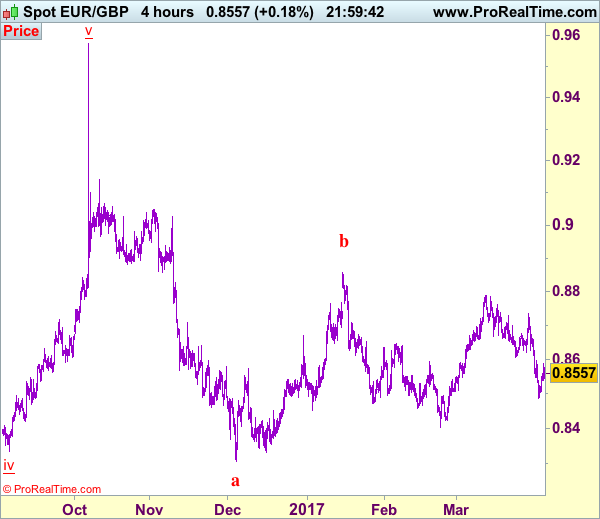
Trade Idea: EUR/GBP – Sell at 0.8620
EUR/GBP - 0.8557
Recent wave: Major double three (A)-(B)-(C)-(X)-(A)-(B)-(C) is unfolding and 2nd (A) has possibly ended at 0.6936.
Trend: Near term down
Original strategy :
Sell at 0.8620, Target: 0.8520, Stop: 0.8660
Position : -
Target : -
Stop : -
New strategy :
Sell at 0.8620, Target: 0.8520, Stop: 0.8660
Position : -
Target : -
Stop : -
Although euro’s recovery after falling to 0.8485 has retained our view that consolidation above this level would be seen, reckon upside would be limited to 0.8590-00 and renewed selling interest should emerge around 0.8620-25, bring another decline later, below said support at 0.8485 would add credence to our view that top has been formed at 0.8788 and bearishness remains for this fall from there to bring retracement of early upmove, hence further weakness to 0.8470 would be seen, however, oversold condition should prevent sharp fall below 0.8450, risk from there has increased for a rebound to take place later.
In view of this, we are looking to sell euro on recovery as 0.8620-25 should limit upside. Only above 0.8660-65 would defer and suggest low is possibly formed, risk rebound to 0.8680, then 0.8700 but price should falter below said resistance at 0.8735, bring further choppy trading later.
Our preferred count is that, after forming a major top at 0.9805 (wave V), (A)-(B)-(C) correction is unfolding with (A) leg ended at 0.8400 (A: 0.8637, B: 0.9491 and 5-waver C ended at 0.8400. Wave (B) has ended at 0.9413 and impulsive wave (C) has either ended at 0.8067 or may extend one more fall to 0.8000 before prospect of another rally. Current breach of indicated resistance at 0.9043 confirms our view that the (C) leg has ended and bring stronger rebound towards 0.9150/54, then towards 0.9240/50.
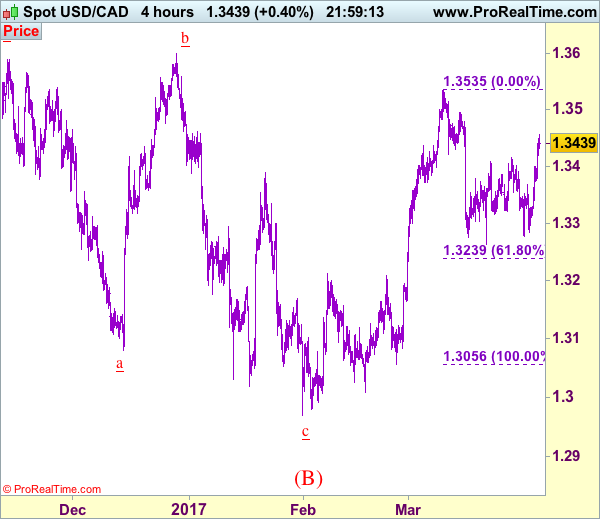
Trade Idea: USD/CAD – Buy at 1.3375
USD/CAD - 1.3443
Recent wave: Only wave v of c has ended at 0.9407 and wave C of major A-B-C correction is underway for headway to 1.4700
Trend: Near term up
Original strategy :
Exit short entered at 1.3340,
Position: - Short at 1.3340
Target: -
Stop: -
New strategy :
Buy at 1.3375, Target: 1.3550, Stop: 1.3315
Position: -
Target: -
Stop:-
As the greenback has surged again today and broke above indicated resistance at 1.3415, suggesting the correction from 1.3535 has possibly ended and consolidation with mild upside bias is seen for further gain to 1.3495-00 but break there is needed to signal upmove has resumed for retest of 1.3535, once this level is penetrated, this would extend recent upmove from 1.2969 to 1.3575-80 but previous chart resistance at 1.3599 should hold on first testing.
In view of this, we are looking to buy on pullback as 1.3370-80 should limit downside and bring another rise. Below 1.3340 would abort and suggest the rebound from 1.3264 has ended instead, bring further fall to 1.3300-10 but said support at 1.3264 should remain intact. Only a break below this level at 1.3264 would shift risk back to downside for the fall from 1.3535 to extend weakness to 1.3235-40 (61.8% Fibonacci retracement of 1.3056-1.3535) and then 1.3200-10.
To recap, wave B from 1.3066 is unfolding as an a-b-c and is sub-divided as a: 1.2192, b: 1.2716 and wave c is a 5-waver with i: 1.1983, ii: 1.2506, extended wave iii with minor iii at 1.0206, wave iv ended at 1.0781 and wave v as well as wave iii has ended at 0.9931, hence the subsequent choppy trading is the wave iv which is unfolding as (a)-(b)-(c) with (a) leg of iv ended at 1.0854, followed by (b) leg at 1.0108 and (c) leg as well as the wave iv ended at 1.0674. The wave v is sub-divided by minor wave (i): 0.9980, (ii): 1.0374, (iii): 0.9446, (iv): 0.9913 and (v) as well as v has possibly ended at 0.9407, therefore, consolidation with upside bias is seen for major correction, indicated target at 1.3700 and 1.4000 had been met and further gain to 1.4700 would be seen later.
British Pound Posted Losses as Construction PMI Softens
GBP/USD has posted losses in the Tuesday session. In the North American trade, GBP/USD is trading at 1.2430. On the release front, British Construction PMI dipped to 52.2, missing the estimate of 52.5 points. In the US, the trade deficit narrowed to $43.6 billion, better than the forecast of $46.0 billion. On Wednesday, all eyes will be on the Federal Reserve, which will publish the minutes of its March policy meeting. As well, the US will release ADP Employment Change and ISM Non-Manufacturing PMI. The UK will release Services PMI.
Britain has entered a new phase in the Brexit saga, as Prime Minister Theresa May gave formal notice its intent to leave the EU last week. The negotiations over the breakup are supposed to be conducted over a two-year period, and are likely to be difficult. The EU has no intention of giving Britain a better deal than it had within the club, and wants the first item of business to be "exit bill" for Britain's share of debts, pensions and other payments, which could run as high as EUR 60 billion. The British government will be under pressure to show the British public that it has reached a good deal, and has threatened to leave the EU without a deal if the EU is intransigent in the negotiations. That scenario, labeled "hard Brexit", would likely take a toll on the British economy and could send the pound downward. Negotiations are unlikely to commence for several months, but we're likely to have plenty of tough talk between the parties in the meantime, which could create volatility for the struggling pound.
The US economy hasn't missed a beat in 2017, and the markets are expecting strong data for the first quarter. The CB consumer confidence report soared to 125.6 in March, and strong consumer confidence levels should translate into increased consumer spending, a key component of economic growth. GDP for the fourth quarter was revised to 2.1%, up from 1.9% in the previous GDP report. With the economy headed in the right direction, the discussions around the monetary policy tables are not whether the Fed will raise rates, but will it press the rate trigger two or three more times in 2017. The markets will be paying close attention to the minutes of the March meeting, when the Fed raised rates by a quarter-point, to a range of 0.75-1.00%. Any hints about the timing of the next hike, as well as the tone of the minutes are factors which could move the currency markets on Wednesday. The markets considered the rate statement overly cautious, and this sentiment sent the US dollar broadly lower. If the reaction to the minutes is one of disappointment, the dollar could again head downwards.
Gold Almost Unchanged, Fed Minutes Loom
Gold is almost unchanged in the Tuesday session. In North American trade, gold is trading at $1255.87 per ounce. On the release front, the trade deficit narrowed to $43.6 billion, better than the forecast of $46.0 billion. On Wednesday, the spotlight will be on the Federal Reserve, which will publish the minutes of its March policy meeting. As well, the US will release ADP Employment Change and ISM Non-Manufacturing PMI.
The US economy hasn't missed a beat in 2017, and the markets are expecting strong data for the first quarter. The CB consumer confidence report soared to 125.6 in March, and strong consumer confidence levels should translate into increased consumer spending, a key component of economic growth. GDP for the fourth quarter was revised to 2.1%, up from 1.9% in the previous GDP report. With the economy headed in the right direction, the discussions around the monetary policy tables are not whether the Fed will raise rates, but will it press the rate trigger two or three more times in 2017. The markets will be paying close attention to the minutes of the March meeting, when the Fed raised rates by a quarter-point, to a range of 0.75-1.00%. Any hints about the timing of the next hike, as well as the tone of the minutes are factors which could move the currency markets on Wednesday. The markets considered the rate statement overly cautious, and this sentiment sent the US dollar broadly lower. If the reaction to the minutes is one of disappointment, gold prices could move higher.
Elliott Wave Analysis: German DAX Intraday View
DAX is trading nicely lower today, probably in the second sub-wave b of a minimum three wave correction that may unfold in wave iv. As such we may see DAX go a little further to the downside, specifically to the 12186 region, before bulls may again bounce higher into final wave v.
German DAX, 1H
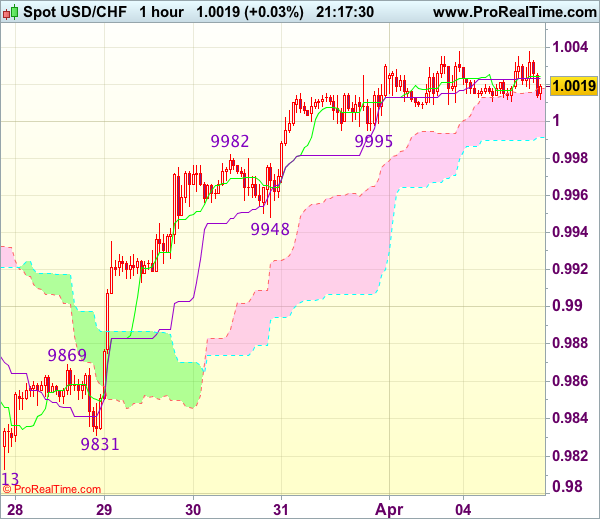
Trade Idea Update: USD/CHF – Buy at 0.9950
USD/CHF - 1.0025
Original strategy :
Buy at 0.9950, Target: 1.0050, Stop: 0.9915
Position : -
Target : -
Stop : -
New strategy :
Buy at 0.9950, Target: 1.0050, Stop: 0.9915
Position : -
Target : -
Stop : -
As the greenback has maintained a firm undertone after last week’s rally above 1.0003 resistance, suggesting recent rise from last week’s low at 0.9813 is still in progress and bullishness remains for this move to extend gain to previous support at 1.0060 (now resistance), however, loss of upward momentum should prevent sharp move beyond resistance at 1.0109, risk from there has increased for a retreat to take place later.
In view of this, would not chase this rise here and would be prudent to buy dollar on pullback as said support at 0.9948 should limit downside. Below 0.9931 (50% Fibonacci retracement of 0.9831-1.0031) would abort and signal top is formed instead, bring correction to 0.9905-10 (61.8% Fibonacci retracement) but reckon previous resistance at 0.9869 would hold from here.