Sample Category Title
EUR/AUD Weekly Outlook
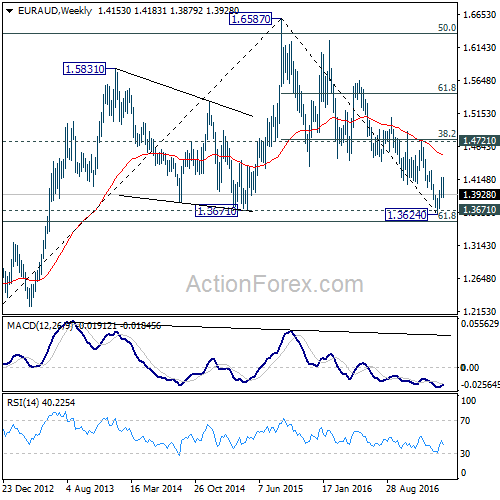
EUR/AUD edged higher to 1.4183 last week but quickly pulled back. Downside of retreat was contained by 1.3874 minor support so far and outlook is unchanged. We'd still slightly favoring the case of trend reversal after defending key support level at 1.3671, on bullish convergence condition in daily MACD.
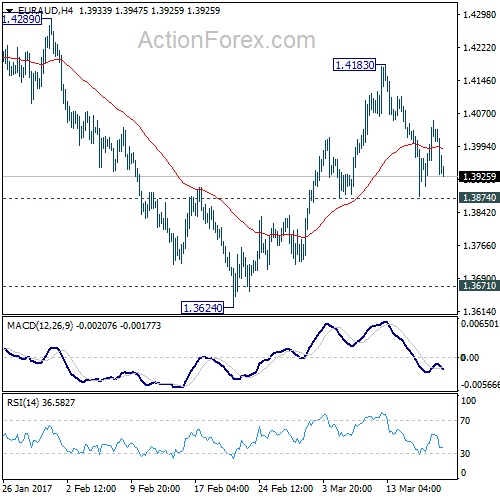
Initial bias stays neutral this week first. On the upside, above 1.4183 will turn bias to the upside for 1.4289 resistance next. Break will affirm our view and target next key resistance level at 1.4721. However, break of 1.3874 minor support will invalidate our view and turn bias back to the downside for retesting 1.3624 low.
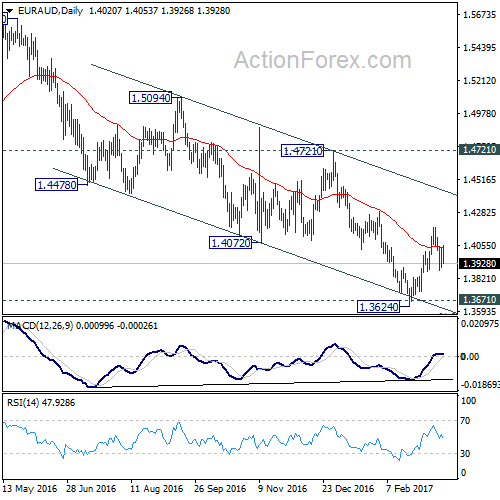
In the bigger picture, price actions from 1.6587 medium term top are viewed as a corrective pattern. We'd expect strong support from 1.3671 key level to contain downside and bring rebound. Up trend from 1.1602 should not be finished and will resume later. Break of 1.4721 resistance will indicate completion of such correction and turn outlook bullish for retesting 1.6587 high. However, sustained break of 1.3671 will invalidate our bullish view and would turn focus back to 1.1602 long term bottom.
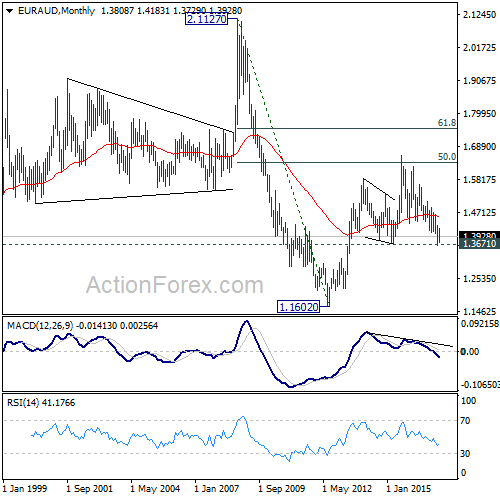
In the longer term picture, the rise from 1.1602 long term bottom isn't over yet. We'll keep monitoring the development but there is prospect of extending the rise to 61.8% retracement of 2.1127 to 1.1602 at 1.7488 and above. However, sustrained trading below 1.3671 should confirm trend reversal and target 1.1602 long term bottom again.
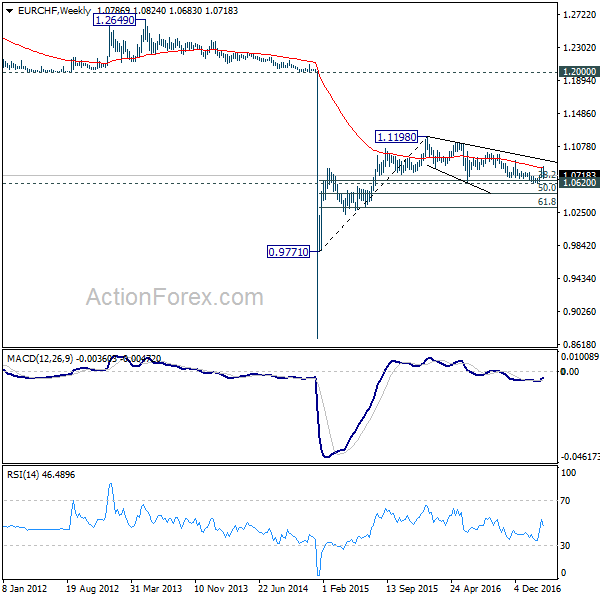
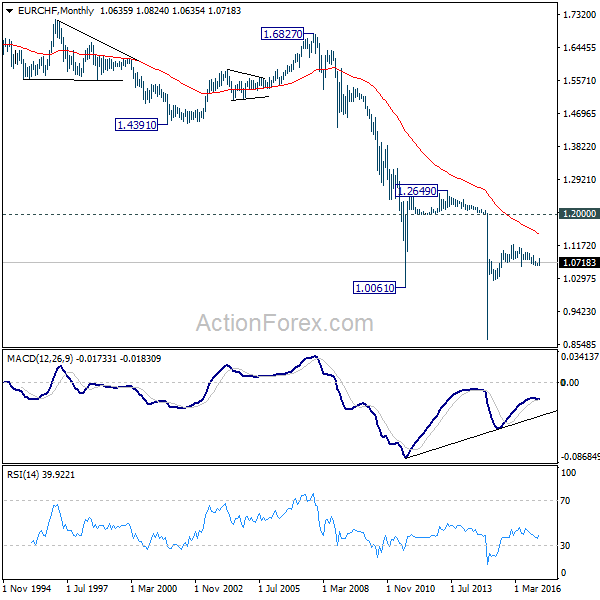
EUR/CHF Weekly Outlook
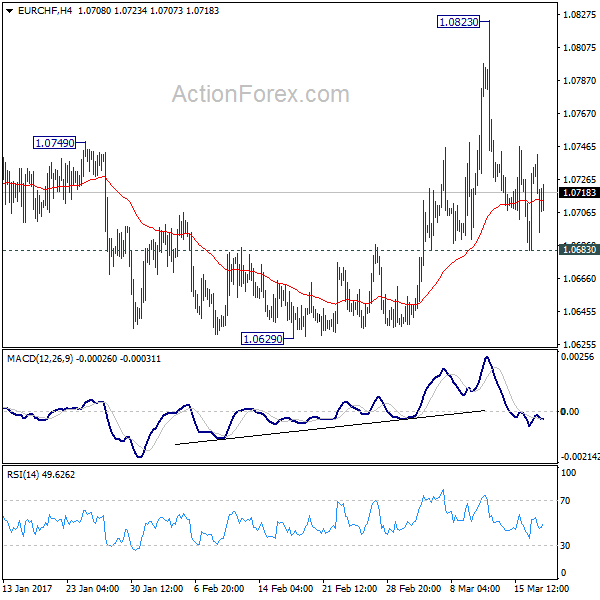
EUR/CHF edged higher to 1.0823 last week but was rejected by 55 week EMA and dropped sharply. The rejection by the falling 55 week EMA mixed up near term outlook. Initial bias stays neutral this week first. On the upside, break of 1.0823 resistance will re-affirm the case of trend reversal. And intraday bias will be turned back tot he upside for 1.0897 resistance for confirmation. However, break of 1.0683 minor support will turn bias to the downside for 1.0620 key support level again.
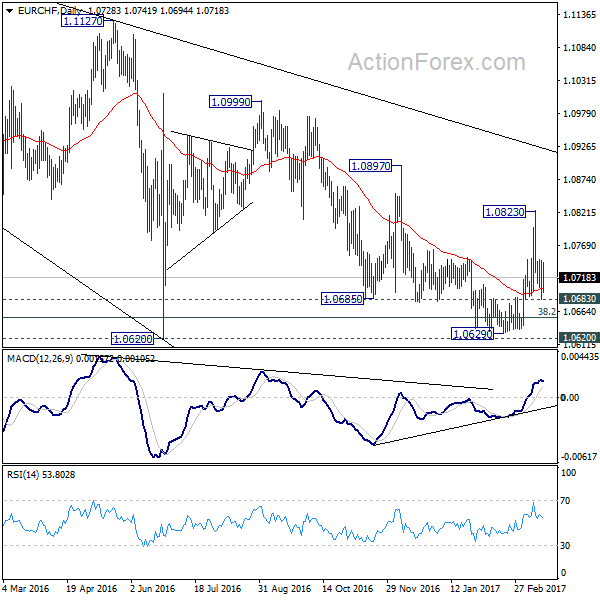
In the bigger picture, the decline from 1.1198 is seen as a corrective move. Decisive break of 1.0897 resistance should confirm that it's completed. And in that case, larger up trend is resuming for another high above 1.1198. Meanwhile, sustained trading below 38.2% retracement of 0.9771 to 1.1198 at 1.0653 will target 50% retracement at 1.0485.
Summary 3/20 – 3/24
Monday, Mar 20, 2017
[php_everywhere] [/php_everywhere]
Tuesday, Mar 21, 2017
[php_everywhere] [/php_everywhere]
Wednesday, Mar 22, 2017
[php_everywhere] [/php_everywhere]
Thursday, Mar 23, 2017
[php_everywhere] [/php_everywhere]
Friday, Mar 24, 2017
[php_everywhere] [/php_everywhere].
Weekly Economic and Financial Commentary
U.S. Review
Two More Rate Hikes in the Cards This Year
- The Federal Reserve raised its short-term target rate 25 bps at its March FOMC meeting, with one dissent. Median projections were largely unchanged and still point to three hikes in 2017 and 2018. We expect some political uncertainty to seep in ahead of the June meeting.
- Headline and core nominal retail sales grew only marginally in February, suggesting a below-trend pace in personal consumption in Q1. Much of the slower pace can be attributed to a delay in tax refund payments. The severe snowstorm that hit the Northeast and parts of the Midwest is expected to pull some seasonally-sensitive monthly indicators lower in March.
Moving Beyond the Noise
The Federal Reserve raised its short-term target rate 25 bps at its March FOMC meeting, with one dissent. Median projections were largely unchanged and still point to three hikes in 2017 and 2018. The target range now rests between 0.75 percent and 1.0 percent. The timing of the next rate hike remains elusive, but with political risks looming including raising the U.S. debt ceiling and use of extraordinary measures (see the Topic of the Week on page 7), reignited Brexit talks, and the first-round for the French presidential election (April 23), some uncertainty is expected to seep in ahead of the June FOMC meeting.
The trend in oil prices will also be important to watch in the coming months, especially as prices have slipped and stockpiles have risen since the early December meeting when OPEC members and non-OPEC nations agreed to cut production. The next OPEC meeting will occur on May 25, and members will undoubtedly reevaluate production levels. As seen in retail sales and consumer prices in February, the slide in oil prices diluted headline activity. That said, with the pass-through from weak oil prices to core inflation largely behind us and goods prices increasing, we expect headline and core prices to continue to firm in the coming months.
Headline and core nominal retail sales grew only marginally in February, suggesting a below-trend pace in personal consumption in Q1. In part, the modest headline sales reading in February reflects a delay in tax refund payments for households that claim earned-income tax credits (EITC) or additional child tax credits (ACTC). According to the Internal Revenue Service (IRS), beginning this year, tax refunds for households that claim EITC or ACTC on their tax return were held until Feb. 15 but did not arrive until the week of Feb. 27. The delay is due to the Protecting Americans From Tax Hikes Act of 2015, which came into effect late last year and seeks to help the IRS verify claims. Such a delay could have some effect on the seasonal adjustment process and absent any adverse weather effect due to the March snowstorm we should see a rebound in activity in March.
Speaking of harsh winter conditions, unseasonably cold temperatures and the Nor'easter will likely show up in seasonallysensitive monthly indicators in March including average weekly hours, initial jobless claims, construction spending, retail sales, utilities output, housing starts and sales activity. In particular, the March storm marked the fifth episode over the past decade that fell on a work day during the nonfarm payroll (NFP) reference week. Indeed, headline NFP only slipped during one significant snowstorm, but the monthly difference in average weekly hours tumbled during each bout and the number of persons who usually work full time but had reduced hours due to bad weather also surged. Although headline NFP will likely be less affected by weather, other indicators could see an outsized downward swing in March as the snowstorm followed unusually mild temperatures in February. Putting it all together, Q1 economic activity is on track to register a weak reading, but activity should rebound in Q2.
U.S. Outlook
Existing Home Sales • Wednesday
Existing home sales started 2017 on a strong note, with sales climbing 3.3 percent in January to a 5.69 million-unit pace. Home sales are now running at their strongest pace since the recession.
Inventory of single-family homes remained relatively unchanged at a 3.6 month supply. The persistence of historically low for-sale inventory is a big reason why prices continue to consistently beat expectations to the upside. The median price of an existing home rose a sizable 7.1 percent year over year in January.
The solid start to the year bodes well for Q1 estimates of realtors' commissions, which show up in the residential investment component of GDP growth. That said, the late-winter storm that has affected much of the Northeast in mid-March may have had a negative effect on sales activity at the start of the spring home buying season.
Previous: 5.69 Million Wells Fargo: 5.52 Million Consensus: 5.58 Million
New Home Sales • Thursday
The pace of new home sales rose 3.7 percent to seasonally adjusted annualized rate of 555,000 units in January, partially recovering December's loss. Sales for November and October were revised down, however. The lower sales figures suggest the post-election bump in mortgage rates may have taken a larger bite out of new home sales than previously reported.
With January's gain, new home sales are up 5.5 percent on a yearover- year basis. Sales rose in every region except the West during the month. The unusually-wet weather in the West may have held back sales in January, but sales are still trending up on a threemonth moving basis. We expect new home sales to remain solid heading into the spring buying season, as market fundamentals, including homebuilder confidence and steady job growth, remain consistent with continued improvement in home sales. We look for sales to increase 2.5 percent to a rate of 569,000 units in February.
Previous: 555,000 Wells Fargo: 569,000 Consensus: 565,000
Durable Goods • Friday
Durable goods orders rose a larger-than-expected 1.8 percent in January. Despite the improvement in the headline, the details were less encouraging. Most of the pickup was due to an increase in the notoriously-volatile aircraft orders component, as government outlays on defense aircraft climbed 59.9 percent and civilian aircraft orders surged 69.9 percent. Stripping away the noise of transportation-related industry sectors, orders actually fell slightly in January. Moreover, core capital goods shipments—a proxy for current business spending—and orders of core capital goods—a leading indicator for future business spending—both declined in January. In each case, however, January's drop followed upwardlyrevised figures for December.
Given the firming we have seen in survey data, from the NFIB survey of small businesses to the ISM survey of manufacturers, we think January's stall in orders is likely temporary. continue to firm in 2017.
Previous: 1.8% Wells Fargo: 1.2% Consensus: 1.0% (Month-over-Month)
Global Review
Bank of England Keeps Rates Unchanged
- As largely expected, the Bank of England (BoE) voted in favor of keeping monetary policy unchanged at 0.25 percent at its meeting this week. Minutes from the meeting showed that the vote was non-unanimous with one dissenter voting to increase rates to 0.50 percent.
Strong Start to the Chinese New Year
- Data this week showed that China's economy started the year off on solid footing. China's fixed-asset investment and industrial production bested market expectations, while retail sales grew slower than expected due to weakness in auto sales.
Bank of England Keep Rates Unchanged
The U.K. economy has performed better than many had expected since the Brexit vote. In fact, the BoE nudged up its Q1 GDP forecast to 0.6 percent from 0.5 percent on non-annualized basis, last month. At its recent meeting, the central bank voted in favor of keeping monetary policy unchanged. Minutes from the meeting showed that the vote was non-unanimous, as one Monetary Policy Committee member voted to raise rates to 0.50 percent. The minutes also noted that the bank is willing to allow inflation to run above the 2 percent target temporarily to protect jobs and growth.
The jobless rate in the U.K. has declined to 4.7 percent—the lowest rate since 1975—and nearing "full" employment. At the same time, average weekly earnings are growing slower than expected; indicating that wage growth is not picking up with underlying inflation and could weigh on the consumer driven economy. That said, the tightness in the labor market should put pressure on wages.
The pickup in inflation makes a convincing case for a rate hike later this year. However, we do not expect for the BoE to do this as there have been no wage acceleration to support inflation and recent data point to weak spots in the economy. This, in addition to uncertainty surrounding Brexit negotiations and the triggering of Article 50 next month, leads us to believe that the BoE will keep rates unchanged for the remainder of the year.
Strong Start to the Chinese New Year
China released its latest fixed-asset investment, retail sales and industrial production (IP) data this week. Fixed-asset investment, which includes capital spent on infrastructure, real estate, machinery spending across the economy, grew 8.9 percent in January and February, besting expectations for an 8.3 percent gain. Investments by state-owned businesses also increased. The Chinese government has relaxed credit lending standards in the hopes of spurring real estate demand, which has paid off as residential investment has picked up over the past two quarters.
Growing demand for steel to meet the increase in infrastructure spending and a rebound in real estate investment has been a major boon to IP, up 6.3 percent year over year during January and February. The first two months of the year are typically combined to account for the time of the Lunar New Year holiday.
Retail sales figures, on the other hand, were lukewarm, expanding at a less-than-expected 9.5 percent clip during the January- February period and undershoot market expectations of a 10.6 percent increase. Disappointing automobile sales, as result of the government reducing tax breaks for small cars, weighed on growth, while consumers favored online shopping, which jumped 31.9 percent.
As the Chinese government moves away from debt driven growth and avoids a hard landing, the strength of the economy will depend largely on investment growth, as fiscal policy becomes less supportive. This will prove to be difficult to sustain over the long term as weak consumption will weigh on growth. On balance, this week's data suggest that the economy started the year strong, but we expect growth to slow to 6.3 percent for 2017.
Global Outlook
Canadian Retail Sales • Tuesday
The Canadian economy slipped into a mild recession in early 2015 following the collapse in energy prices. Resilience in consumer spending during that period prevented, at least in part, the downturn from becoming deeper, and growth in Canadian consumer spending has generally remained solid subsequently. That said, retail sales slipped 0.5 percent in December relative to the previous month. Data that are slated for release on Tuesday will show how retail spending started the year.
CPI data for February are on the docket on Friday. The overall rate of CPI inflation is currently 2.1 percent, essentially in the middle of the Bank of Canada's target range of 1 percent to 3 percent. However, different measures of the core rate of inflation remain below the mid-point. Consequently, we look for the bank to keep its main policy rate unchanged at 0.50 percent, where it has been maintained since July 2015, for the foreseeable future.
Previous: -0.5% (Month-over-Month)
U.K. Retail Sales • Thursday
Consumers in the United Kingdom were the star economic performers in the British economy through most of last year. However, the volume of retail sales has contracted in four of the past five months, and real sales were up only 1.5 percent in January, the weakest year-over-year growth rate in three years. Did spending rebound in February? Data on the docket on Thursday will help gauge the current state of consumer spending.
Higher inflation may be weighing on growth in consumer spending recently. Consumer prices started 2016 more or less flat on a yearago basis. However, the most recent reading on CPI inflation had consumer prices up nearly 2 percent. Higher inflation helps depress growth in real spending via erosion in purchasing power. CPI inflation for February will print on Tuesday. Further acceleration in consumer prices could eventually induce the Bank of England to raise rates.
Previous: -0.3% (Month-over-Month) Consensus: 0.4%
Eurozone PMIs • Friday
The purchasing managers' indices in the Eurozone have risen sharply in recent months. In February, both PMIs stood above 55, the highest readings for both indices since early 2011. Unfortunately, incoming "hard" data do not exhibit the same level of economic resilience. For example, industrial production (IP) in the euro area was growing in excess of 4 percent (year 0ver year) in early 2011, the last time the manufacturing PMI exceeded 55. The underlying growth rate of IP today is about 2 percent. The March PMIs, which will print on Friday, will be interesting, but they may not tell analysts much about the "true" state of economic activity in the Eurozone today.
The ECB will conduct a quarterly tender for its Targeted Long-Term Refinancing Operations (TLTRO) on Thursday. Strong interest by banks in the Eurozone would indicate that growth in bank lending could strengthen further in coming months.
Manufacturing PMI:55.4 Consensus: 55.3 Services PMI:55.5 Consensus: 55.3
Point of View
Interest Rate Watch
Cyclical and Secular Credit Trends
Patterns in credit reveal clues about the cyclical and long-term character of credit trends and the ability of those markets to sustain economic growth.
Net lending at commercial banks (top graph) provides an excellent illustration of cyclical and secular trends. Net lending exhibits a clear pattern of peaking before the onset of a recession. This may appear surprising since bank lending is considered a lagging indicator of the economic cycle. In contrast, the actual behavior is that bank lending actually leads the cycle at the top and is coincident with the cycle on the upturn.
Meanwhile, the longer-term trend since the early 1990s was clearly on the upswing until the 2008-2009 recession. Yet, again in contrast to conventional wisdom, net lending has returned to a new high in recent quarters.
Who's Borrowing?
Since the Great Recession, the biggest boom in credit market debt has been the government sector, not the household or the nonfinancial corporate sector (middle graph). Nonfinancial corporate debt has risen in the current expansion but remains much closer to historical levels than its government counterpart.
Meanwhile, the household sector exhibits a cyclical pattern that typically peaks as a recession begins but there is a modest longer-term upward trend that does not exhibit the amplitude of the nonfinancial and government sectors.
Government debt is the true outlier for two reasons. First, the current share of GDP is at all-time highs for government debt. Second, the break out since the Great Recession has been out of character since the 1960s.
Corporate CFOs as Rational Actors
Consistent with expectations, the steady decline in AA corporate bond yields has been accompanied by a steady decline in short-term debt as a share of total debt (bottom graph). Long-term financing has steadily increased since the mid-1980s as would be consistent with the same interest rate downtrend.
Credit Market Insights
Household Wealth Hits New Record
The Federal Reserve's Financial Accounts of the United States for Q4 2016 show that household wealth in the United States increased $2.04 trillion to a hit a fresh record high of $92.8 trillion at the end of 2016. The strong stock market performance after the election certainly played a role, as did house price growth. Households' financial assets, which reflect investment wealth, rose 2.1 percent in Q4, while nonfinancial assets, which include real estate values, rose 1.9 percent.
Households accumulated debt at a slightly slower pace in Q4, rising at a 3.8 percent annual rate, down from 3.9 percent in Q3. Consumer credit debt growth was behind the slowdown, as home mortgage debt rose at a slightly faster pace.
Consumer credit followed a similar path in the first month of 2017, according to the Federal Reserve's monthly consumer credit report. January marked the smallest one month increase in consumer debt since 2012, reflecting households paying down credit card balances, as auto and student loans rose on the month.
Taken together, households' balance sheets are in good shape on the aggregate. The average consumer is less burdened by credit card debt, while rising stock market and home values add to wealth. This bodes well for future personal consumption as households are increasingly comfortable with their financial situation, triggering the wealth effect and encouraging spending.
Topic of the Week
Debt Ceiling Hike a Ways Off
The nation's borrowing limit has been suspended since November 2015 and on March 15, will reset to the total amount borrowed at that point in time, or roughly $20 trillion. Thursday of this week the Treasury began taking extraordinary measures to stay under the borrowing limit. These extraordinary measures, combined with the influx of revenues from tax collections in April, will keep the Treasury under the debt limit and with enough cash on hand to continue funding the government's existing obligations.
The Congressional Budget Office (CBO) estimates a federal budget deficit for the current federal fiscal year of $559 billion. The CBO's estimate of the budget deficit, however, relies on current law remaining unchanged. The current federal funding bill runs out on April 28, by which time Congress will need to enact another continuing resolution to keep the government operating. In our assessment, this new funding bill will be the product of bipartisan negotiations and thus will likely result in a higher budget deficit for the current fiscal year, $650 billion, in our view. Should our base case unfold, it is likely that Congress will need to lift the borrowing limit later this summer or at least before the end of the fiscal year in September. The exact timing will depend on the spending level agreed to next month as well as revenue collections in the coming months. We expect Congress will agree to a clean debt ceiling increase in April 2017 when it passes the next funding bill in order to avoid a contentious debate after the August recess.
During the last instance of the re-establishment of the debt ceiling from March to November 2015, there was little effect on net Treasury issuance while the Department of the Treasury enacted extraordinary measures to stay under the borrowing limit. We expect similar dynamics to play out this time. For further reading see our special report Capitol Hill Update: Debt Ceiling Hike a Ways Off available on our website.
The Weekly Bottom Line
HIGHLIGHTS OF THE WEEK
United States
- The Fed carried out its well-telegraphed rate hike this week. Despite the Fed's hawkish messaging in advance of the decision, its expectations for rate increases were unchanged, leading bond yields to dip.
- The Fed edged up its economic forecast for 2018, as did TD Economics in our latest forecast, released this week.
- Overseas, one populist threat to the Eurozone was vanquished this week as the populist right-wing party lost the Dutch election. However, the UK is days away from triggering the two-year Brexit negotiation process with the EU, so the risk of euro-driven market volatility remains.
Canada
- Economic growth in Canada continues to surpass expectations. With recent data on manufacturing sales, growth in the first quarter appears likely to surpass our recent forecast of 2.6% (annualized). This would mark the third straight quarter that growth came in above 2.5%.
- The Canadian housing market is the gift that keeps on giving. The further prices and sales appear to move from fundamentals, the bigger the risk of a correction. The downside risk is greatest in the Greater Toronto Area where prices are up 24% year-on-year.
- To deal with housing, the Bank of Canada prefers macro-prudential tools to the blunt instrument of interest rate policy. With scant inflation, the central bank is likely to remain on hold through 2018. While further upside surprises to growth could pull rate hikes forward, a sharper turn negative in housing could just as easily push rate hikes even further into the future.
UNITED STATES - THE FED TAKES ANOTHER STEP ON THE RATE HIKE TIGHTROPE
Markets were cautiously optimistic this week as the Fed carried out its well-telegraphed rate hike, and one populist threat to the euro zone was vanquished in the Dutch election. The Fed hiked the funds rate 25 basis points, to a range between 0.75% and 1.0%. Bonds rallied in the wake of the decision, since the hawkish rhetoric leading up to the decision was not born out in a more aggressive pace of rate hikes in the Fed's "dot" plot. The Fed continues to expect to raise rates three times in total in 2017, unchanged from its December forecast. Even with a dip downwards in yields this week, the 5-Year Treasury yield remains close to a sixyear high(see Chart).
During the press conference, Yellen characterized the economy as "progressing nicely", and that the Fed views three hikes per year as a "gradual" pace in the current environment. While the median interest rate projection remained unchanged, the number of dots at the median rose (from six to nine). The Fed's economic projections told a similar story, edging up by 0.1 percentage point its outlook for core inflation in 2017 and its outlook for economic growth in 2018. In other words, FOMC members are a bit more confident, but no more hawkish, than they were in December.
The Fed was not alone in nudging up its forecast. In our latest economic forecast released this week, we also bumped up our forecast for growth in 2018. The upgrade is largely owing to a more optimistic forecast for domestic demand, and business investment in particular. Measures of business sentiment have largely held on to their post-election jumps, and we expect that optimism will translate into increased spending over the next two years. Particularly now that the weakness in corporate profits appears to have turned around, and the worst is over in the oil patch.
As always, there are upside and downside risks to the outlook. The most notable upside risk stems from fiscal policy. We continue to believe it is too early to include any potential boost from the kinds of tax cuts or infrastructure spending that was promised during the campaign. As evidenced by the current debate on healthcare reform, it is going to take time for Republican members of Congress and the White House to reach an acceptable compromise on these key policy priorities. Therefore, we expect any fiscal boost to be a factor in the 2018 outlook and beyond, not this year.
Like the Fed, we also expect a gradual pace of rate hikes this year. Downside risks to the forecast have not entirely vanished. Concerns stemming from political uncertainty in Europe did clear one hurdle this week with the Dutch election result. But, France's Presidential elections loom (on April 23rd and May 7), and the UK is on the cusp of triggering two years of Brexit negotiations with the EU. The potential for euro-driven market volatility to disturb markets' current placid optimism is real. And on this side of the pond, the risk that the Trump administration moves from rhetoric to real protectionist measures on trade also looms.
Taking a step back to the here and now, the U.S. economy is doing well. The Fed must now walk a tightrope balancing the need to remove monetary stimulus against the risk of taking rates too high, which would dampen domestic growth too much or trigger risks abroad.
CANADA - LET THE GOOD TIMES ROLL
Economic growth in Canada continues to surpass expectations. With recent data on manufacturing sales, growth in the first quarter of this year appears likely to surpass our recent forecast of 2.6% (annualized). This would mark the third quarter that growth came in above the mid-2% mark.
The strong economic performance has been echoed in robust job creation, falling unemployment and rebounding labor force participation. In February, the unemployment rate fell to 6.6% (from 6.8%), while the employmentto- population ratio of prime working-age people (those between 25 and 54) rose to its highest level since the 2008 recession (Chart 1). Even the seeming turn toward part-time employment that characterized 2016, appears to be reversing. Full-time job creation over the past three months is running at the fastest rate in over seven years.
The rebound in growth is explained in large part by the recovery in the oil patch, where the turn-up in energy prices has helped. Our recently published forecast expects the oil and gas sector to lead economic growth over the next year. Following close behind is the construction sector, benefiting from the energy rebound as well as residential real estate activity that continues to push full-steam ahead.
And here in lies the rub. The housing market has been the gift that keeps on giving, but there are legitimate worries about how long this can be sustained. The further prices and sales appear to move away from fundamentals, the more pronounced the risk of a correction (Chart 2). The downside risk is greatest in the Greater Toronto Area where prices are up 24% year-on-year, amidst low inventories. One need not go out on a limb to say this appears excessive. Even with strong population growth, sales relative to population have pushed above historic levels.
The vulnerability to housing correction is the main source of downside risk to the Canadian economy. Periods of such rapid appreciation are generally followed by corrections. However, in the near-term, without a major catalyst, the housing market appears likely to keep on chugging. Higher mortgage rates and tighter regulations have so far appeared to have little effect on the market, and further increases may also be taken in stride given their likely gradual pace.
All of this brings into question how the Bank of Canada should respond. In terms of housing, the Bank has been consistent that it prefers macro-prudential tools to the blunt instrument of the overnight rate. Instead the Bank's policy will be guided with reference to the outlook for inflation. And, apart from rebounding energy prices, inflation pressures appear scant. The average of the Bank of Canada's trio of core inflation measures is sitting at 1.6% - well shy of target.
At the same time, the Bank has expressed increasing concern for external risks. Given this sensitivity and its desire to support a rotation toward exports, which relies on a competitive exchange rate, we expect the Bank of Canada to remain on hold through the this year and well into 2018. While further upside surprises to economic growth could pull this forward, a sharper correction in the housing market could just as easily push rate hikes even further into the future.