Sample Category Title
More Downside in Dollar and Yield after a Week of Volatility
There were some major surprises in the markets, much volatility and some interesting developments, last week. Dollar ended the week as the weakest major currency as markets were clearly disappointed by the outcome of the dovish FOMC rate hike. Technical developments in Dollar index and treasury yields suggest that more down would be seen in near term. There were some good reasons for Euro to surge last week. Those factors include speculations of ECB rate hike by the end of the year, as well as the Euro-friendly results of Dutch elections. But the common currency did end up as the second weakest one. In particular, the sharp pull back of EUR/CHF from as high as 1.0823 to close at 1.0718 indicates that traders are still concerned with political uncertainties ahead. On the other hand, Australian dollar ended as the strongest major currency last week in spite of weak employment data. Sterling followed as the second strongest major currency after hawkish BoE minutes. Also, FTSE 100 closed at new record high despite all the Brexit and Scexit news.
Dollar sold off on Fed disappointment
To recap, Fed raised federal fund rates by 25bps to 0.75-1.00% as widely expected. The disappointment comes from effectively no upward revision in the projected rate path. The median projection of federal fund rates was held at 1.4% by the end of 2017, same as December projection. Median projection for rate by the end of 2.18 was held at 2.1%, also same as December projection. Median projection for rate by the end of 2019 was revised by a mere 0.1% to 3.0%. More in FOMC Delivered, Market Disappointed.
Minneapolis Fed Kashkari explained his dissent
It should also be noted that Minneapolis Fed president Neel Kashkari dissented on rate hike and voted for keeping it unchanged. He explained on Friday that he'd prefer to wait until there is a detailed "balance sheet plan" before raising interest rate. He noted that shrinking the balance sheet would "trigger somewhat tighter monetary conditions." And, "after it has been published and the market response is understood, we can return to using the federal funds rate as our primary policy tool, with the balance sheet normalization under way in the background." This balance sheet normalization first, rate hike later approach is clearly different from Fed chair Janet Yellen's and some other members', for the moment. But more policy makers could lean towards this approach after the federal fund rate is raised a few more times.
Another thing to note is that Fed was clear that fiscal policies, with the lack of details, are not being considered in latest economic projections. Dollar bulls would likely need to at least see that realized in the projections before commiting more on the greenback's up trend. But it would probably take some more time for US president Donald Trump to move his focuses back from travel ban and military spending into things like tax reforms and others.
Dollar index heading to 97.66
Last week's sharp fall confirmed that dollar index's corrective rise from 99.23 is finished at 102.26. More importantly, fall from 103.82 is resuming. Near term outlook is bearish for a test on 99.23 support first. Break will target 100% projection of 103.82 to 99.23 from 102.26 at 97.66. Considering that it's close to 55 week EMA (now at 98.51) we'd tentatively expect strong support from there to contain downside.
TNX to fall back to 2.314
TNX's rejection from 2.621 resistance suggests short term topping again. There are two main interpretations of the price actions. Firstly, consolidation from 2.621 is extending with fall from 2.615 as the third leg. Secondly, rise from 2.314 to 2.615 is a failure fifth that ends the whole impulsive rally from 1.336. In both cases, TNX should now head to 55 day EMA at 2.435 and sustained break will target 2.314 and below. But still, in both cases, we'd expect strong support from around 38.2% retracement of 1.336 to 2.621 at 2.130 to contain downside and bring up trend resumption. This is in line with the outlook in dollar index.
Sterling jumped on hawkish BoE
To the market's surprises BoE MPC member Kristin Forbes voted in favor of a 25 bps rate hike last week. While this had not altered the decision of keeping the Bank rate unchanged at 0.25%, the overall message sent to the public has now become more hawkish. The members voted unanimously to leave the government bond purchases at 435B pound and corporate bond purchases at up to 10B pound. Adding to the rising speculations of tightening is the minutes, which suggested that some of those who voted for unchanged policy believed 'it would take relatively little further upside news on the prospects for activity or inflation for them to consider that a more immediate reduction in policy support might be warranted'. More in Forbes' Dissent Would Unlikely Speed Up BOE's Rate Hike Schedule.
FTSE closed at record high
The interesting development is that FTSE 100 surged to new record high and closed strongly at 7424.96 last week. It should be noted that it came with speculation of rate hike by early next year and rebound in Sterling in the background. And UK prime minister Theresa May has cleared the way to trigger Article 50 for Brexit later in the month. And Scotland is calling for another independence referendum after Brexit agreement is settled. The strength in UK stocks is indeed a statement. The coming weeks will be important to seen if both Sterling and stock could remain in sync to move higher.
Technically, FTSE is now pressing a key long term channel resistance. Rejection from there and break of 0.7093.56 will indicate reversal and drag the index below 55 week EMA (now at 6855.44). However, further upside acceleration would send the index to 100% projection of 4791.01 to 7122.74 from 5499.50 at 7831.24. And that could help pull some funds back into Sterling assets.
Aussie to look at China stocks for guidance
The Australian dollar outperformed other major currencies last week despite disappointing employment data. The diminishing chance of another rate cut by RBA is seen as a factor as the housing markets were heating up again in recent months. Two major Australian banks, NAB and Westpac has hiked mortgage rates this month blaming surging wholesale funding costs. Meanwhile, developments in China could be another factor favoring Aussie. China's PBoC raised key short term repo rate and medium term MLF rate last week. PBoC said that the hikes doesn't constitute a benchmark rate increase. But some analysts said that's a sign of acceleration in tightening. The SSE composite jumped to as high as 3274.19 before reversing sharply on Friday. It remains to be seen if the index can take out key medium term resistance at 3301.21. That could be another factor in deciding Aussie's fate.
To sell USD/JPY this week
Regarding trading strategies, our EUR/AUD long, entered at 1.3900, was stopped out at 1.4000 with 100 pips profit last week due to the deeper than expected pull back from 1.4183. The development dampened our bullish view of medium term trend reversal and we will move away from the cross first. We bought USD/JPY at 114.00 last week but that was quickly stopped out at 113.50 as Fed disappointed the markets. As noted above, we're expecting near term weakness in both Dollar and treasury yields. That makes selling USD/JPY a choice to ride on the developments. Hence, we will send USD/JPY on recovery to 113.50 this week, with stop at 114.50. We'd expect a test on 111.12/13 as the whole fall from 118.65 resumes.
USD/JPY Weekly Outlook
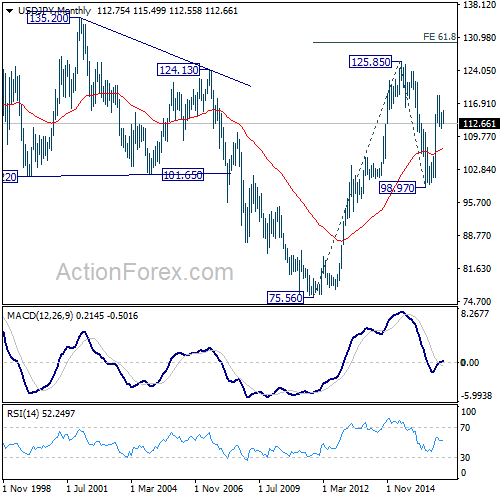
USD/JPY's fall from 115.49 accelerated last week and the development invalidated our original bullish view. Instead, it suggests that price action from 111.58 are a consolidation pattern and is completed with three waves to 115.49. And the corrective decline from 118.65 is resuming.
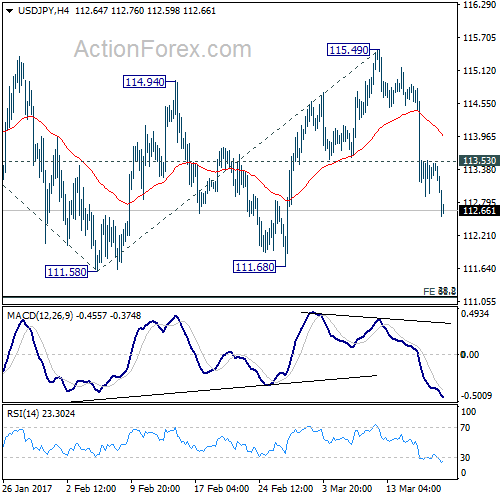
Initial bias remains on the downside this week for 111.58 and below. At this point, we'd tentatively expect strong support from 111.12/13 cluster support to contain downside. This level represents 61.8% projection of 118.65 to 111.58 from 115.49 at 111.12 and 38.2% retracement of 98.97 to 118.65 at 111.13. On the upside, above 113.53 minor resistance will turn bias to the up for 115.49 resistance. However, sustained break of 111.12/13 will bring deeper decline to 100% projection of 118.65 to 111.58 from 115.49 at 108.42.
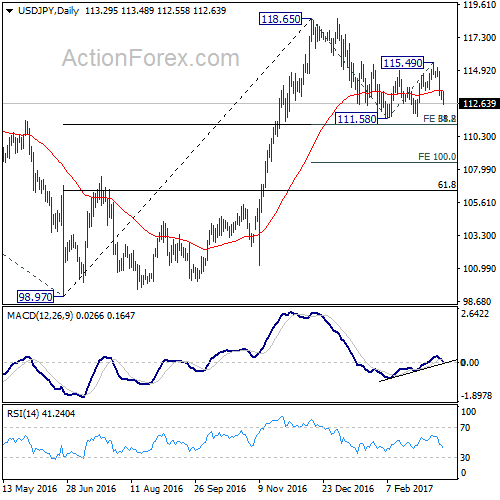
In the bigger picture, price actions from 125.85 high are seen as a corrective pattern. The impulsive structure of the rise from 98.97 suggests that the correction is completed and larger up trend is resuming. Decisive break of 125.85 will confirm and target 61.8% projection of 75.56 to 125.85 from 98.97 at 130.04 and then 135.20 long term resistance. Nonetheless, sustained trading below 55 week EMA (now at 111.08) will extend the consolidation from 125.85 with another fall through 98.97 before completion.
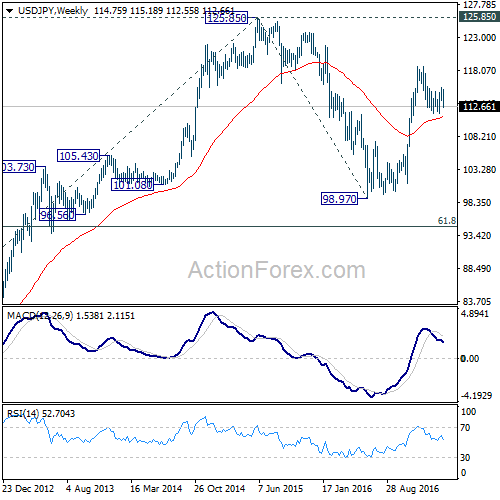
In the long term picture, the rise from 75.56 long term bottom to 125.85 medium term top is viewed as an impulsive move. Price actions from 125.85 are seen as a corrective move which could still extend. But, up trend from 75.56 is expected to resume at a later stage for above 135.20/147.68 resistance zone.
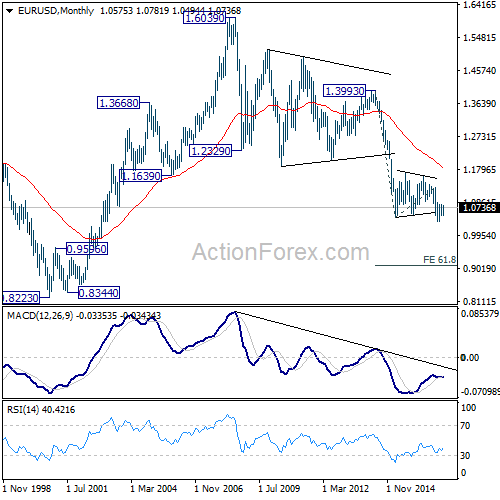
EUR/USD Weekly Outlook
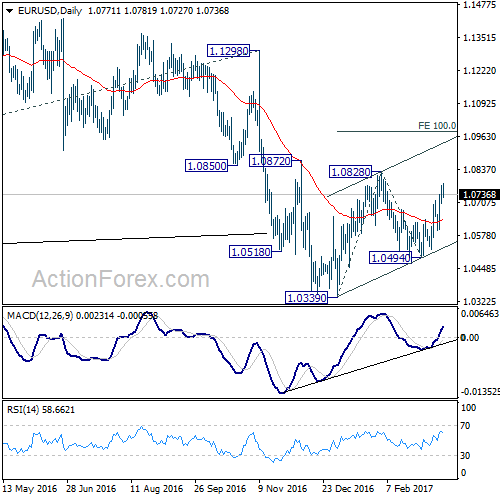
EUR/USD's rebound from 1.0494 accelerated higher last week. The development dampened our bearish view of down trend resuming. Instead, it suggest that corrective rise from 1.0339 is still in progress. And further rise would be seen through 1.0828 resistance in near term.
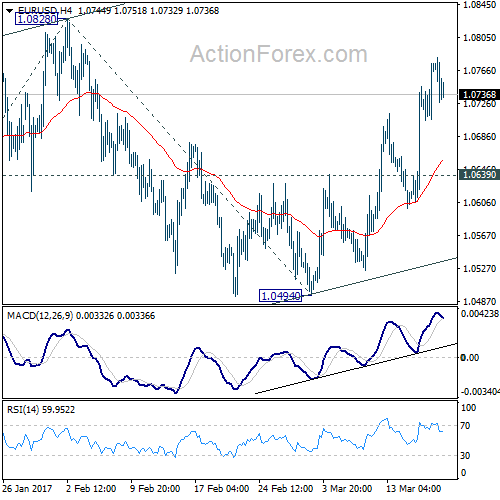
Initial bias in EUD/USD stays on the upside this week for 1.0828 resistance and above. However, since rise from 1.0339 is seen as a corrective move. We'd upside to be limited by 100% projection of 1.0339 to 1.0828 from 1.0494 at 1.0983 to bring larger down trend resumption eventually. On the downside, break of 1.0639 minor support will turn bias back to the downside for 1.0494 support.
In the bigger picture, as long as 1.1298 key resistance holds, whole down trend from 1.6039 (2008 high) is still expected to continue. Break of 1.0339 low will send EUR/USD through parity to 61.8% projection of 1.3993 to 1.0461 from 1.1298 at 0.9115.
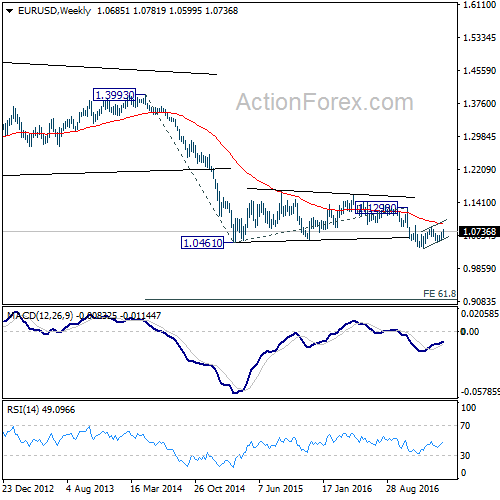
In the long term picture, the down trend from 1.6039 (2008 high) is still in progress and there is no clear sign of completion. We'd expect more downside towards 0.8223 (2000 low) as long as 1.1298 resistance holds. However, firm break of 1.1298 should now confirm long term reversal.
USD/JPY Weekly Outlook
USD/JPY's fall from 115.49 accelerated last week and the development invalidated our original bullish view. Instead, it suggests that price action from 111.58 are a consolidation pattern and is completed with three waves to 115.49. And the corrective decline from 118.65 is resuming.
Initial bias remains on the downside this week for 111.58 and below. At this point, we'd tentatively expect strong support from 111.12/13 cluster support to contain downside. This level represents 61.8% projection of 118.65 to 111.58 from 115.49 at 111.12 and 38.2% retracement of 98.97 to 118.65 at 111.13. On the upside, above 113.53 minor resistance will turn bias to the up for 115.49 resistance. However, sustained break of 111.12/13 will bring deeper decline to 100% projection of 118.65 to 111.58 from 115.49 at 108.42.
In the bigger picture, price actions from 125.85 high are seen as a corrective pattern. The impulsive structure of the rise from 98.97 suggests that the correction is completed and larger up trend is resuming. Decisive break of 125.85 will confirm and target 61.8% projection of 75.56 to 125.85 from 98.97 at 130.04 and then 135.20 long term resistance. Nonetheless, sustained trading below 55 week EMA (now at 111.08) will extend the consolidation from 125.85 with another fall through 98.97 before completion.
In the long term picture, the rise from 75.56 long term bottom to 125.85 medium term top is viewed as an impulsive move. Price actions from 125.85 are seen as a corrective move which could still extend. But, up trend from 75.56 is expected to resume at a later stage for above 135.20/147.68 resistance zone.
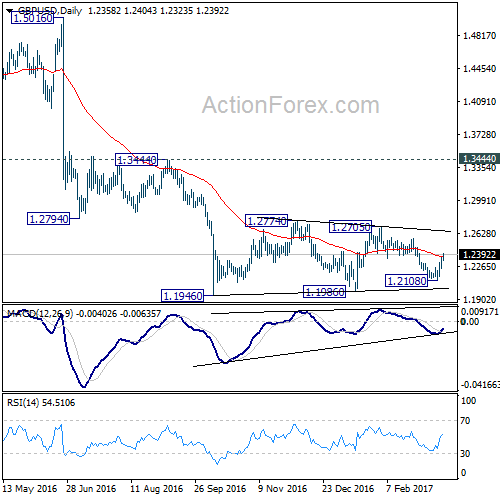
GBP/USD Weekly Outlook
GBP/USD's edged lower to 1.2108 last week but rebounded strongly since then. The development suggests that consolidation pattern from 1.1946 is extending with another rising leg. And the larger down trend is not ready to resume yet.
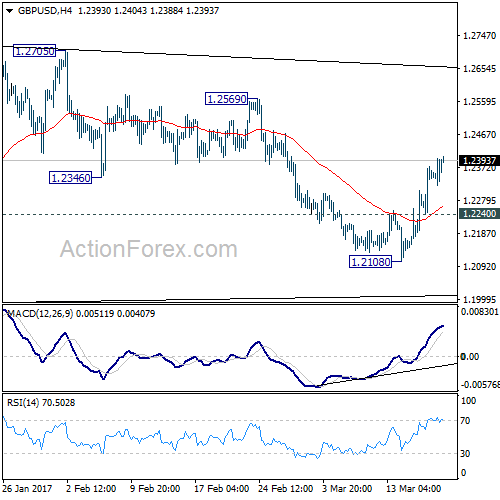
Initial bias in GBP/USD remains on the upside this week for 1.2568 resistance. Break will target 1.2705/74 resistance zone next. At this point, we'd expect strong resistance from 1.2705/2774 to limit upside to extend the sideway pattern. Break of 1.2240 minor support will turn bias back to the downside for 1.2108 support. Though, sustained break of 1.2774 will extend the rise towards 1.3444 key resistance level.
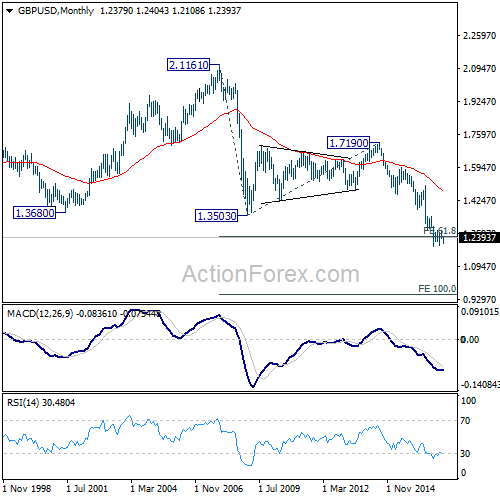
In the bigger picture, fall from 1.7190 is seen as part of the down trend from 2.1161. There is no sign of medium term bottoming yet. Sustained trading below 61.8% projection of 2.1161 to 1.3503 from 1.7190 at 1.2457 will target 100% projection at 0.9532. Overall, break of 1.3444 resistance is needed to confirm medium term bottoming. Otherwise, outlook will remain bearish.
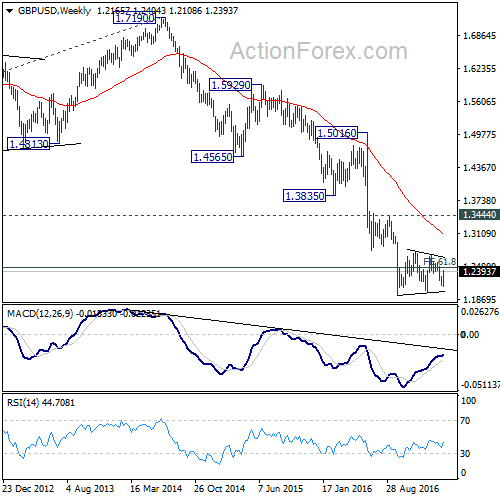
In the longer term picture, no change in the view that down trend from 2.1161 is still in progress. Current momentum suggests that the down trend will go deeper than originally expected to 100% projection of 2.1161 to 1.3503 from 1.7190 at 0.9532.
USD/CHF Weekly Outlook
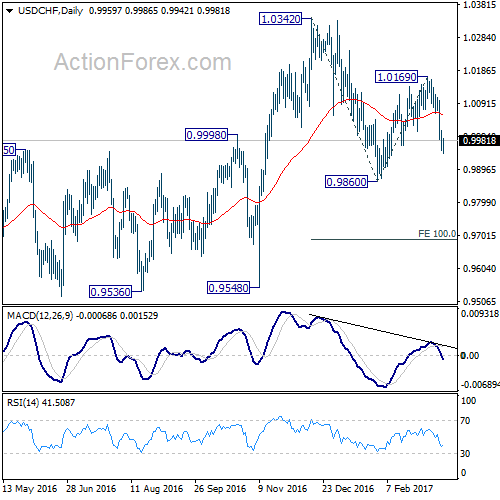
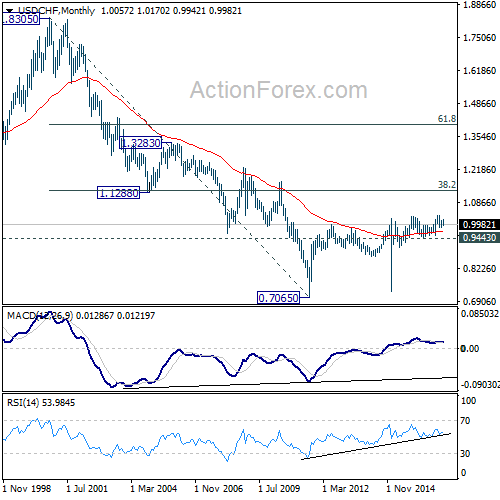
USD/CHF's decline from 1.0169 accelerated lower last week. The development suggests that recovery from 0.9860 has completed at 1.0169. And, whole decline from 1.0342 is likely resuming.
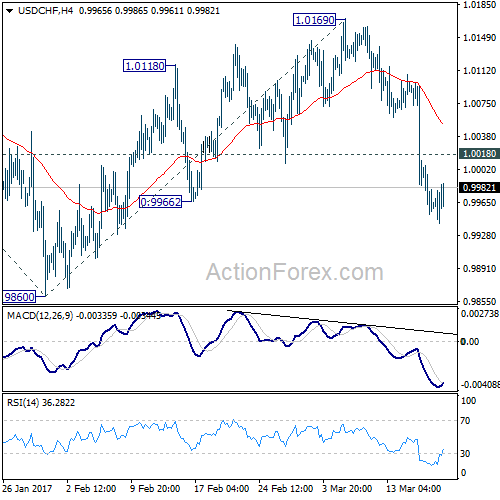
Initial bias in USD/CHF remains on the downside this week for 0.9860 support. Break will extend the fall from 1.0342 and target 100% projection of 1.0342 to 0.9860 from 1.0169 at 0.9687. On the upside, above 1.0018 minor resistance will turn bias neutral. But outlook will now stay bearish as long as 1.0169 resistance holds.
In the bigger picture, USD/CHF is staying in medium term sideway pattern between 0.9443/1.0342. In any case, decisive break of 1.0342 resistance is needed to confirm underlying strength. Otherwise, we'll stay neutral in the pair first. In case of another fall, we'd expect strong support from 0.9443/9548 support zone.
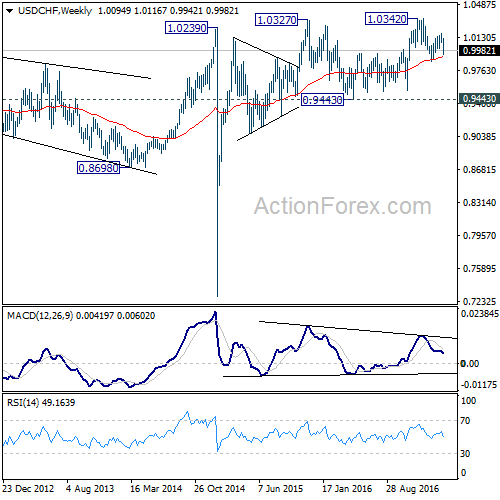
Meanwhile firm break of 1.0342 will target 38.2% retracement of 1.8305 to 0.7065 at 1.1359.
AUD/USD Weekly Outlook
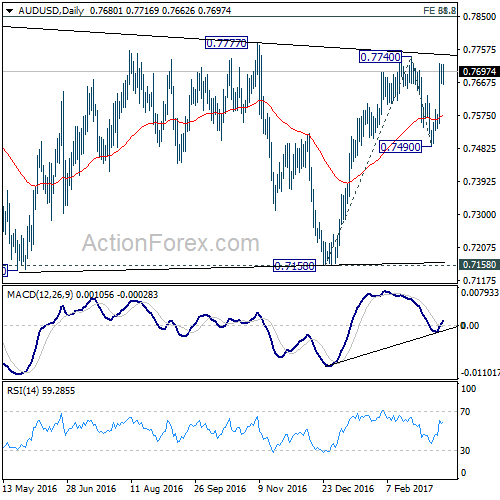
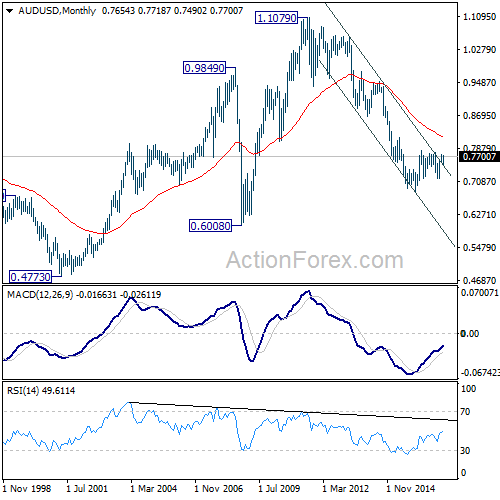
AUD/USD's rebound from 0.7490 accelerated last week and the development suggests that pull back from 0.7740 is completed. Also, rise from 0.7158 is likely resuming. The focus is now back on key fibonacci resistance level at 0.7849.
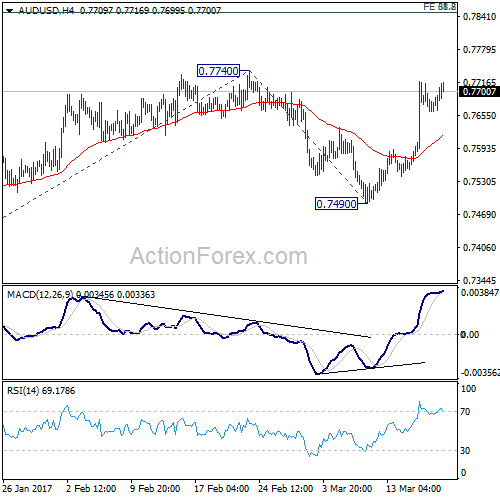
Initial bias in AUD/USD remains on the upside this week for 0.7740 first. Break will resume the rally form 0.7158 and would target 61.8% projection of 0.7158 to 0.7740 from 0.7490 at 0.7850 next. That coincides with key long term retracement level at 0.7849. At this point, we'd expect strong resistance from 0.7849/50 to limit upside and bring reversal. On the downside, break of 0.7490 will turn bias back to the downside for 0.7158 support.
In the bigger picture, we're still treating price actions from 0.6826 low as a correction. And, as long as 38.2% retracement of 0.9504 to 0.6826 at 0.7849 holds, long term down trend from 1.1079 is expected to resume sooner or later. Break of 0.6826 low will target 0.6008 key support level. However, firm break of 0.7849 will indicate that rise from 0.6826 is developing into a medium term rebound, rather than a sideway pattern. In such case, stronger rise should be seek to 55 month EMA (now at 0.8185) and above.
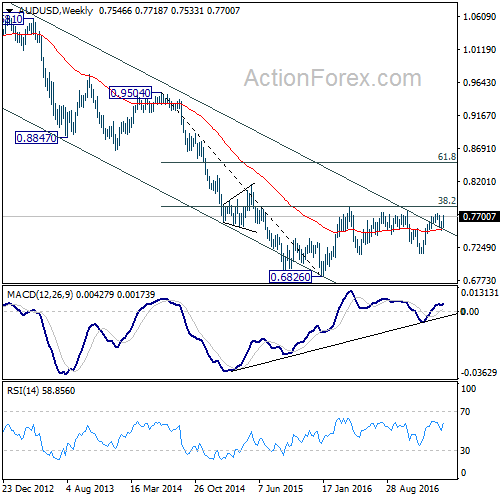
In the longer term picture, while the down trend from 1.1079 might extend lower, we're not anticipating a break of 0.6008 (2008 low) yet. We'll look for bottoming above there to reverse the medium term trend.
USD/CAD Weekly Outlook
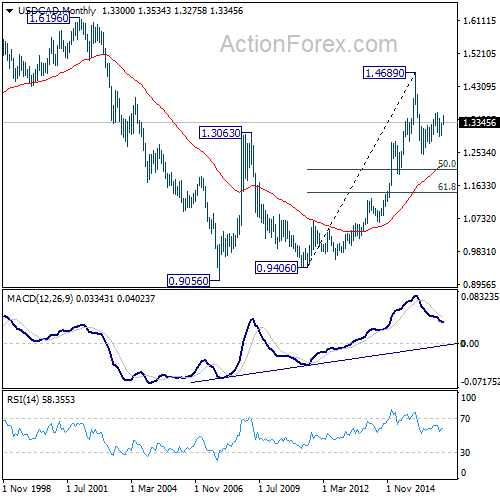
USD/CAD's pull back from 1.3534 extended to as low as 1.3275 last week before forming a temporary low and recovered. The decline was deeper than expected but still it's seen as a correction pattern. Outlook is unchanged that we'd expect another rally through 1.3598 resistance to extend the whole rise from 1.2460.
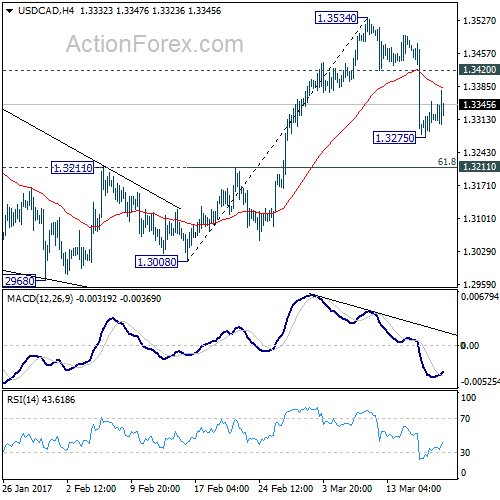
Initial bias is neutral this week first. Below 1.3275 will bring deeper fall. But downside should be contained by 1.3211 cluster level (61.8% retracement of 1.3008 to 1.3534 at 1.3209) to contain downside and bring rebound. On the upside, above 1.3420 minor resistance will indicate that the pull back is completed and turn bias back to the upside for 1.3534 resistance and then 1.3598. However, sustained break of 1.3211 will dampen this view and target 1.2968 key support level next.
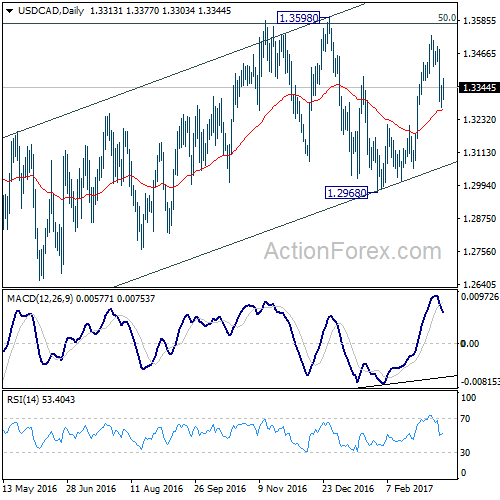
In the bigger picture, price actions from 1.4689 medium term top are seen as a correction pattern. The first leg has completed at 1.2460. The second leg is likely still in progress and could target 61.8% retracement of 1.4689 to 1.2460 at 1.3838. We'd look for reversal signal there to start the third leg. Break of 1.2968 wold at least bring at retest of 1.2460 low. However, sustained trading above 1.3838 would pave the way to retest 1.4689 high.
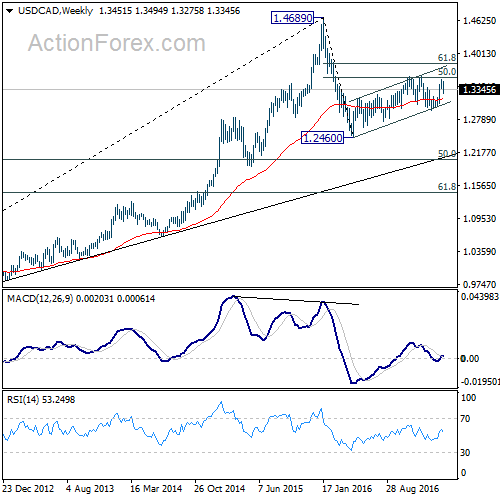
In the longer term picture, rise from 0.9056 (2007 low) is viewed as a long term up trend. It's taking a breath after hitting 1.4689. But such rise expected to resume later to test 1.6196 down the road.
GBP/JPY Weekly Outlook
GBP/JPY had another attempt on 138.53 support last week but recovered from there again. Overall outlook is unchanged that price actions from 148.42 are forming a consolidation pattern. And there is no clear sign of completion yet.
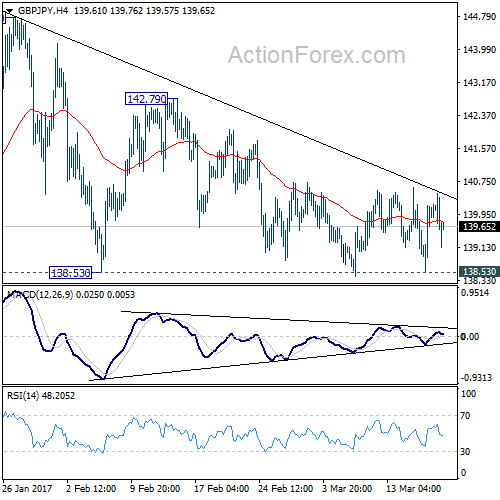
Initial bias in GBP/JPY remains neutral this week first. On the downside, break of 138.53 support would trigger downside acceleration to 136.44 support and possibly below. We'd expect strong support from 50% retracement of 122.36 to 148.42 at 135.39 to contain downside and bring rebound. On the upside, break of 142.79 resistance will turn bias to the upside and send GBP/JPY through 144.77 resistance.
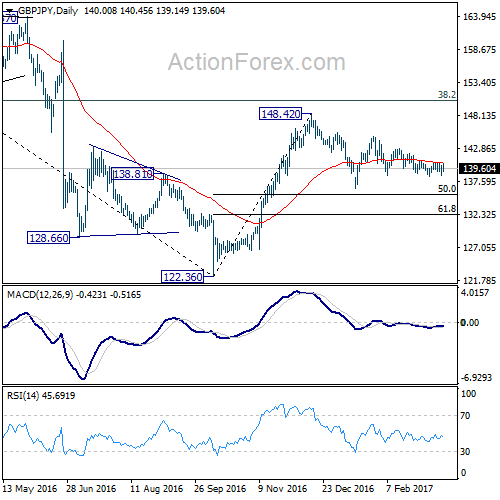
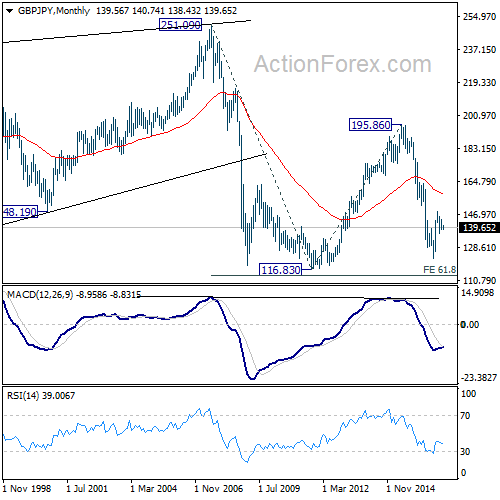
In the bigger picture, price actions from 122.36 medium term bottom are still seen as a corrective pattern. Main focus is on 38.2% retracement of 195.86 to 122.36 at 150.42. Rejection from there will turn the cross into medium term sideway pattern. Or, sustained break of 50% retracement of 122.36 to 148.42 at 135.39 will turn outlook bearish for a test on 122.36 low. Though, sustained break of 150.42 will extend the rebound towards 61.8% retracement of 195.86 to 122.36 at 167.78.
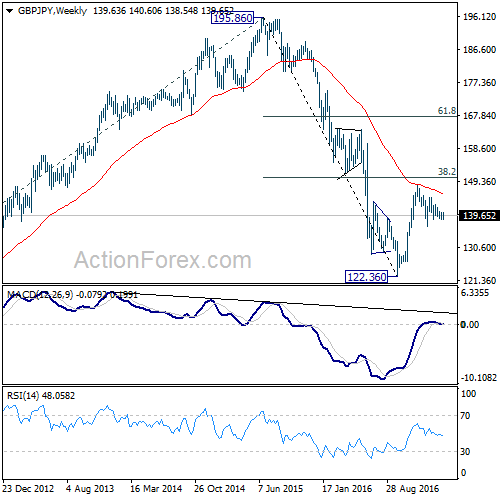
In the longer term picture, while price actions from 122.36 would develop into a medium term correction, fall from 195.86 is still seen as resuming the down trend from 251.09 (2007 high). Hence, after the correction from 122.36 completes we'd expect another fall through 116.83 low.
EUR/JPY Weekly Outlook
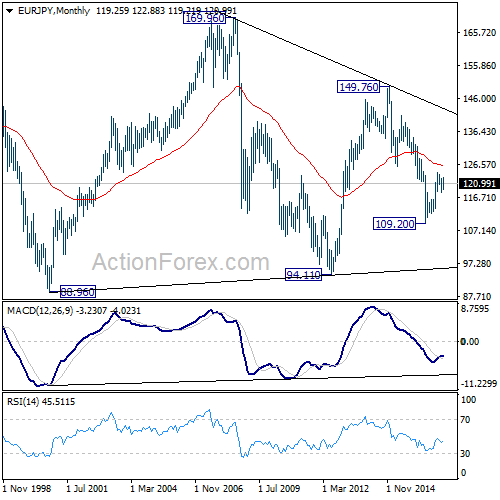
EUR/JPY edged higher to 122.88 last week but reversed since then. The break of 121.18 support dampened the immediately bullish view. It argues that rebound from 118.23 is completed and the consolidation pattern from 124.08 is extending with another falling leg.
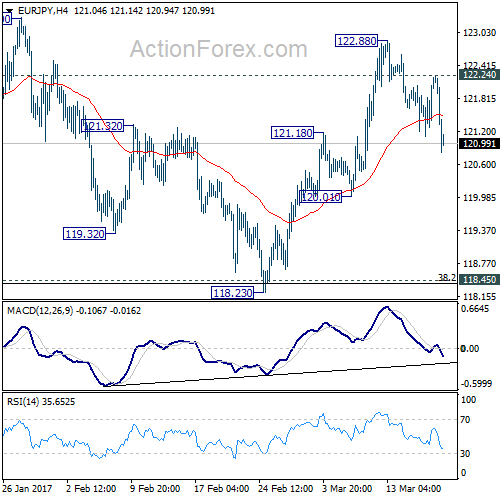
Initial bias is now mildly on the downside this week for 120.01 support. Break will target 118.45 key cluster support level again (38.2% retracement of 109.20 to 124.08 at 118.39). At this point, we'd expect strong support from 118.39/45 to contain downside and bring rebound. On the upside, above 122.24 minor resistance will suggest that fall from 122.88 is merely a pull back. And intraday bias will be turned back to the upside for retesting 124.08 high.
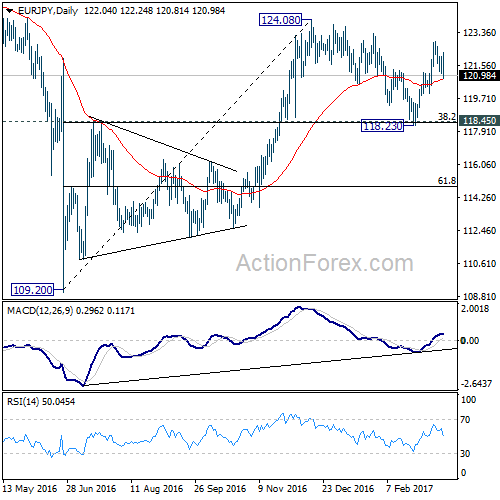
In the bigger picture, we're holding on to the view that medium term rise from 109.20 is still in progress. Focus is on 126.09 key resistance level. Sustained break will confirm completion of the whole decline from 149.76. And rise from 109.20 is of the same degree as the fall from 149.76. In such case, further rally would be seen to 104.04 resistance and possibly above before topping. Meanwhile, rejection from 126.09, or firm break of 118.45 cluster support, will likely extend the fall from 149.76 through 109.20 low.
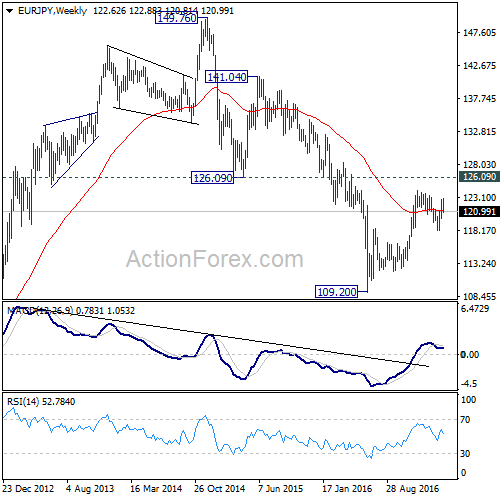
In the long term picture, medium term decline from 149.76 is seen as part of a long term sideway pattern from 88.96. Decisive break of 126.09 will indicate that such decline is completed and EUR/JPY has started another medium term rally already. Before that, deeper fall is mildly in favor towards 94.11 low. Overall,, long term rang trading will continue.
EUR/GBP Weekly Outlook
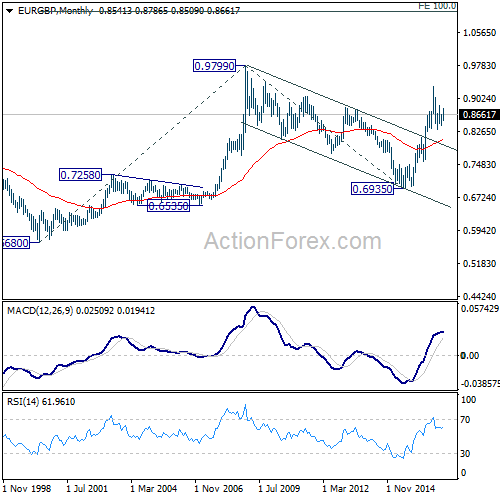
EUR/GBP edged higher to 0.8786 last week but pulled back since then. Downside is contained above 38.2% retracement of 0.8402 to 0.8786 at 0.8639 so far and outlook is unchanged. We're treating rise from 0.8402 as the third leg of the whole pattern from 0.8303. Another rally is still expected in near term.
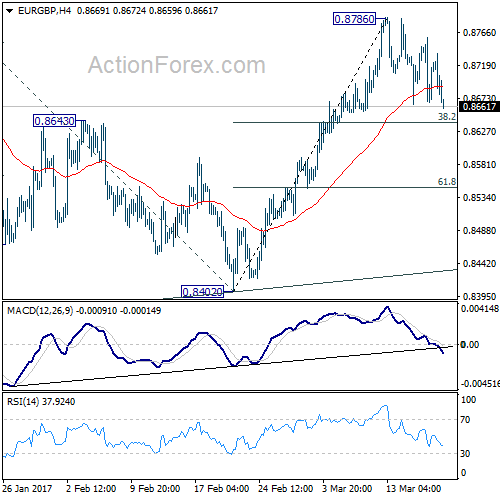
Initial bias remains neutral this week for consolidations below 0.8786. Downside should be contained by 0.8693 and bring another rally. Above 0.8786 will target 0.8851 resistance and above. Though, price actions from 0.8303 are seen as the second leg of the corrective pattern from 0.9304. Hence, we'd expect strong resistance from 100% projection of 0.8303 to 0.8851 from 0.8402 at 0.8950 to limit upside. On the downside, sustained trading below 0.8693 will bring deeper fall to 61.8% retracement 0.8549 and below.
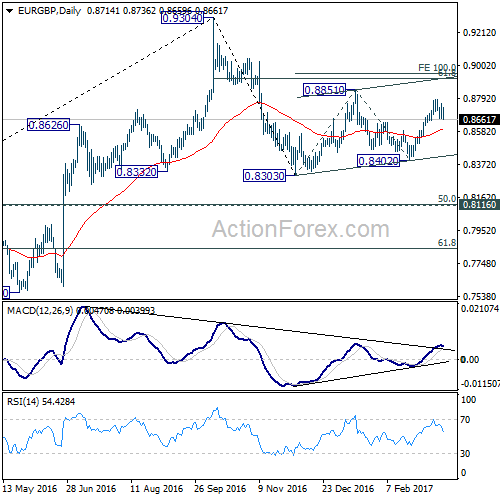
In the bigger picture, price actions from 0.9304 are viewed as a medium term corrective pattern. Deeper fall cannot be ruled out yet. But we'd expect strong support from 0.8116 cluster support (50% retracement of 0.6935 to 0.9304 at 0.8120) to contain downside. Overall, the corrective pattern would take some time to complete before long term up trend resumes at a later stage. Break of 0.9304 will pave the way to 0.9799 (2008 high).
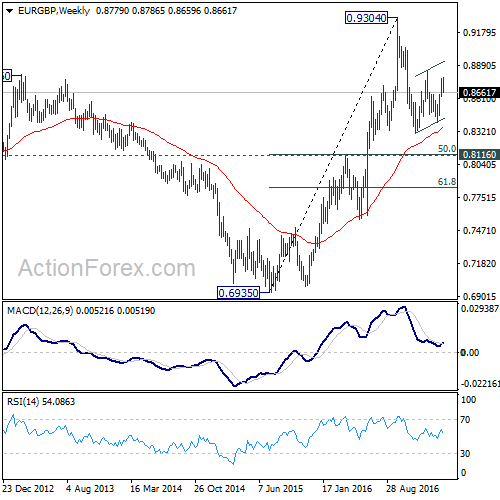
In the long term picture, firstly, price action from 0.9799 is seen as a long term corrective pattern and should have completed at 0.6935. Secondly, rise from 0.6935 is likely resuming up trend from 0.5680 (2000 low). Thirdly, this is supported by the impulsive structure of the rise from 0.6935 to 0.9304. Hence, after the consolidation from 0.9304 completes, we'd expect another medium term up trend to target 0.9799 high and above.