Sample Category Title
European Open Briefing
Global Markets:
- Asian stock markets: Shanghai Composite gained 0.10 %, Hang Seng rose 0.65 %, ASX lost 0.55 %, Nikkei closed for holiday
- Commodities: Gold at $1234 (+0.35 %), Silver at $17.46 (+0.30 %), WTI Oil at $48.95 (-0.75 %), Brent Oil at $51.45 (-0.60 %)
- Rates: US 10-year yield at 2.50, UK 10-year yield at 1.25, German 10-year yield at 0.43
News & Data:
- UK Rightmove House Prices Mar MoM: 1.3% (Prior 2.0%)
- UK Rightmove House Prices Mar YoY: 2.3% (Prior 2.3%)
- PBoC Fixes USDCNY Reference Rate At 6.8998
- ECB's Visco: ECB should shorten break between QE exit and rate hike
- Asia stocks mixed, dollar slips as Fed continues to weigh – RTRS
- Oil prices drop on rise in U.S. drilling – RTRS
- Dollar on defensive for packed week of Fed speakers – RTRS
CFTC Positioning Data:
- EUR short 41K vs 59K short last week. Shorts trimmed by 18K
- GBP short 107K vs 81K short last week. Shorts increased by 26K
- JPY short 71K vs 54K short last week. Shorts increased by 17K
- CHF short 9K vs 10K short last week. Shorts trimmed by 1K
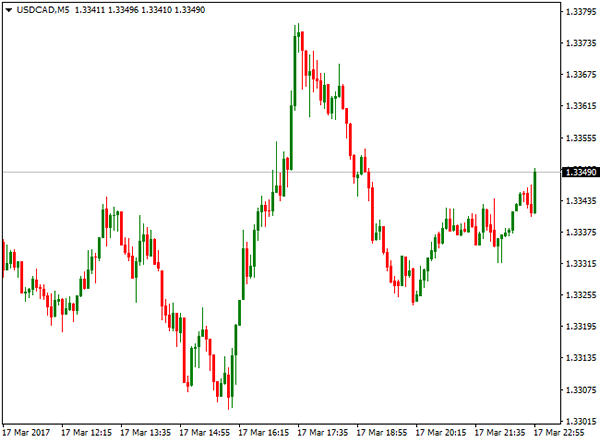
- CAD long 21K vs 29K long. Longs trimmed by 8K
- AUD long 43K vs 51K long. Longs trimmed by 8K
- NZD short 6K vs 4 short last week. Shorts increased by 2K
Markets Update:
Markets were quiet overnight amid a lack of events and a public holiday in Japan.
Most currencies rose against the US Dollar overnight. EUR/USD opened around 1.0735 and rose to a high of 1.0765 later in the session. GBP/USD almost made it to 1.24, but lacked momentum to extend the gain. Meanwhile, USD/JPY remains weak. The pair started around 112.75 at the open and fell to 112.50. A test of 111.50 support seems likely in the near-term.
AUD/USD rose from 0.7685 to 0.7725. Should it break above 0.7740, strong resistance lies at 0.7780. However, should 0.7780 be cleared as well, there is not much resistance left until 0.80. NZD followed the Australian Dollar higher, rising from 0.7010 to 0.7050.
Upcoming Events:
- 07:00 GMT – German PPI
- 12:30 GMT – Canadian Wholesale Sales
- 16:45 GMT – Bundesbank President Weidmann speaks
- 18:20 GMT – BoE Member Haldane speaks
The Week Ahead:
Tuesday, March 21st
- 00:30 GMT – RBA Meeting Minutes
- 09:30 GMT – UK CPI
- 10:00 GMT – BoE Governor Carney speaks
- 10:00 GMT – FOMC Member Dudley speaks
- 12:30 GMT – US Current Account
- 12:30 GMT – Canadian Retail Sales
- 16:00 GMT – FOMC Member George speaks
- 22:00 GMT – FOMC Member Mester speaks
- 23:50 GMT – Japanese Trade Balance
- 23:50 GMT – BoJ Meeting Minutes
Wednesday, March 22nd
- 01:40 GMT – RBA Assistant Governor Debelle speaks
- 09:00 GMT – Euro Zone Current Account
- 13:00 GMT – US House Price Index
- 14:00 GMT – US Existing Home Sales
- 14:30 GMT – US Crude Oil Inventories
- 20:00 GMT – RBNZ Rate Decision
- 20:00 GMT – RBNZ Rate Statement
Thursday, March 23rd
- 07:00 GMT – German Consumer Climate
- 09:00 GMT – ECB Economic Bulletin
- 09:30 GMT – UK Retail Sales
- 12:30 GMT – US Initial Jobless Claims
- 11:00 GMT – Fed Chair Yellen speaks
- 14:00 GMT – US New Home Sales
- 21:45 GMT – New Zealand Trade Balance
Friday, March 24st
- 07:45 GMT – French GDP
- 08:00 GMT – French Manufacturing PMI
- 08:00 GMT – French Services PMI
- 08:30 GMT – German Manufacturing PMI
- 08:30 GMT – German Services PMI
- 09:00 GMT – Euro Zone Manufacturing PMI
- 09:00 GMT – Euro Zone Services PMI
- 12:30 GMT – US Core Durable Goods Orders
- 12:30 GMT – Canadian CPI
- 13:05 GMT – FOMC Member Bullard speaks
- 13:45 GMT – US Manufacturing PMI
- 14:00 GMT – FOMC Member Dudley speaks
Weekly Technical Outlook And Review
A note on lower timeframe confirming price action...
Waiting for lower timeframe confirmation is our main tool to confirm strength within higher timeframe zones, and has really been the key to our trading success. It takes a little time to understand the subtle nuances, however, as each trade is never the same, but once you master the rhythm so to speak, you will be saved from countless unnecessary losing trades. The following is a list of what we look for:
- A break/retest of supply or demand dependent on which way you're trading.
- A trendline break/retest.
- Buying/selling tails ... essentially we look for a cluster of very obvious spikes off of lower timeframe support and resistance levels within the higher timeframe zone.
- Candlestick patterns. We tend to only stick with pin bars and engulfing bars as these have proven to be the most effective.
EUR/USD
Weekly gain/loss: + 68 pips
Weekly closing price: 1.0730
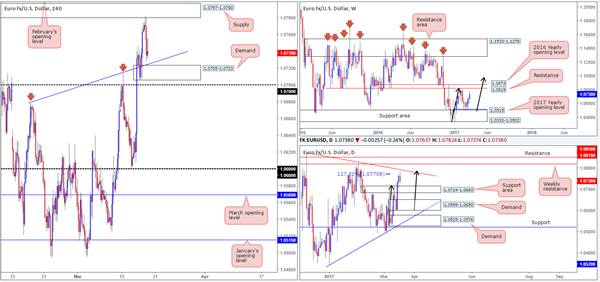
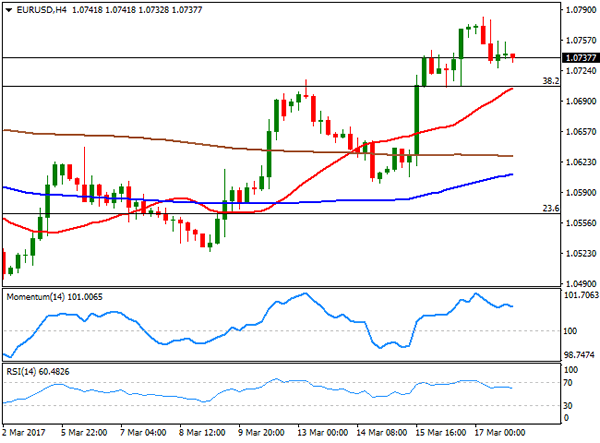
The EUR/USD enjoyed another relatively successful week, increasing its value by a further 70 pips and printing its third consecutive weekly bullish candle into the close. Despite this, there could be trouble ahead. Plotted in our field of vision right now is a nearby weekly resistance level pegged at 1.0819, shadowed closely by the 2016 yearly opening base line drawn from 1.0873. What’s also notable from a technical perspective is the potential weekly AB=CD bearish pattern (see black arrows) that terminates above the aforementioned weekly resistances at 1.0980.
Turning our attention to the daily candles, nevertheless, we can see that price came into contact with a bearish daily AB=CD (black arrows) 127.2% Fib ext. at 1.0770 on Friday. Leaving the daily trend resistance extended from the high 1.0873 unchallenged, price sold off and erased the majority of Thursday’s gains. As you can probably see though, there’s not much room left for the bears to stretch their legs here owing to the daily support area positioned just below at 1.0714-1.0683.
A quick recap of Friday’s sessions on the H4 chart shows that price hit the brakes and reversed from the H4 supply zone marked at 1.0797-1.0780. The US prelim UoM consumer sentiment survey, a notable market-moving event, was largely ignored. This, as far as we can see, helped the major close the week forming two back-to-back H4 selling wicks just ahead of a H4 demand area at 1.0705-1.0723. Also of particular interest here is the H4 demand is actually located around the top edge of the aforementioned daily support area, which also sits a few pips above the 1.07 handle and happens to merge nicely with a H4 trendline support taken form the high 1.0679.
Our suggestions: Based on the above points, our prime focus today will be on the current H4 demand area. Due to its surrounding confluence, additional support coming in from the daily picture and room seen to advance north on the weekly chart, there’s a healthy chance of a bounce being seen from the H4 base.
Whether or not this zone requires additional price confirmation before entry is obviously down to the individual trader. For us personally, we have decided to wait for a reasonably sized H4 bullish rotation candle to take shape before a long trade is executed for the simple reason that we do not favor getting stopped out on a fakeout down to 1.07!
Data points to consider: German Buba President Weidmann speaks at 4.45pm. FOMC member Evans speaks at 5.10pm and President Trump takes the stage at 11.30pm GMT.
Levels to watch/live orders:
- Buys: 1.0705-1.0723 ([waiting for a reasonably sized H4 bull candle to form is advised before pulling the trigger] stop loss: ideally beyond the confirming candle).
- Sells: Flat (stop loss: N/A).
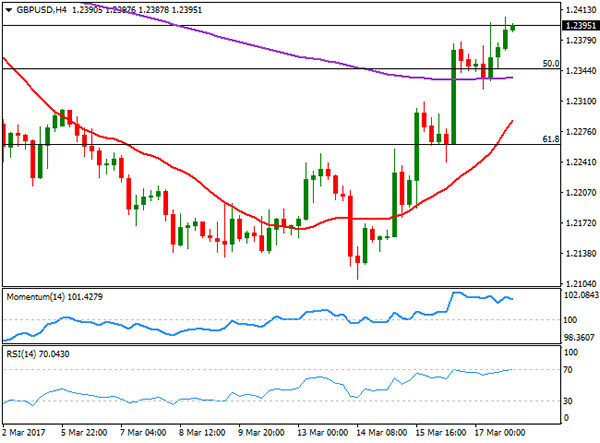
GBP/USD:
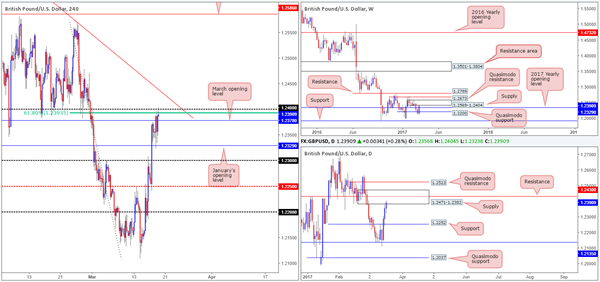
Weekly gain/loss: + 227 pips
Weekly closing price: 1.2390
Following a two-week slide, renewed buying interest came in from a low of 1.2109 last week. Not only did this momentum form a sizeable weekly bullish engulfing candle, it also lifted the pair above the 2017 yearly opening level at 1.2390. While this is considered bullish, it might be worth noting that weekly price also clipped the underside of a weekly supply area at 1.2569-1.2404.
In conjunction with the weekly timeframe, daily action shows that price shook hands with a daily supply zone at 1.2471-1.2382 going into the week’s end. Considering that this barrier holds a daily resistance line penciled in at 1.2430 and is planted within the boundaries of the above said weekly supply, the bulls may find it a challenge to break through here this week.
Swinging across to the H4 timeframe, we can see that cable settled for the week around the 1.24 handle which boasts additional resistance from the H4 61.8% Fib resistance at 1.2393 taken from the high 1.2569. Also noteworthy here is the closing candle: a H4 bearish selling wick. This – coupled with the aforementioned higher-timeframe structures currently in play could be enough to send the unit lower today/this week.
Our suggestions: While our team is firmly bearish this market right now, selling into March’s opening level at 1.2378 is not something we’d feel comfortable with. Should a H4 bearish close print beyond this monthly level, we would then be relatively content on shorting any retest seen to the underside of the 1.24/1.2378 region, targeting January’s opening line at 1.2390, followed closely by the 1.23 handle.
Data points to consider: FOMC member Evans speaks at 5.10pm and President Trump takes the stage at 11.30pm GMT.
Levels to watch/live orders:
- Buys: Flat (stop loss: N/A).
- Sells: Watch for price to engulf 1.2378 and then look to trade any retest seen thereafter (stop loss: ideally beyond 1.24).
AUD/USD
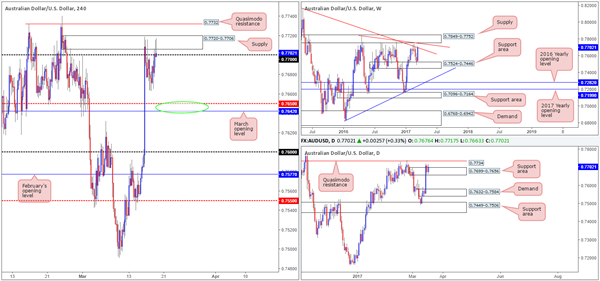
Weekly gain/loss: + 168 pips
Weekly closing price: 0.7702
Recent trading on the weekly chart shows that price aggressively extended the prior week’s (minor) bounce from the weekly support area seen at 0.7524-0.7446. Consequent to this, the weekly candle reconnected with a weekly trendline resistance stretched from the high 0.8163 and closed the week in strong fashion. In the event that this weekly line is violated, the next upside area to have an eyeball on this week can be seen at 0.7849-0.7752: a weekly supply zone that fuses nicely with another, albeit smaller, weekly trendline resistance taken from the high 0.7835.
Over on the daily chart, the daily supply zone at 0.7699-0.7656 was consumed during Wednesday’s advance and is, as you can see, now being used as a support area. Should the bulls continue to defend this neighborhood; traders’ crosshairs will likely be fixed on the daily Quasimodo resistance coming in at 0.7734.
During the course of Friday’s segment on the H4 chart, the commodity-linked currency retested the H4 supply zone visible at 0.7720-0.7706. Although the H4 supply remained defensive, the H4 candles managed to hold above the 0.77 handle into the week’s end. While there’s still a possibility of a bounce being seen from the nearby 0.7642/0.7650 area (green circle – March opening line and H4 mid-way support), we have a keen interest in the H4 Quasimodo resistance seen beyond the current H4 supply at 0.7732.
Our suggestions: 0.7732 converges closely with a daily Quasimodo resistance line at 0.7734, and is also positioned nearby the weekly supply at 0.7849-0.7752 mentioned above. As highlighted in Friday’s report, we would, dependent on the time of day, likely look to enter aggressively here at 0.7732 and place stops above the H4 (Quasimodo apex) high at 0.7740 (0.7742).
Data points to consider: FOMC member Evans speaks at 5.10pm and President Trump takes the stage at 11.30pm GMT.
Levels to watch/live orders:
- Buys: Flat (stop loss: N/A).
- Sells: 0.7732 (Stop loss: 0.7742).
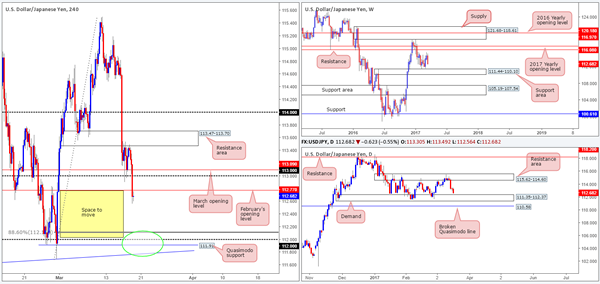
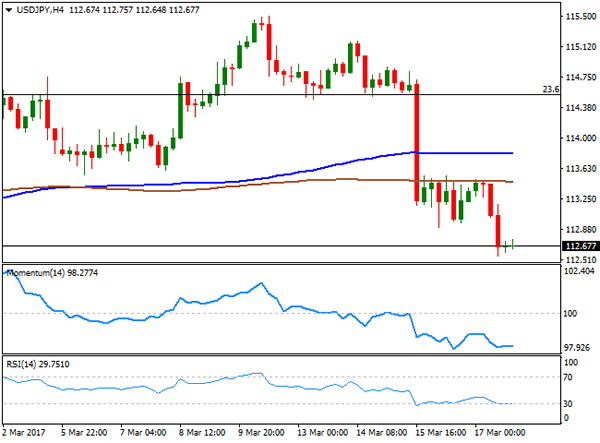
USD/JPY
Weekly gain/loss: – 209 pips
Weekly closing price: 112.68
A healthy bout of selling was seen in the market last week, erasing the prior week’s gains and breaking a two-week bullish phase. Providing that the bears can continue to stamp in their authority here, we see no reason why the weekly support area at 111.44-110.10 will not come into play.
Since mid-January, the daily candles have been consolidating between a daily resistance area coming in at 115.62-114.60 and a daily demand formed at 111.35-112.37 (positioned around the upper edge of the aforementioned weekly support area). A sustained move beyond the top edge of this range could lead to a rally north up to the daily resistance registered at 118.20. Conversely, a push below the lower edge of the daily consolidation may force the unit to challenge the nearby daily broken Quasimodo line at 110.58.
In the early hours of Friday’s London morning segment, the US dollar resumed its decline against the Japanese yen. After chomping through March’s opening base at 113.09, the 113.00 handle and eventually February’s opening line at 112.77, the pair concluded trade forming a H4 indecision candle at 112.68. Despite space being seen for the H4 candles to continue selling off down to around the 112.00 vicinity, we have to remain cognizant of the current daily demand pictured at 111.35-112.37.
Our suggestions: With the top edge of the daily demand coming in at 112.37, shorting from the underside of Feb’s opening line at 112.77 is not impossible, but difficult in regards to space. One has 40 pips of room to play with here. As such, we feel the better route to take today/this week is instead of looking to grab 30 or so pips from a short here, look to wait and see if the H4 candles can test 112 (green circle) for longs. There are a number of technical aspects that support a buy from this angle:
The H4 88.6 retracement value seen at 112.11.
The H4 Quasimodo support at 111.91.
A H4 trendline support taken from the low 111.59.
All of the above is positioned within the current daily demand, which, as we also mentioned above, is located around the top edge of a weekly support area.
Given the above points, a long from 112 is far more appealing to us. Seeing as how the H4 buy zone (111.75/112.11) is rather large, nevertheless, a reasonably sized H4 bullish candle is required to be seen before we pull the trigger.
Data points to consider: FOMC member Evans speaks at 5.10pm and President Trump takes the stage at 11.30pm GMT.
Levels to watch/live orders:
- Buys: 111.75/112.11 ([waiting for a reasonably sized H4 bull candle to form is advised before pulling the trigger] stop loss: ideally beyond the confirming candle).
- Sells: Flat (stop loss: N/A).
Weekly Report: Energy, Commodities, Indices, Forex
ENERGY
WTI Crude oil fell to multi-month low at $47.08 per barrel at the beginning of last week, extending previous week's strong bearish acceleration on very strong rise of US oil inventories and oversupply concerns.
The price managed to recover losses on weaker dollar after Fed and fall in oil stocks this week that eased strong pressure on oil price.
US Crude stocks fell last week as imports plummeted, dropping after nine consecutive increases. Meantime gasoline and distillate inventories declined more than expected. The oil inventories have been closely watched by oil traders, who are looking to determine whether OPEC November's agreement to cut output is reducing global supply excess.
Crude inventories fell by 237,000 barrels in last week, well below expected 3.7 million barrels build and previous week's shocking 8.2 million barrels build that sent oil price to fresh three-month low.
However, oil price recovery is showing initial signs of stall, just under strong psychological / technical resistance at $50.00, which may further delay recovery. On the other side, oil price is attempting to hold above strong technical support at $48.70, which may trigger fresh upside attempts if remains intact.
All these factors will be closely watched next week, as oil price is showing no clear short-term direction, with focus implementation of OPEC production cut agreement and oil inventories.
However, technical studies remain weak and signal persisting downside risk while the price remains under $50.00 barrier.
COMMODITIES
WTI Crude oil fell to multi-month low at $47.08 per barrel at the beginning of last week, extending previous week's strong bearish acceleration on very strong rise of US oil inventories and oversupply concerns.
The price managed to recover losses on weaker dollar after Fed and fall in oil stocks this week that eased strong pressure on oil price.
US Crude stocks fell last week as imports plummeted, dropping after nine consecutive increases. Meantime gasoline and distillate inventories declined more than expected. The oil inventories have been closely watched by oil traders, who are looking to determine whether OPEC November's agreement to cut output is reducing global supply excess.
Crude inventories fell by 237,000 barrels in last week, well below expected 3.7 million barrels build and previous week's shocking 8.2 million barrels build that sent oil price to fresh three-month low.
However, oil price recovery is showing initial signs of stall, just under strong psychological / technical resistance at $50.00, which may further delay recovery. On the other side, oil price is attempting to hold above strong technical support at $48.70, which may trigger fresh upside attempts if remains intact.
All these factors will be closely watched next week, as oil price is showing no clear short-term direction, with focus implementation of OPEC production cut agreement and oil inventories.
However, technical studies remain weak and signal persisting downside risk while the price remains under $50.00 barrier.
INDICES
US Stocks added to gains after raised interest rates. Gains in Financial sectors after rate hike were offset by strong losses in health care sector, after President Trump's budged plan proposed budget cut of $5.8 billion to the National Institutes of Health. This caused strong fall in Healthcare stocks.
Dow Jones contract for June peaked at 21028 but failed to sustain gains and ended week in neutral mode at 20900 zone.
Nasdaq 100 contract for June posted new all-time high at 5439 on rally from weekly low at 5359.
S&P 500 contract for June ended week neutral after ranging between 2357 and 2391 during the week, but remains under fresh record high at 2400, posted on Mar 1.
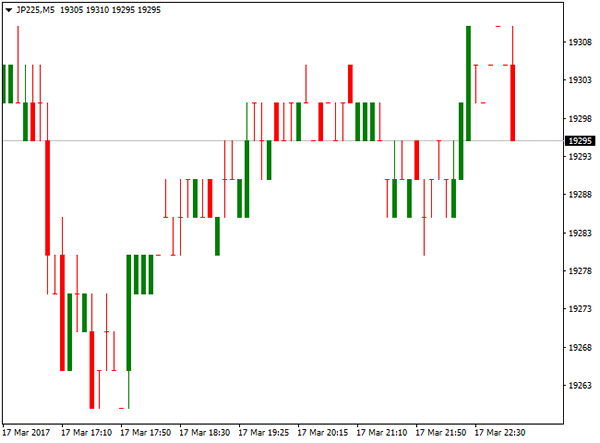
Japan's benchmark Nikkei 225 ended week in red, after recovery attempts stalled at 19570, weekly high and index closed near weekly low at 19260. US Secretary of State Tillerson visited Japan and countries in the region, in attempts to find new approach to deal with threats from North Korea, that also influenced performance of Japan's index.
UK FTSE 100 index ended week positively but closed well below fresh all-time high at 7444, posted earlier this week. The index was up on renewed Brexit fears after UK PM May got approval from UK parliament to start process of negotiations between UK and the EU and received additional boost from initial decision of Bank of England to keep rates unchanged. However, vote of one of MPC members for rate hike, brought positive sentiment among traders and raised hopes that BoE may act earlier than expected and start tightening the policy. This accelerated the rally of British pound and pushed FTSE 100 away from new record high to end week at 7350 zone and leave Friday's gap intact.
Another speculation of earlier than expected interest rate hike from ECB policymaker comments, lifted Eurozone on Friday, sending banking stocks higher. German DAX index peaked at 12177 on Thursday, the highest level since early Jan but was unable to hold gains and eased to 12100 zone, where it ended the week.
FOREX
Foreign exchange market was in focus last week, as four major central banks delivered their monetary policies: US Federal Reserve, Bank of England, Bank of Japan and Swiss National Bank.
All eyes were turned towards Fed, who hiked interest rates by 0.25%, as widely expected, but failed to show more aggressive approach regarding their future steps that defined closely watched FOMC's Statement and press conference of Fed Chair Yellen, as dovish.
This was enough to send the US dollar lower across the board, on traders' disappointment by Fed's tone, expecting central bank to flag plans to accelerate the pace of monetary tightening.
EURUSD surged to 1 ½ month highs at 1.0780 after Fed disappointed traders who jumped out of US dollar. The pair accelerated through strong technical barriers and managed to hold gains and end week positively, extending weekly gains into third consecutive week.
Gains were additionally supported by results of Dutch elections that soothed growing EU breakup fears and comments from ECB's policymaker, who hinted ECB's early rate hike, towards the end of the year.
GBPUSD was hit at the beginning of the week and dipped to eight-week low against the dollar and basket of major currencies, by fears of a prolonged period of political jousting over the terms of Britain's exit from the EU.
British PM Theresa May on Monday won the right to start Brexit process, beginning two-years of talks that will shape the future of Britain and Europe.
Sterling regained ground after Fed's policy decision that send dollar sharply lower and provided relief to its counterparts, including the pound. Additional support for British currency came after Bank of England kept interest rates at 0.25% as expected, but out of nine MPC's policymakers voted for rate hike, which markets understood as signal of early rate hike.
Pound extended rally and ended week at 1.2400 zone, levels last seen at the beginning of March and maintaining strong bullish tone.
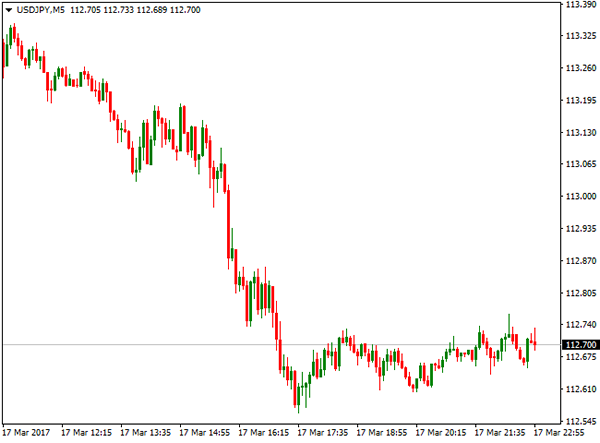
USDJPY fell sharply after dovish Fed, ending week in red on strong bearish acceleration from last week's upside rejection at 115.50 zone. Technical studies signalled reversal on pattern that was formed, with acceleration through key technical supports, confirming growing bearish tone. The pair ended trading on Friday at 112.70, down from week's high at 115.19, maintaining risk of further easing on fresh dollar-negative sentiment after Fed.
Meantime, Bank of Japan kept policy unchanged on Thursday's meeting, with outcome of the meeting having little impact on pair's performance. BoJ Governor Kuroda said that an uptick in inflation towards 1% would not immediately trigger an interest rate hike, signalling that the central bank will stick to its ultra-easy policy for some time.
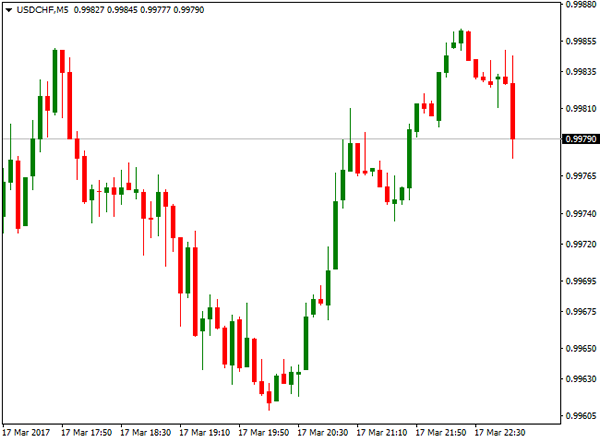
USDCHF ended week strongly in red and under the parity level, as demand for safe-haven Swiss franc grows on political uncertainty. Swiss National Bank stuck to its ultra-loose policy on last week's monetary policy meeting, highlighting global political uncertainty on European elections this. Central Bank also said it is ready to intervene any time to protect their currency which is overvalued.
Foreign Exchange Market Commentary
EUR/USD
The EUR/USD pair retreated on Friday from a fresh 1-month high of 1.0782, but settled well above the 1.0700 threshold, as broad dollar's weakness dominated the FX board, following Fed's monetary policy meeting. The US Central Bank hiked rates as largely anticipated, but retain the stance of a slow pace for upcoming hikes, being far more conservative than expected. At the same time, other major Central Banks' policymakers, hinted the possibility of retrieving their facilities, further fueling dollar's easing. The BOE's meeting showed one MPC member voted to hike rates, whilst ECB's Nowotny said that the Government Council talked about the possibility of rising rates.
Over the weekend, the G-20 meeting ended with world leaders dropping a decade-long pledge to reject protectionism, unable to find common ground with the new US administration, replacing it with a light commitment to work on strengthening "the contribution of trade to our economies." This outcome will likely weigh on the USD, as it indicates Trump's desire for a weaker greenback. The week will likely start in slow motion, as the calendar is quite light in Europe and the US, until Wednesday.
After rallying for three weeks in-a-row, the daily chart for the EUR/USD shows that the pair settled above its 20 and 100 DMAs, both around 1.0610, but still below a 200 DMA, at 1.0856. It also shows that technical indicators have lost upward strength and began retreating from near overbought territory, but are far from suggesting a downward move, whilst the price stands above the 38.2% retracement of the post-US election slide at 1.0710. In the shorter term and according to the 4 hours chart, technical indicators are also retreating from overbought readings, but holding well above their mid-lines and with limited bearish strength, whilst the 20 SMA maintains a strong upward slope, converging with the mentioned Fibonacci support. Overall, the bullish potential eased, but there are no signs the pair has topped, and an extension beyond the mentioned high will likely result in further gains for the pair.
Support levels: 1.0710 1.0660 1.0635
Resistance levels: 1.0755 1.0790 1.0820
USD/JPY
The USD/JPY pair plunged on Friday to settle at 112.68, its lowest in two weeks, as early week dollar's weakness was exacerbated by poor US data. On Friday, the preliminary University of Michigan consumer confidence index rose to 97.6 for March from 96.3 in February, beating consensus, but within the report, the 1-year inflation expectations declined to 2.4% from previous 2.7% while the 5-year inflation expectations figure declined to 2.2% from 2.5%, the lowest reading in the survey’s history, and further fueling the idea that the Fed will take its time to raise rates further. A decline in US-Treasury yields also dented the pair, with the 10-year note shedding around 0.10% weekly basis, to end it at 2.50%. The pair is poised to extend its decline from a technical point of view, given that in the daily chart, it settled below its 100 SMA, now losing upward strength a few pips below 140.50, a major Fibonacci resistance, whilst technical indicators head sharply lower within bearish territory. In the 4 hours chart, the pair accelerated its decline after meeting continued selling interest on attempts to surpass a horizontal 200 SMA at 113.50, whilst technical indicators have moderated their bearish momentum, but consolidate within oversold readings, indicating further slides are likely towards 112.00.
Support levels: 112.50 112.10 111.65
Resistance levels: 113.05 113.50 114.00
GBP/USD
The GBP/USD pair settled at its highest in two-weeks, a couple of pips shy of the 1.2400 figure, as the Pound got a nice boost from the latest BOE's meeting that took place last Thursday. The Central Bank left its economic policy unchanged, but among the MPC there was one dissenter, Christine Forbes, who voted for a rate hike. But what actually fueled the GBP was a sentence included in the statement that reads "some members noted that it would take relatively little further upside news on the prospects of activity or inflation for them to consider that a more immediate reduction in policy support might be warranted." The UK will release multiple inflation figures this Wednesday, including PPI, CPI and Retail Price index, and if the figures beat market's expectations, will likely fuel Pound's rally, as a rate hike in the UK will become more imminent. From a technical point of view, the daily chart shows that technical indicators have entered positive territory, maintaining their bullish slopes and at their highest since late February, whilst the price is well above a now flat 20 SMA, around 1.2290, all of which supports additional gains for the upcoming days. In the 4 hours chart, technical indicators have lost upward strength but hold within overbought territory, whilst the 20 SMA present a sharp bullish slope, also standing in the 1.2290 region. In this last time frame, the price has settled above its 200 EMA for the first time this March, adding to the bullish case. The immediate resistance is now 1.2425, the 38.2% retracement of the January rally, while a critical support comes at 1.2345, the 50% retracement of the same rally and February's low.
Support levels: 1.2345 1.2300 1.2260
Resistance levels: 1.2425 1.2470 1.2510
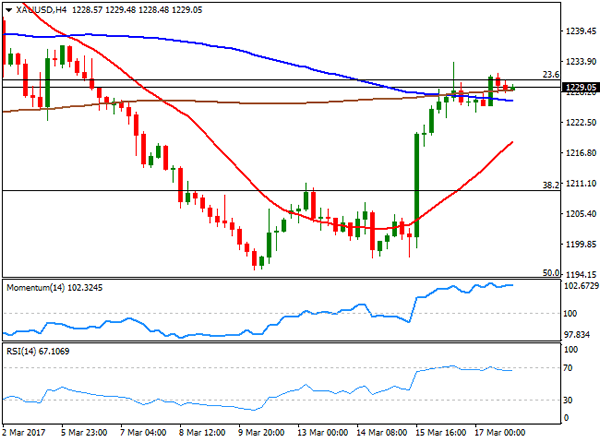
GOLD
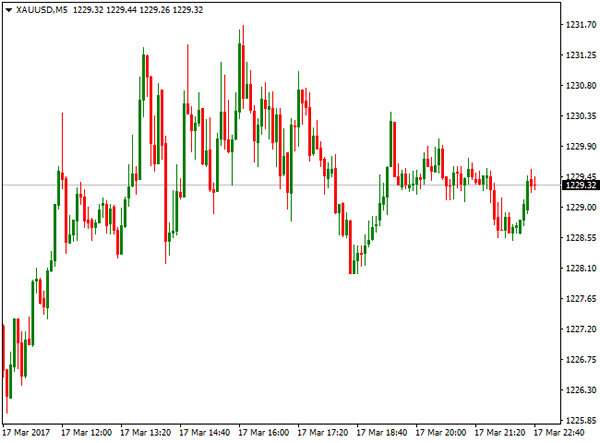
After a 2-week decline, gold prices recovered this past one, with spot settling at $1,229.05 a troy ounce, up 2.4% for the week, underpinned by Fed's decision to maintain its rate-hike pace unchanged, which weakened the greenback against all of its major rivals. The bright metal consolidated on Friday, holding within the upper end of Thursday's range, but unable to breach the weekly high of 1,233.62, somehow indicating fading buying interest. In the daily chart, the commodity closed the day around a horizontal 20 DMA and slightly below a major Fibonacci resistance at 1,230.10, whilst technical indicators have lost upward strength, although the RSI stands at 54, this last limiting the bearish potential. In the 4 hours chart, the 20 SMA maintains a strong bullish slope below the current level, whilst technical indicators hold within overbought territory with no signs of turning lower, in line with the longer term perspective.
Support levels: 1,223.15 1,212,90 1,203.30
Resistance levels: 1,230.10 1,242.50 1,250.65
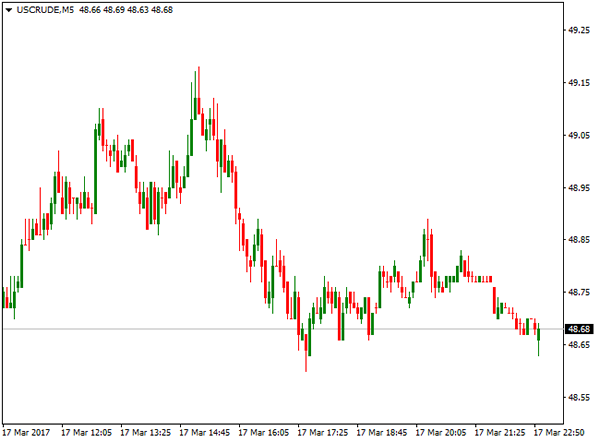
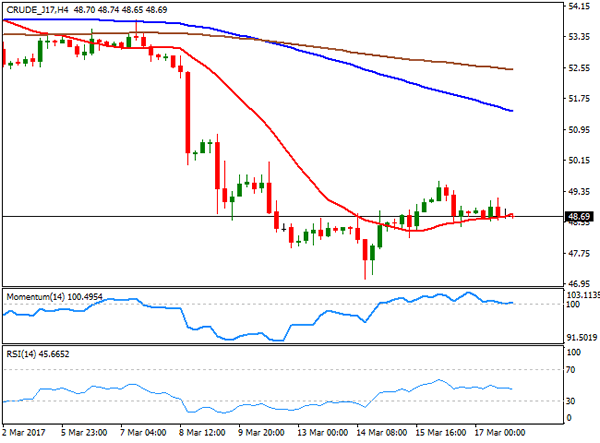
WTI CRUDE
Crude oil prices posted a modest gain this last week after reaching fresh 2017 lows, with West Texas Intermediate futures ending at $48.69 a barrel after trading as low as 47.08. The commodity pared losses after the US weekly EIA report posted a surprise drawdown after 9 straight weeks of advances, although the recovery was contained by continued fears of further gains in US production, after Friday's Baker Hughes report. According to the oilfield company, the number of active US rigs drilling for oil rose by 14 to 631, the ninth consecutive weekly gain and the highest number of active drills since September 2015. The daily chart shows that WTI developed below the 200 DMA all the week, failing to surpass it, whilst the 20 DMA heads sharply lower above the current level, after crossing below the 100 DMA. Furthermore, technical indicators in the mentioned time frame have turned flat within oversold territory after correcting extreme readings, all of which maintains the risk towards the downside. In the 4 hours chart, the price is stuck around a modestly bullish 20 SMA, whilst technical indicators head nowhere within neutral territory. A downward extension below 48.00 will likely result in a deeper slide beyond the mentioned weekly high, and leaving doors open for a test of the 45 threshold.
Support levels: 48.00 47.30 46.65
Resistance levels: 49.10 49.75 50.50
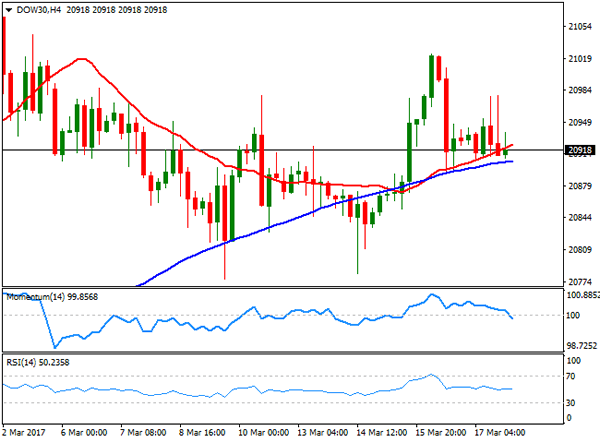
DJIA
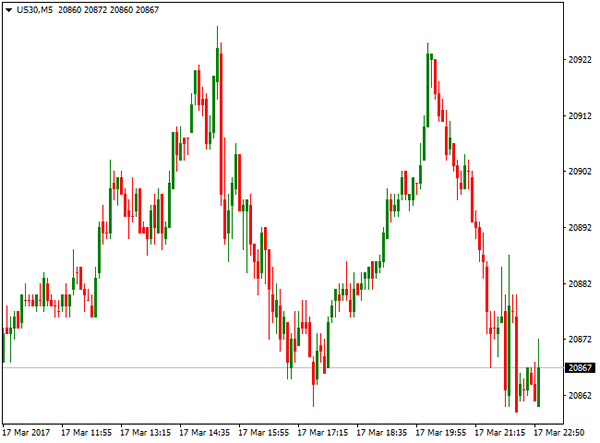
Wall Street closed mixed once again last Friday, with major indexes not far from their daily opening levels. The Dow Jones Industrial Average lost 20 points and settled at 20,914.62, while the S&P shed 3 points, to close at 2,378.25. The Nasdaq Composite closed flat at 5,901.00. The Dow momentum faded as investors struggle to digest monetary and political news, following Fed's decision and Donald Trump's fiscal 2018 budget proposal, which put forth massive cuts throughout the federal government. Financial and health care stocks led the decline, and within the Dow, Goldman Sachs was the worst performer, down by 1.72%, followed by JP Morgan that shed 1.05% and UnitedHealth Group which lost 0.93%. The best performer was 3M that gained 1.08%. Despite closing the week modestly higher, the Dow daily chart presents an increasing bearish potential, as the index is barely holding above a horizontal 20 DMA, while the RSI indicator retreated further from overbought readings and the RSI indicator entered bearish territory with a strong downward slope. In the 4 hours chart, the index is stuck around its 20 and 100 SMAs, both converging in the current 20,910 level, whilst technical indicators pose a modest bearish potential, turning south around their mid-lines.
Support levels: 20,890 20,852 20,817
Resistance levels: 20,925 20,978 21,015
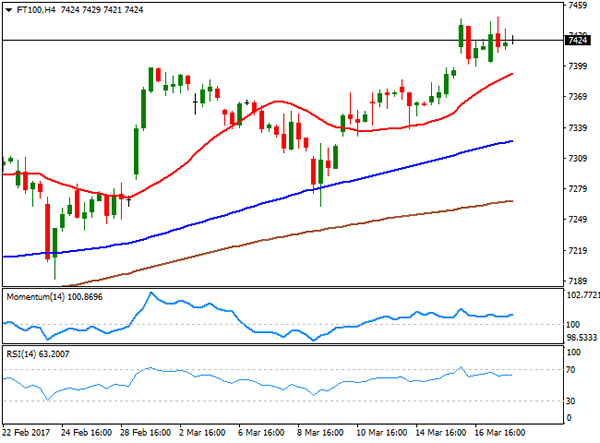
FTSE 100
The FTSE 100 advanced 9 points or 0.12% on Friday, to close the week at 7,424.96, its second consecutive record close and after extending its rally to a new intraday record high of 7,447. The advance was limited by Pound's strength. Insurance firm Admiral was the best performer, adding 1.94%, followed by ConvaTec Group that gained 1.88%. Royal Bank of Scotland was among the best performers, advancing 1.37%, following upbeat comments from Natixis analysts. Mining-related equities were off the radar as metals consolidated on Friday, while Old Mutual was the worst performer, down 2.38%. The index retains its positive tone in the daily chart, as it continued developing well above moving averages, whilst technical indicators remain within positive territory, although with limited upward momentum. In the 4 hours chart, the upside remains constructive, as the 20 SMA maintains a strong bullish slope below the current level, whilst technical indicators have turned north within positive territory, favoring a new leg higher on a break above the mentioned high.
Support levels: 7,399 7,363 7,338
Resistance levels: 7,447 7,480 7,510
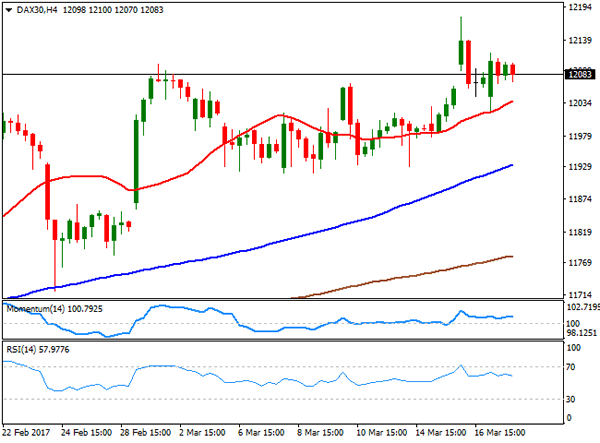
DAX
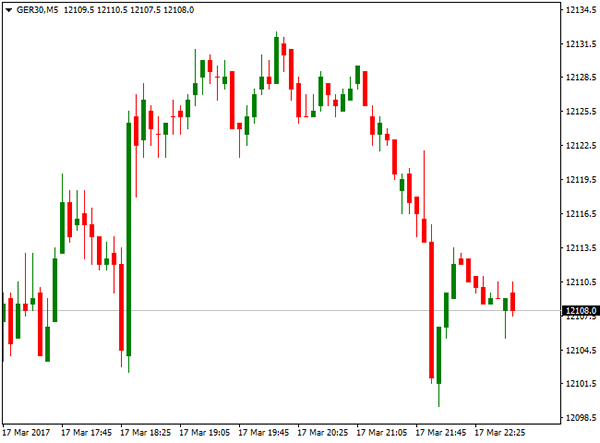
European equities posted modest gains last Friday, with the German DAX ending the week at 12,095.24, up on the day by 12 points, but the week at its highest since April 2015, with sharp losses in automobile stocks offsetting other sectors' gains. E.ON was the best performer within the DAX, closing 4.83% higher, followed by Commerzbank that gained 1.54%. Deutsche Bank was the worst performer, down 2.13%, followed by Volkswagen that shed 1.45%. The daily chart shows that the index held above a bullish 20 DMA, currently at 11,973, but that technical indicators have lost their upward momentum, turning flat within positive territory, indicating easing bullish strength, but not enough to suggest an upcoming downward move. In the 4 hours chart, technical indicators have also turned neutral within positive territory, whilst the index holds above all of its moving averages, with the shortest now providing an immediate dynamic support at 12,037.
Support levels: 12,039 11,977 11,932
Resistance levels: 12,105 12,140 12,178
Market Morning Briefing
STOCKS
Overall the indices are stable just now and could be quiet for the next coupel of sessions without much movement expected.
Dow (20914.62, -0.10%) could remain paused within the 21000-20800 region for maybe another couple of sessions before again bouncing back towards important resistance at 21200.
Dax (12095.24, +0.10%) continues to trade along the upper trend line of a medium term channel. There is potential of a rise towards 12220-12300 levels in the near term before a short dip is possible.
Nikkei (19521.59, -0.35%) has scope of moving towards 19800 on a break above 19600 but while below 19600 it could remain stable in the 19400-19600 region. We could see some consolidation for the next couple of sessions.
Shanghai (3246.69, +0.29%) came off sharply after showing an initial rise above 3250 last week. Immediate support seen near 3225 and while that holds, we could see a rebound towards 3250 and higher in the coming sessions.
Nifty (9160.05, +0.07%) saw an intra-day high of 9218 on Friday before coming off to close at lower levels of 9160. Our upside target remains at 9280 for the near term from where a sharp corrective fall is expected.
COMMODITIES
Gold (1233) has closed at higher levels from a weekly low of 1196. We continue to look for a close above 1240-45 levels in the near term to take fresh long positions. But before that it may spend a few sessions within the 1215-45 region.
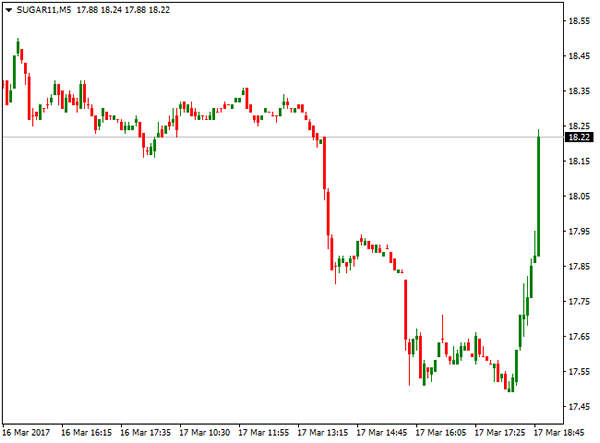
Silver (17.46) has tested immediate resistance at 17.47-48 before closing slightly lower. A break above that could take it up to 18.00. Overall we need to wait for confirmation for immediate directional clarity.
Copper (2.67) was almost unchanged and trading within a narrow range of 2.65-72. We will remain bearish while it is trading below 2.70-72.Only a close above 2.72 could negate our short term bearish view.
Brent (51.45) and WTI (48.41) still shows no strong sign of recovering as both of them had registered the intraday low at 51.36 and 48.26, close to our supports of 50 and 47.50 respectively. We will remain bearish while Brent and WTI are trading below 53 and 50 levels.
FOREX
As all the major events are past now, a quiet week can be expected with Dollar remaining weak as no fresh triggers are visible in the near term.
Dollar Index (100.16) remains weak and may see a gradual decline towards 99.00 over the week with the upside limited to 100.70-101.00.
Euro (1.0760) is wandering about listlessly near the major resistance 1.08, which if holds, may push it down to 1.07-1.06. Only a firm break above 1.08 opens up 1.10 but the probability of that stands at not more than 40% right now. The current net short position of the speculators is the smallest since May’16, which may well turn out to be an indicator for a top formation. Must be kept in mind.
Dollar-Yen (112.55) is getting closer to our target/support of 112.00-111.70 which is expected to hold by the speculators as the net short positions continue to pile up. But a break below 111.70 may open up much lower levels of 110.00 and even 108.50-00.
Pound (1.2382) has almost achieved our initial target of 1.2410 with a high of 1.2405 and now requires a rise above 1.2430-40 to extend the rally to 1.26 levels.
Aussie (0.7718) is testing the major resistance area of 0.7750-0.7850. As discussed last week, this long term resistance area is a very significant make or break zone which, if overcome, may determine the path for the next few months but it remains to be seen if Aussie manages a break above 0.7750-0.7850 immediately or not.
Dollar Rupee (65.45) has tested and currently holding above our target/support of 65.20. Now a sideways consolidation in the range of 65.20-70 can be expected for the next few sessions before any more major move.
INTEREST RATES
The US yields fell sharply in the last 2-sessios but could see some recovery in the near term. The 5yr (2.02%), 10YR (2.50%) and the 30Yr (3.11%) are trading slightly lower from previous levels of 2.04%, 2.54% and 3.15% respectively.
The German-US 2yr (-2.11%) is testing resistance at current levels coinciding with the resistance at 1.08 on Euro. If the resistance levels hold, we could see a fall in both Euro and the yield spread.
The Japan yields are mixed. The 30Yr 90.84%) could test 0.9% before dipping slightly while the 5YR (-0.13%) and the 10Yr (0.08%) could either remain stable or see some fall in the coming sessions towards -0.15% and 0.05% respectively.
Home On The Range
Home on the Range
Are the markets about to deliver some March Madness? For dealers seeking volatility, it has been a challenging start to the year, kicking the can from one news event to the next, growing restless, mired in markets that are at'home on the range'. Real average ranges are squashed like a pancake, and home run trades are a fleeting memory. It's been a challenging start to the year with misdirections the name of the game with dealers doing little more than kicking the can from one news event to the next. Traders are growing incredibly restless mired in markets that are stuck “ home on the range. However, as the Greenback's pressure cookers elastomer bindings look set to yield, we need to remain cognizant that short-term market was carrying significant long dollar (and short Treasury positions) and we see those positions unwind. However, the lack of volatility suggests while the Buck is wavering, it's unlikely to give way anytime soon.
While Friday's APAC session was another muted affair, the gradual grind lower in USD yields was the real story as USDJPY dove below the significant 113 level, just as UST 10's slipped beneath 2.5%, ahead of the weekend's G-20. For now, and likely until the June FOMC, the'build up the divergence' theme has all but run its course. As such, expect shifting portfolio allocations to accelerate as dealers chuck the long dollar view for long Yen, Aussie and Kiwi overweight positions.
While agnostic on the current market view and very on the fence, the randomness of Friday's session indicates that Traders are practising their duck and cover drills while stuck in the lacuna. I think the currency markets are a bit deranged, as dealers continue to maladminister positions, ending up shooting themselves in the foot time and time again. I think there will be a reluctance to chase this USD move lower.
Why do I get a feeling that the plethora of Fed-speak this week will lean against the markets dovish lean? Call it a hunch, but if history suggests anything, betting on Fed flip flops is as predictable an outcome as siding on FOMC forward guidance.
The reasons to be USD bullish are fading, for now, because 1) the Fed is less of a factor, and 2) the expected Trump reform is likely too far in the distance to be of immediate concern, and 3) G20's bark is probably more ferocious that the real bite on a trade. We are likely to see risk continue to shine, but I sense the markets are waiting for the Fed Speak this week to clarify the FOMC statement before overcommitting to any one side.
Australian Dollar
The AUD is holding on to the top side of the ranges, but as we all know, the so-called death valley .7720-60 will be a tough nut to crack. Iron ore is finding support, and with Yellen sounding every so risk friendly, the Aussie continues to be the vehicle of choice for shifting short dollar portfolio flows.
It's hard to refrain from putting up a good argument for the AUD not to test .7800, even if the Greenback holds current levels on the G-3. While some less welcoming remarks on trade from the US occurred at the weekend G-20, the market is viewing the comments as more bark than bite as this stage, despite the possibility of a shifting global trade landscape. After all, much of the recent global growth storyline is written on the back of lowering trade barriers, so one should expect the opposite to hold true in the face of protectionism.
Euro
The Euro lost a bit of its topside momentum as the French election risk is still a key concern for EUR. The first French presidential TV debate is to be held tonight, and I suspect the market will be in wait and see mode.However, the comments from the ECB's Nowotny the day prior, suggesting that the ECB could commence with raising rates before the conclusion of QE continue to resonate and provide support for the EURUSD above 1.0700
Japanese Yen
The break of 112.75 has opened up the door for a move lower, but the market remains bid as current levels are viewed by traders as good medium term levels for dollar bulls. Only a washout below 112 will likely change that tune. Despite the dovish Fed hike, the dollar apple cart has not tipped as of yet. More so, if you're of the view that the Fed considered it premature to take a more hawkish stance before seeing details of the Trump policies, after which the markets expects the Feds to take a more hawkish tone and bolster the USDJPY upside trajectory.
China
China is back on the market radar with the PBOC surprising markets by increasing OMO and MLF rates by 10bps for the second time this year. In addition to tempering financial market leverage and possible asset bubbles, it is clear that the PBOC hike, coming in on the back of the Fed move, is also designed to keep interest rate differentials between the US and China moving in tandem, to kerb capital outflows.
EM Asia
The less hawkish stance by the Fed has opened the door for local EM trade, even more so with the stronger than expected Chinese data last week, adding to the global dollar squeeze. Stability in China will bode well from regional sentiment, which will be supportive of a recovery in commodity prices, along with higher inflation, all of which should pass through to the region.
The MYR is picking up interest on the back of infrastructure investment and as investors view the stability in the commodity space as a positive for the region. Indeed, the prospects of GDP growth on the back of local infrastructure projects bodes well for other commodity related baskets and could produce a much-needed reprieve to local rubber markets.
EUR/JPY Resistance Holds. Shows Power Of Confluence
Ah, the power of confluence!
We were watching this confluence of resistance on EUR/JPY on the blog mid last week and I wanted to bring it back up again:
EUR/JPY Daily:
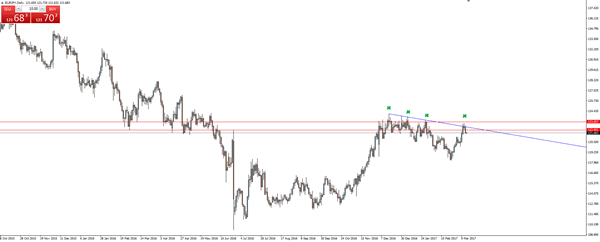
Here you can see the higher time frame confluence of resistance that I'm talking about on the daily chart. Price has not only hit the pretty obvious trend line resistance, but also the horizontal resistance zone.
Both are pretty obvious levels, with the trend line resistance speaking for itself and the horizontal zone formed by a retest of previous swing lows.
Moving to today's start to the week, we can see that the level held:
EUR/JPY Hourly:
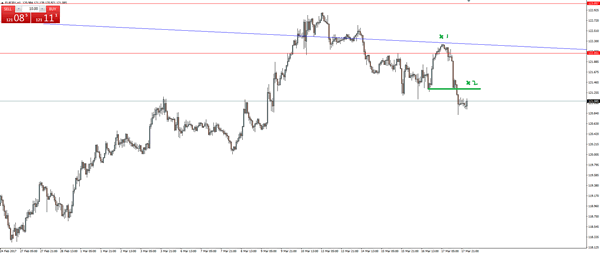
From here, I just wanted to highlight a few things with the 2 markings on the chart.
1. While price pulled back above the little swing high, the higher time frame resistance still held. This shows the importance of trading in the direction of the higher time frame level.
2. Now that the higher time frame level has been reactivated and has held, we look to trade short term pullbacks into previous support turned possible resistance. This is a nice area of interest.
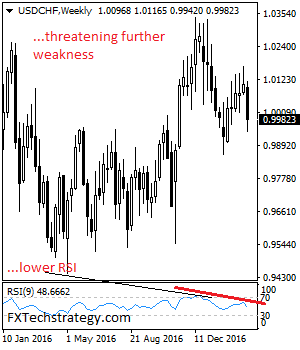
USDCHF – Risk Remains To The Downside On Bear Pressure
USDCHF - The pair weakened the past week leaving risk to the downside into the new week. On the downside, support lies at the 0.9950 level. A turn below here will open the door for more weakness towards the 0.9900 level and then the 0.9850 level. Its daily RSI is bearish and pointing lower suggesting further weakness. On the upside, resistance resides at the 1.0050 level where a break will clear the way for more strength to occur towards the 1.0100 level. Further out, resistance comes in at the 1.0150 level. All in all, USDCHF faces further price weakness.
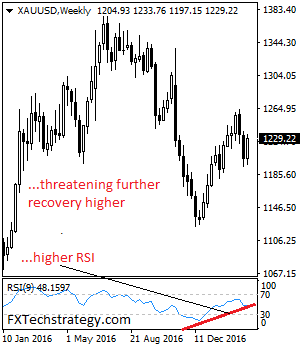
GOLD – Bullish, Risk Points Higher
GOLD - The commodity took back its previous week losses to close higher the past week. On the downside, support comes in at the 1,220.00 level where a break will turn attention to the 1,210.00 level. Further down, a cut through here will open the door for a move lower towards the 1,200.00 level. Below here if seen could trigger further downside pressure targeting the 1,190.00 level. Conversely, resistance resides at the 1,235.00 level where a break will aim at the 1,245.00 level. A turn above there will expose the 1,255.00 level. Further out, resistance stands at the 1,270.00 level. All in all, GOLD looks to strengthen further.
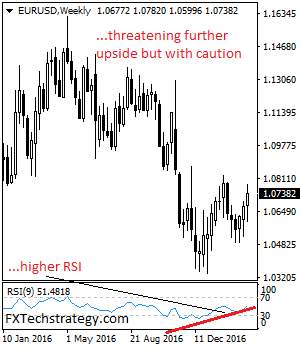
EURUSD: Bullish, Faces Further Recovery Higher
EURUSD: With the pair closing higher the past week, further recovery is envisaged. On the upside, resistance comes in at 1.0800 level with a cut through here opening the door for more upside towards the 1.0850 level. Further up, resistance lies at the 1.0900 level where a break will expose the 1.0950 level. Its weekly RSI bullish and pointing higher suggesting further upside pressure. Conversely, support lies at the 1.0700 level where a violation will aim at the 1.0650 level. A break of here will aim at the 1.0600 level. All in all, EURUSD faces further upside pressure but with caution.