Sample Category Title
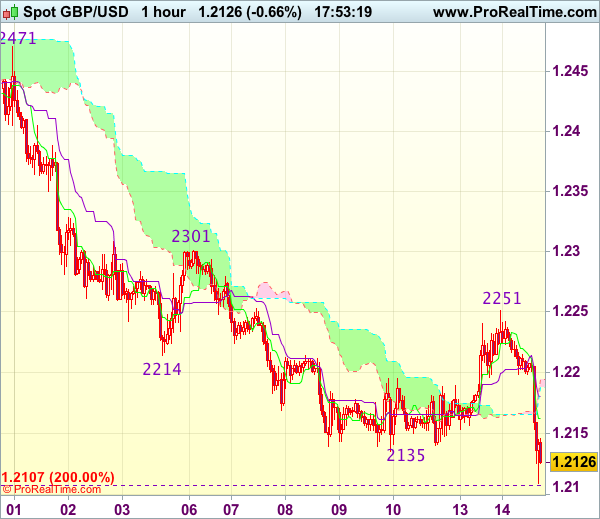
Trade Idea Update: GBP/USD – Stand aside
GBP/USD - 1.2125
New strategy :
Stand aside
Position : -
Target : -
Stop : -
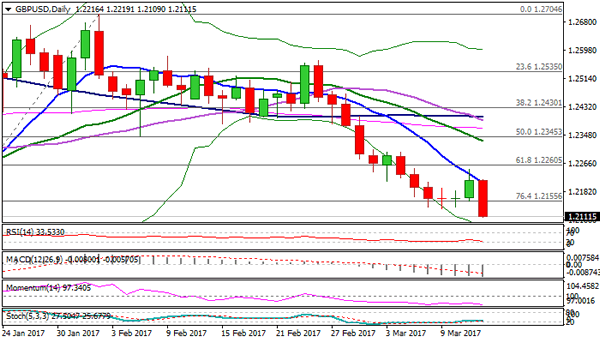
Current selloff dampened our near term bullishness and signals recent decline has resumed, hence downside risk remains for further fall to 1.2100, however, loss of downward momentum should prevent sharp fall below 1.2070 and reckon 1.2040-50 would hold from here, sterling may stage another rebound from there later.
In view of this, would not chase this fall here and would be prudent to stand aside in the meantime. Above the Kijun-Sen (now at 1.2188) would suggest an intra-day low is formed instead, risk rebound to 1.2215 but break there is needed to confirm and bring a stronger rebound towards resistance at 1.2251.
Trade Idea Update: EUR/USD – Hold long entered at 1.0640
EUR/USD - 1.0643
Original strategy :
Bought at 1.0640, Target: 1.0740, Stop: 1.0610
Position : - Long at 1.0640
Target : - 1.0740
Stop : - 1.0610
New strategy :
Hold long entered at 1.0640, Target: 1.0740, Stop: 1.0610
Position : - Long at 1.0640
Target : - 1.0740
Stop : - 1.0610
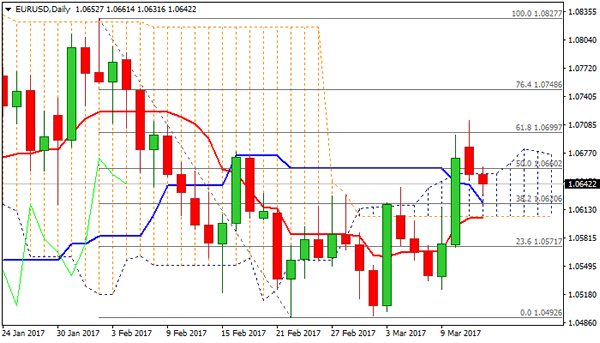
Although the single currency has slipped again today and marginal weakness from here cannot be ruled out, reckon downside would be limited and as long as previous resistance at 1.0615 (now support) holds, mild upside bias remains for another rise, above 1.0680 would suggest the retreat from 1.06714 has ended, bring retest of this level, break there would extend the erratic rise from 1.0493 low to 1.0740-45 (1.5 times projection of 1.0495-1.0640 measuring from 1.0525) but loss of upward momentum should prevent sharp move beyond 1.0760 (1.618 times projection of 1.0495-1.0640 measuring from 1.0525).
In view of this, we are holding on to our long position entered at 1.0640. Below previous resistance at 1.0615 would abort and signal top has been formed, risk further fall to 1.0575-80 first.

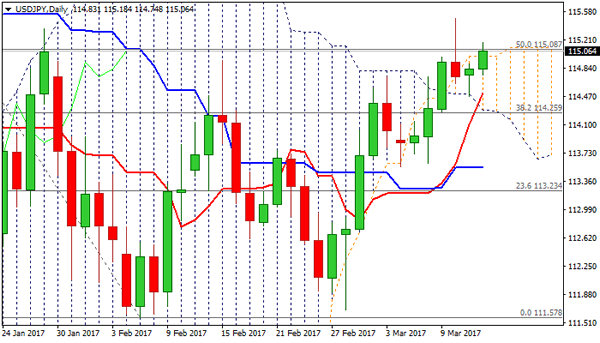
Trade Idea : USD/JPY – Stand aside
USD/JPY - 115.10
New strategy :
Stand aside
Position : -
Target : -
Stop : -
Although the greenback recovered after falling to 114.48 yesterday and minor consolidation is in store, reckon upside would be limited to 115.15-20 and near term downside risk remains for the fall from 115.51 top (last week’s high) to bring at least a retracement of recent upmove to 114.26 support but downside should be limited to 114.00-05 (38.2% Fibonacci retracement of 111.69-115.51) and price should stay well above strong support at 113.56-61), bring rebound later.
In view of this, would be prudent to stand aside for now. A firm break above 115.15-20 would suggest an intra-day low is formed, bring a stronger rebound but still reckon said resistance at 115.51 would cap upside. Only break there would revive bullishness and extend recent upmove to previous resistance at 115.62, then towards 115.90-00.
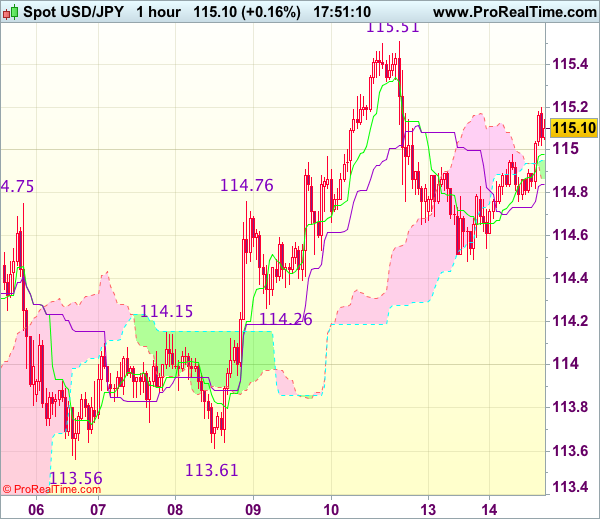
USDJPY Probes Again Above Thickening Daily Cloud
The pair probes again above daily cloud (spanned between 114.29/114.99), on fresh strength from Monday's low at 114.47, where cloud base contained pullback.
Daily cloud is thickening after last week's twist and continues to underpin.
Fresh bulls require close above 114.99/115.08 (cloud top / 50% of 118.59/111.57 downleg) for confirmation.
Regain of last Friday's spike high at 115.49 would open way towards next target at 115.91 (Fibo 61.8% of 118.59/111.57).
First support lies at 114.74 (session low), followed by rising Tenkan-sen (currently at 114.51) and cloud base at 144.29, reinforced by 10/55SMA bull-cross.
Res: 115.18, 115.49, 115.91, 116.33
Sup: 114.74, 114.51, 114.29, 114.00
Cable Falls Sharply After Parliament Backed Brexit Plan, Risk Turns Towards 1.2000 Zone
Cable erased Monday's recovery and probed below last week's fresh multi-week low at 1.2133, on fresh bearish acceleration. Sterling was dragged sharply lower in early Tuesday, on reaction to decision of both houses of British parliament to back Brexit bill and open way for formal start of UK/EU official divorce process. Rising uncertainty helped bears to regain strength, with the pair also being pressured by divergence in UK/US interest rates. After Monday's recovery was capped by falling thick 4-hr Ichimoku cloud, fresh weakness hit new 7-week lows, focus is returning towards yearly low at 1.1986 (also the lowest traded level since 1985. Final daily close below 1.2155 (Fibo 76.4% of 1.1986/1.2704 rally) after four attempts failed, is needed to confirm bearish continuation. Minor supports at 1.2105 and 1.2035 lay en-route to psychological 1.2000 support at 16 Jan low at 1.1986. Falling daily Tenkan-sen that capped today's action, marks strong resistance at 1.2214, followed by base of 4-hr cloud (currently spanned between 1.2231 and 1.2353.
Res: 1.2133, 1.2180, 1.2207, 1.2249
Sup: 1.2105, 1.2050, 1.2035, 1.2000
EURUSD – Return Below 100SMA Weakens Near-Term Structure
The Euro remains at the back foot on Tuesday and probes below strong support at 1.0653 (100 SMA / /daily cloud top), following Monday's rejection above 1.0700 barrier.
Bearish candle with long upper shadow that was left on Monday, weighs on near-term action, as the pair was dragged by weaker British pound.
Fresh weakness also cracked 1.0641 pivot (Fibo 61.8% of 1.0524/1.0713 upleg) that would signal further downside, on clear break.
Near-term studies are weakening, while daily indicators are holding in neutrality zone and positive impact of bullishly aligned daily MA's is fading.
Daily close below 100SMA would be seen as initial bearish signal, while return below daily cloud (cloud base lies at 1.0603 and is reinforced by daily Tenkan-sen) is needed to confirm reversal.
Conversely, return and close above 1.0700 pivot would signal fresh bullish action.
Res: 1.0653, 1.0678, 1.0700, 1.0748
Sup: 1.0631, 1.0620, 1.0603, 1.0570
ECB President Mario Draghi Urges Companies To Invest In Innovation
'Simply by diffusing better the technology we already have in the euro area, we could make sizeable gains in productivity'. - Mario Draghi, ECB
The European Central Bank Mario Draghi did not provide any news in terms of monetary policy during his speech on Monday. Back on Friday, sources close to the ECB, reported that policymakers discussed the possibility of raising interest rates before the end of asset purchases but the discussion was brief and light. However, the Euro managed to rise against other major currencies on rate hike rumours. In his speech, Mario Draghi mainly focused on productivity growth in the Euro zone, which, according to him, slowed markedly over the last several years. Draghi suggested that if the non-high-tech sector adopts more innovative technology that would provide sufficient support to productivity growth in the region, adding that higher productivity growth is important for the European socio-economic model that includes higher wages and a greater degree pf social protection. The ECB President also highlighted the benefits of investment in intangible assets, such as R&D, claiming that companies, which invested in intangibles, reflected greater ability to innovate and adopt technologies. Draghi also urged companies to make greater investment in human capital and management, to improve their productivity. Analysts suggest that the ECB is likely to keep its policy unchanged until the end of its QE programme, or March 2018.
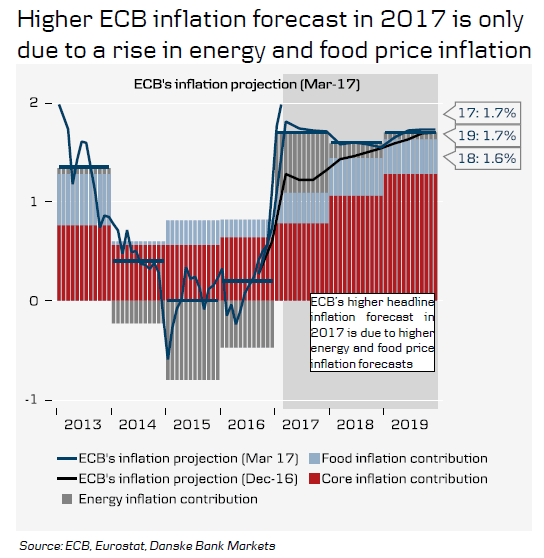
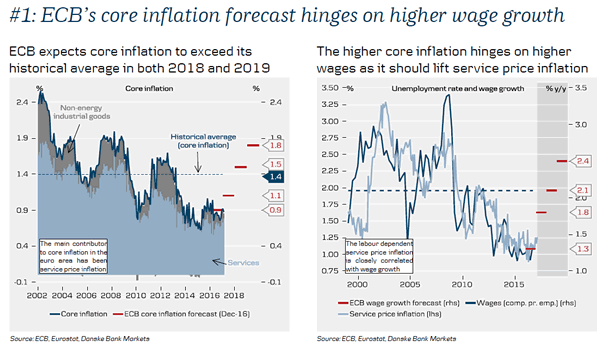
ECB’s Core Inflation Forecast Is Still Too Optimistic
ECB's core inflation forecast still optimistic
The ECB revised its headline inflation projection considerably higher in 2017, lifting it slightly in 2018 while keeping it unchanged in 2019. The higher nearterm inflation forecast reflects higher energy and food price inflation forecasts from the ECB whereas the core inflation projection was unchanged at 1.1%in 2017.
The ECB revised its core inflation forecast slightly higher for 2018 and 2019 by 0.1pp in both years due to ‘some indirect and second-round effects from higher oil prices, as well as some upward effects from the lower euro exchange rate', see March 2017 ECB staff macroeconomic projections for the euro area.
In our view, the ECB's core inflation forecast is still very optimistic due to the following:
- The ECB's core inflation forecast hinges on higher wage growth
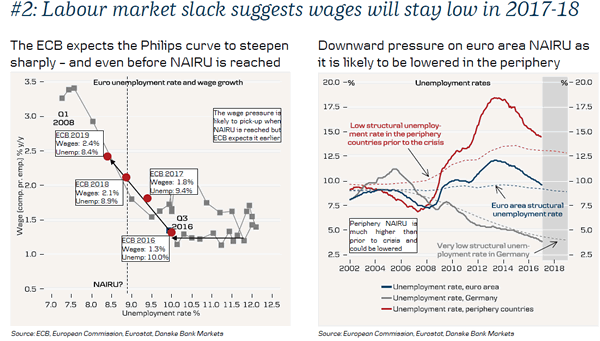
- Labour market slack suggests wages will stay low in 2017-18
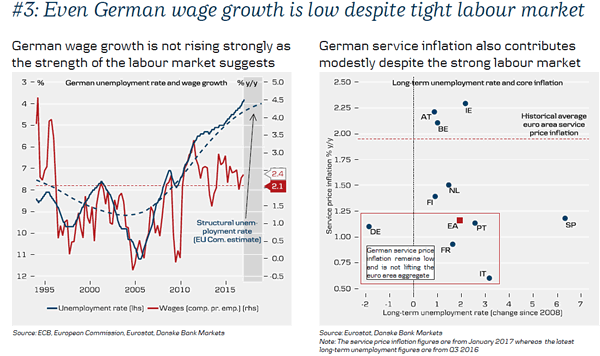
- Even German wage growth is low despite the tight labour market
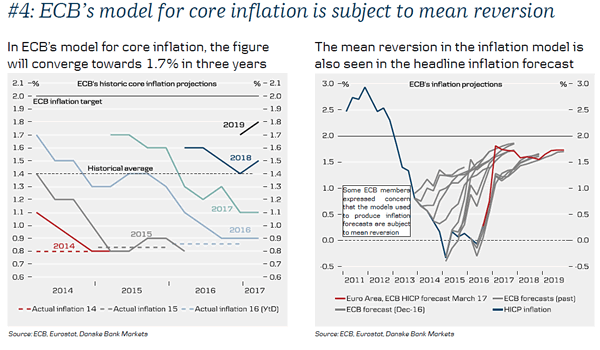
- The ECB's model for core inflation is subject to mean reversion
GBP/USD Elliott Wave Analysis
GBP/USD – 1.2150
GBP/USD – Wave 4 is unfolding as an (A)-(B)-(C) and could have ended at 1.7192
As cable has recovered after falling to 1.2135 last week, suggesting minor consolidation above this level would be seen and corrective bounce to 1.2250-60 cannot be ruled out, however, still reckon resistance at 1.2301 would limit upside and bring another decline later. A break of said support at 1.2135 would extend the fall from 1.2706 to 1.2100, however, as broad outlook remains consolidative, reckon downside would be limited to 1.2040-50 and price should stay above recent low at 1.1986 and bring another rebound later. In the event sterling drops below said recent low, this would signal the major downtrend has finally resumed and extend weakness to 1.1900-10 and then 1.1850 but near term oversold condition should limit downside to 1.1800.
Our preferred count on the daily chart is that cable's rebound from 1.3500 (wave (A) trough) is unfolding as a wave (B) with A ended at 1.7043, followed by triangle wave B and wave C as well as wave (B) has possibly ended at 1.7192, below support at 1.4232 would add credence to this count, then further fall to 1.4000 level would follow but reckon downside would be limited to 1.3655 support and price should stay above previous support at 1.3500.
On the upside, whilst initial recovery to 1.2250-55 cannot be ruled out, reckon upside would be limited to 1.2300-05 and previous support at 1.2347 should turn into resistance and put a lid on cable. A daily close above another previous support at 1.2383 would abort and signal the fall from 1.2706 has ended instead, bring a stronger rebound to 1.2440-50 and possibly towards 1.2500 but price should falter well below resistance at 1.2570, bring further choppy trading later.
Recommendation: Sell at 1.2300 for 1.2100 with stop above 1.2400.
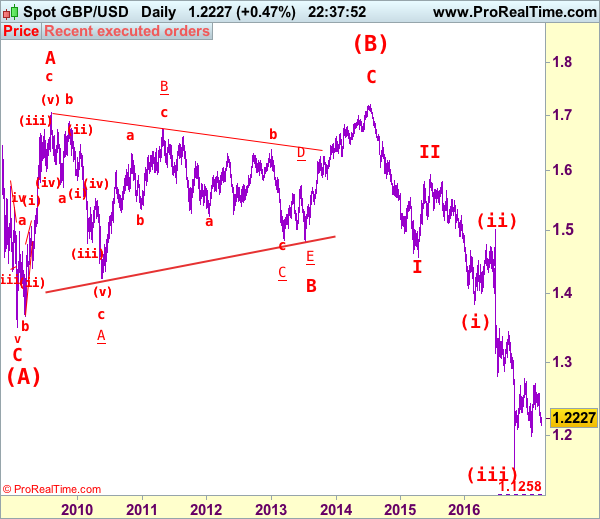
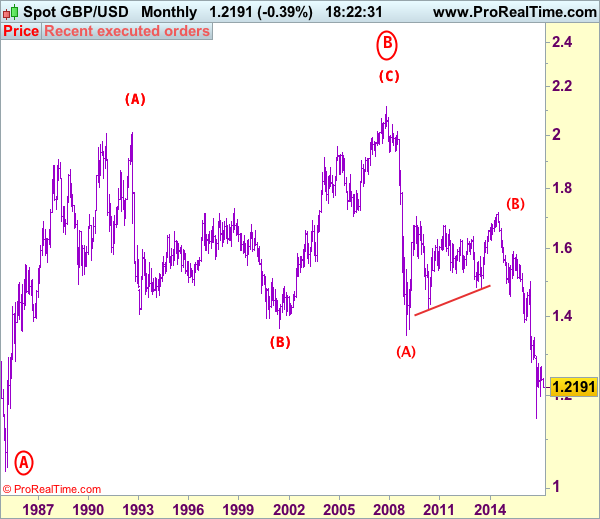
Longer term - Cable's rise from 1.0520 (Feb 1985) to 2.0100 (September 1992) is seen as [A], the decline to 1.3682 is labeled as (B) and (C) wave rally has ended at 2.1162 (9 Nov, 2007) which is also the top of larger degree wave B with circle. The selloff from there is a 5-waver with wave (A) ended at 1.3500 (23 Jan 2009), wave (B) itself is labeled as A: 1.6733, triangle wave B: 1.4813 and wave C as well as top of wave (B) ended at 1.7192 (2014), hence the selloff from there is an impulsive wave (C) with wave I : 1.4566, wave II 1.5930, an extended wave III is unfolding and already exceeded our downside target at 1.3500 and 1.3000, hence weakness to 1.2500 and possibly 1.2000 cannot be ruled out, however, price should stay well above psychological level at 1.0000.
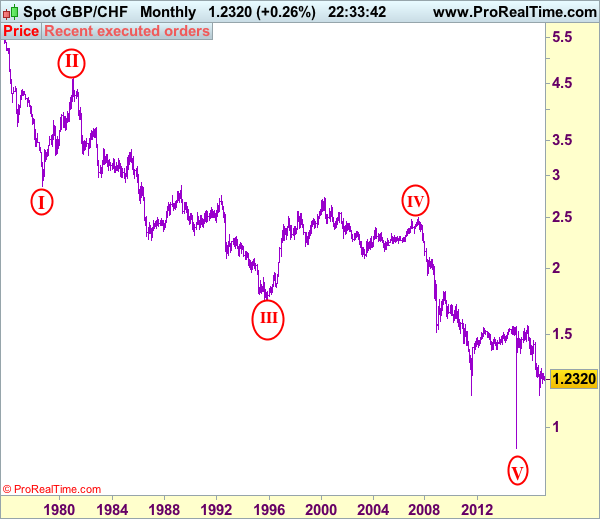
GBP/CHF Elliott Wave Analysis
GBP/CHF – 1.2318
GBP/CHF – Circle wave v ended at 0.9106 and major correction has commenced for subsequent gain to 1.5547.
Sterling finally broke below previous support at 1.2339 and has remained under pressure, suggesting early rebound from1.2102 has ended at 1.2660 last month and consolidation with downside bias is seen for further weakness to 1.2200, however, reckon said support at 1.2102 would hold on first testing. Looking ahead, only a break below this level would extend the fall from 1.2915 to 1.2000-10 and later towards previous support at 1.1962 but reckon key support at 1.1899 would contain downside.
To recap the larger degree count, the selloff from 2.4965 (July 2007) is the beginning of wave V with circle and is labeled as 1: 2.3760, 2: 2.4425, wave 3 extension ended at 1.1470, followed by wave 4 at 1.5547, the quick rebound from 0.9106 suggests wave 5 as well as entire circle wave V could have ended there, hence consolidation with mild upside bias is seen for major correction to take place, bring initial test of 1.5547 (previous 4th of a lesser degree).
On the upside, whilst initial recovery to 1.2400-05 cannot be ruled out, reckon upside would be limited to 1.2450-60 and bring another decline later. Above 1.2500-05 would abort and signal low is formed instead, risk a stronger rebound to 1.2570-75 but break of said resistance at 1.2660 is needed to shift risk back to the upside for the rebound from 1.2102 to extend further gain to 1.2745-55, above there would signal the retreat from 1.2915 has ended at 1.2102 and encourage for subsequent gain to 1.2800-10 first.
Recommendation: Sell at 1.2410 for 1.2210 with stop above 1.2510.
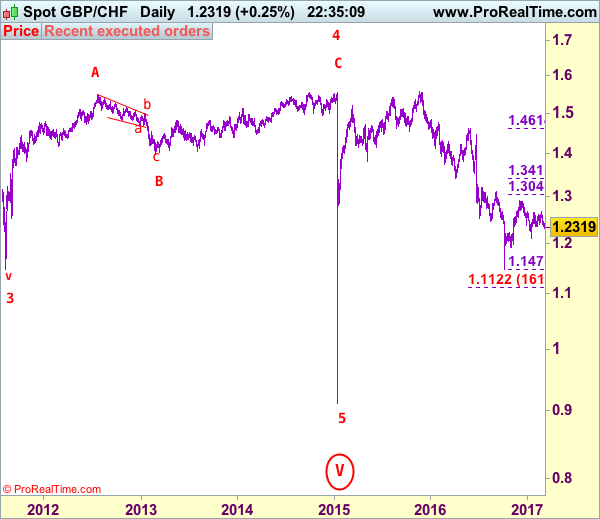
On the Monthly chart, the longer-term count is that major downtrend is under way with circle wave I at 2.8645 (Sep 1.978), then wave II with circle at 4.6175 (Feb 1981), the wave III with circle ended at 1.7425 (Nov 1995) and followed by wave IV with circle at 2.4965 (July 2007 with a short wave C) and wave V with circle has possibly ended at 0.9106. A monthly close above 1.5547 would add credence to this view, bring major correction to 1.7000, then towards psychological level at 2.0000.