
Sample Category Title
EUR/JPY Weekly Outlook
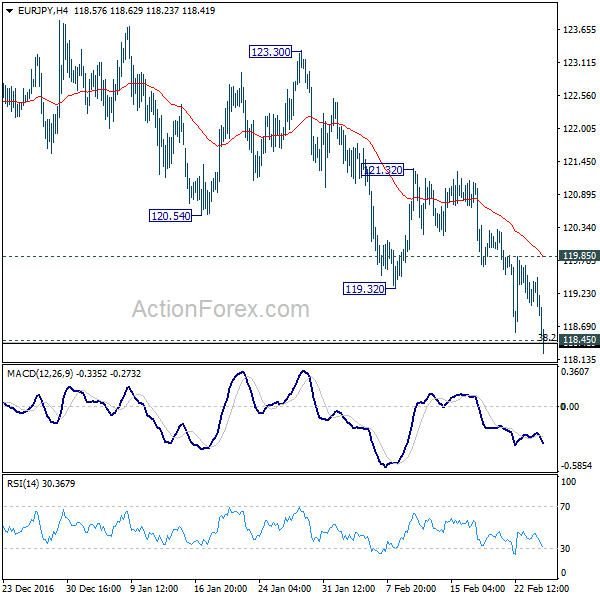
EUR/JPY's decline from 124.08 extended lower last week and breached 118.45 cluster support (38.2% retracement of 109.20 to 124.08 at 118.39). The development argues that whole rebound from 109.20 has completed at 124.08 already. Initial bias is mildly on the downside this week. Deeper fall would be seen to 61.8% retracement at 114.88 and below. On the upside, though, break of 119.85 minor resistance will indicate short term bottoming and turn bias back to the upside for 121.32 resistance instead.
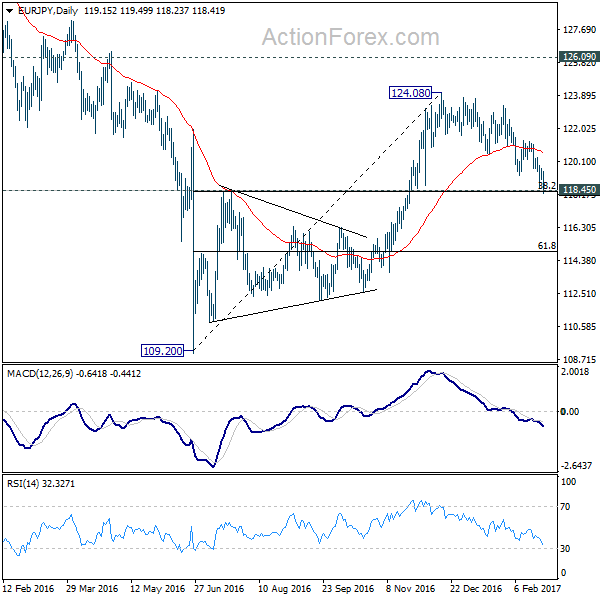
In the bigger picture, price actions from 109.20 medium term bottom are seen as part of a medium term corrective pattern from 149.76. Current development argues that it's completed at 124.08, ahead of 126.09 key resistance level. Deeper fall would be seen back to 109.20 low. Break there will extend the whole medium term down trend from 149.76 high.
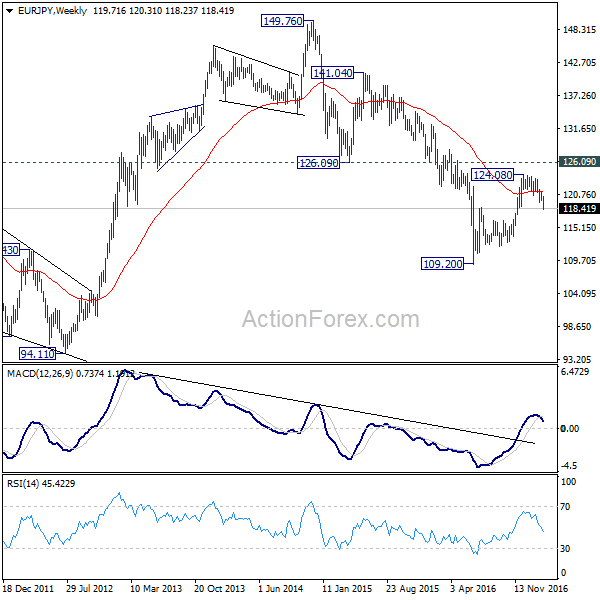
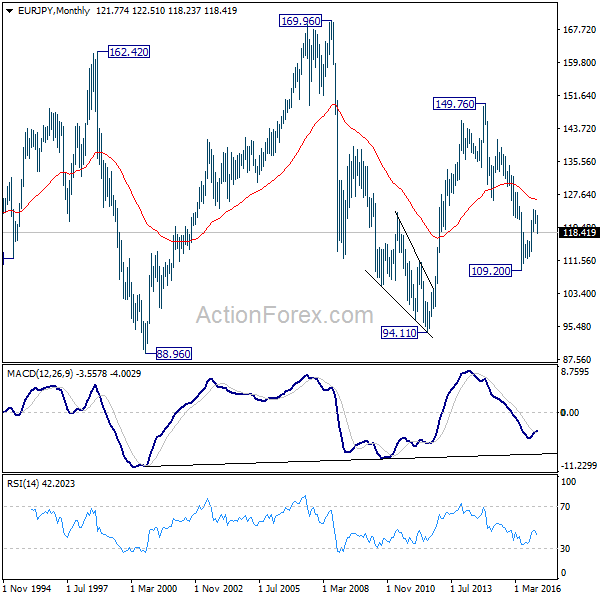
In the long term picture, medium term decline from 149.76 is seen as part of a long term sideway pattern from 88.96. Decisive break of 126.09 will indicate that such decline is completed and EUR/JPY has started another medium term rally already. Before that, deeper fall is mildly in favor towards 94.11 low.
Subscribe to our daily and mid-day newsletter to get this report delivered to your mail box
EUR/GBP Weekly Outlook
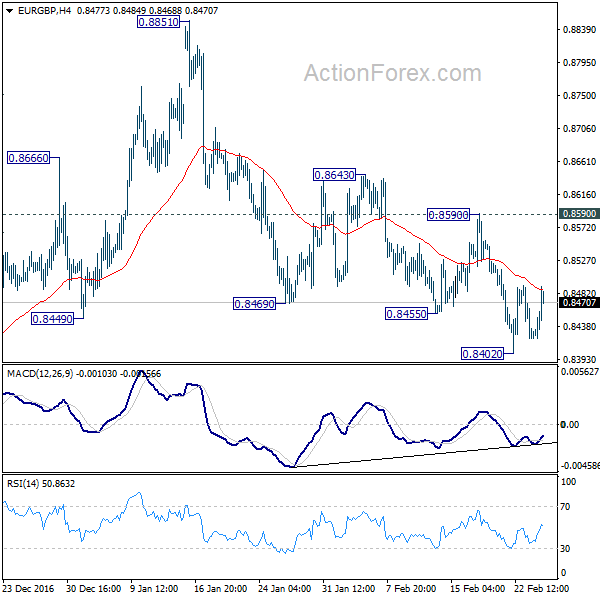
EUR/GBP dipped to 0.8402 last week but recovered. Initial bias stays neutral this week first. Nonetheless, with 0.8590 resistance intact, we're holding on to our bearish view. That is, fall from 0.8851 is the third leg of the whole corrective pattern from 0.9304. Below 0.8402 will turn bias to the downside for 0.8303 first. Break will confirm our bearish view and target 0.8116 key cluster support level. However, on the upside, break of 0.8590 resistance will dampen our view and turn bias back to the upside.
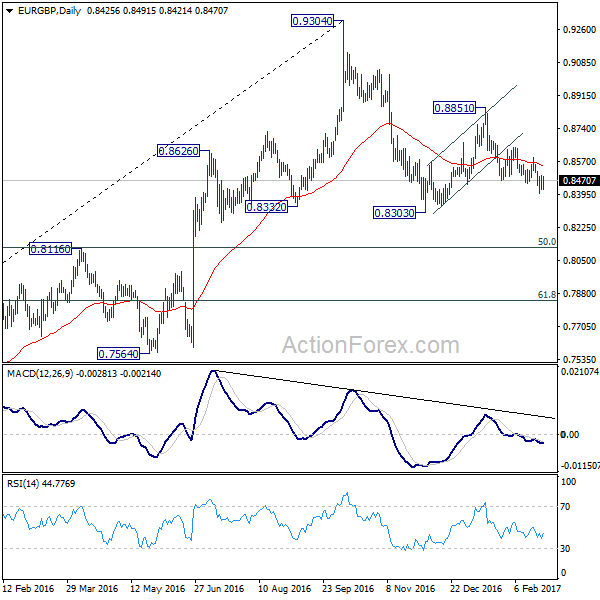
In the bigger picture, price actions from 0.9304 are viewed as a medium term corrective pattern. Deeper fall cannot be ruled out yet. But we'd expect strong support from 0.8116 cluster support (50% retracement of 0.6935 to 0.9304 at 0.8120) to contain downside. Overall, the corrective pattern would take some time to complete before long term up trend resumes at a later stage. Break of 0.9304 will pave the way to 0.9799 (2008 high).
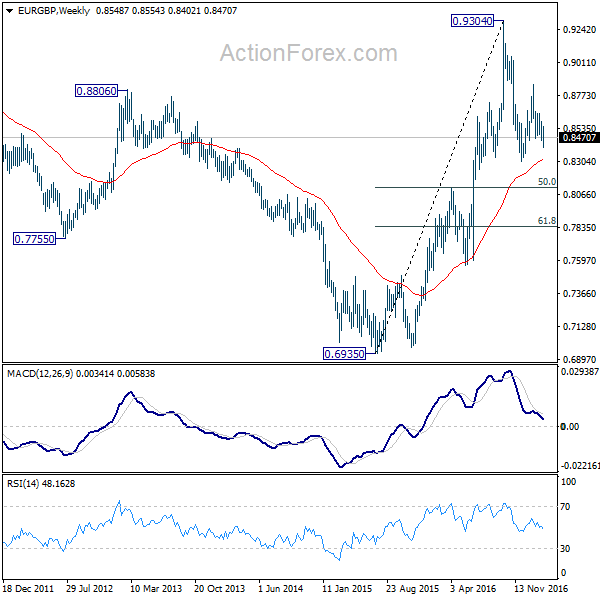
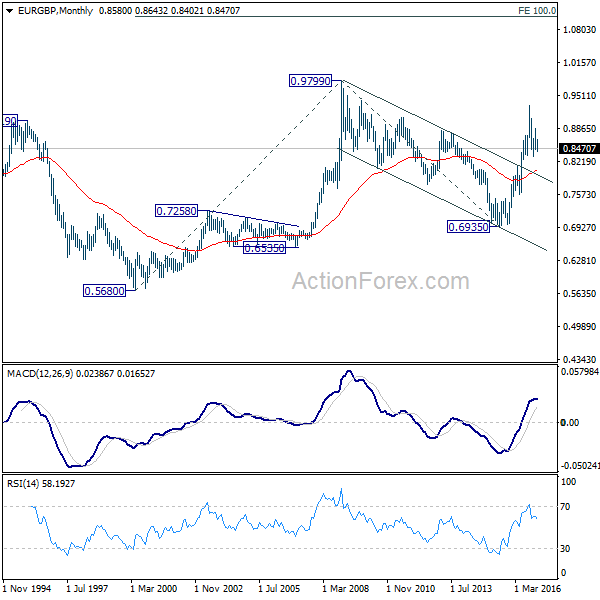
In the long term picture, firstly, price action from 0.9799 is seen as a long term corrective pattern and should have completed at 0.6935. Secondly, rise from 0.6935 is likely resuming up trend from 0.5680 (2000 low). Thirdly, this is supported by the impulsive structure of the rise from 0.6935 to 0.9304. Hence, after the consolidation from 0.9304 completes, we'd expect another medium term up trend to target 0.9799 high and above.
Subscribe to our daily and mid-day newsletter to get this report delivered to your mail box
EUR/AUD Weekly Outlook
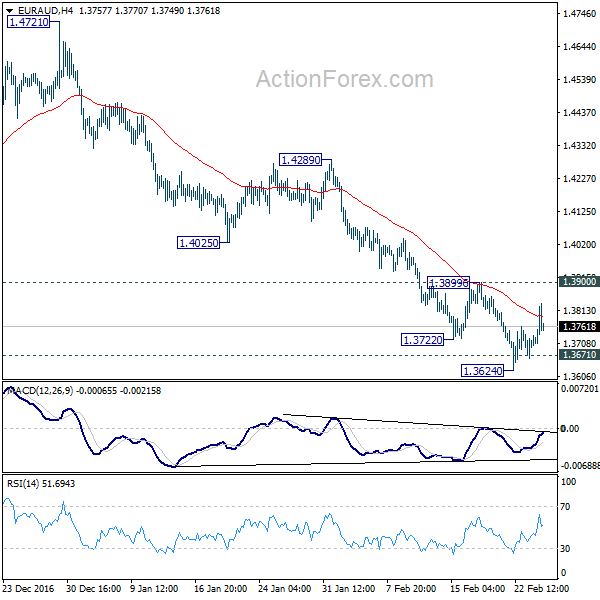
EUR/AUD dipped to 1.3624 last week and breached 1.3671 key support level. But the cross quickly recovered. Initial bias stays neutral this week first. At this point, we'd still expect strong support from 1.3671 to contain downside to complete the correction from 1.6587. This is supported by bullish convergence condition in 4 hour MACD. Break of 1.3900 resistance will confirm short term bottoming and turn bias back to the upside for 1.4289 resistance. However, sustained break of 1.3671 will invalidate our view.
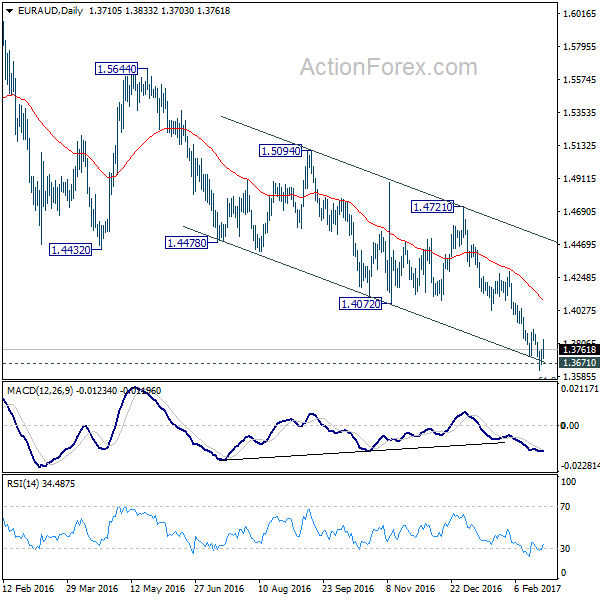
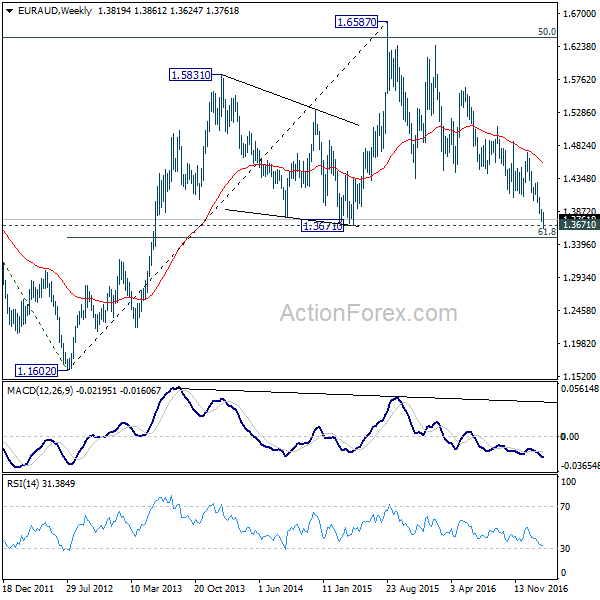
In the bigger picture, price actions from 1.6587 medium term top are viewed as a corrective pattern. We'd expect strong support from 1.3671 key level to contain downside and bring rebound. Up trend from 1.1602 should not be finished and will resume later. Break of 1.4721 resistance will indicate completion of such correction and turn outlook bullish for retesting 1.6587 high. However, sustained break of 1.3671 will invalidate our bullish view and would turn focus back to 1.1602 long term bottom.
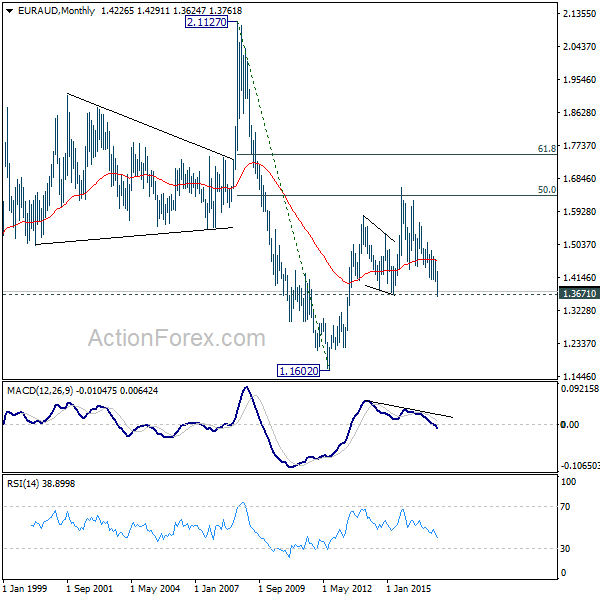
In the longer term picture, the rise from 1.1602 long term bottom isn't over yet. We'll keep monitoring the development but there is prospect of extending the rise to 61.8% retracement of 2.1127 to 1.1602 at 1.7488 and above. However, break of 1.3671 should confirm trend reversal and target 1.1602 long term bottom again.
Subscribe to our daily and mid-day newsletter to get this report delivered to your mail box
EUR/CHF Weekly Outlook
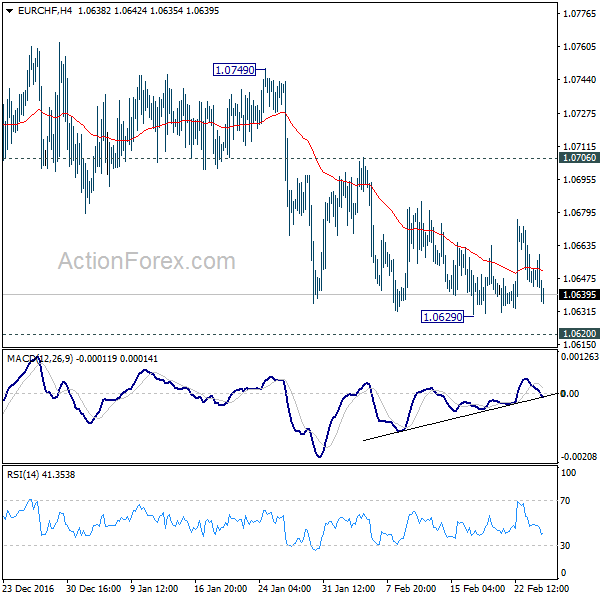
EUR/USD continued to stay in range above 1.0629 last week without any new development. Initial bias remains neutral this week first. As 1.0706 resistance stays intact, deeper decline is still expected in the cross. Firm break of 1.0620 key support level will extend the larger decline from 1.1198 to 1.0485 fibonacci level. However, break of 1.0706 resistance will indicate short term bottoming and turn bias back to the upside. Further break of 1.0749 resistance will raise the chance of medium reversal.
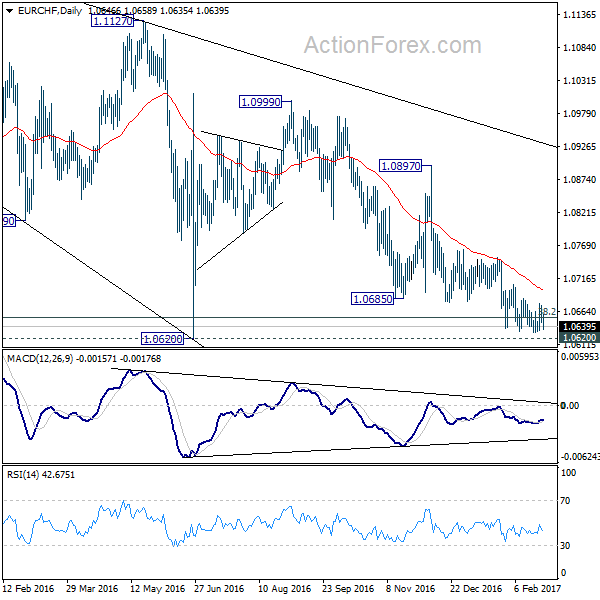
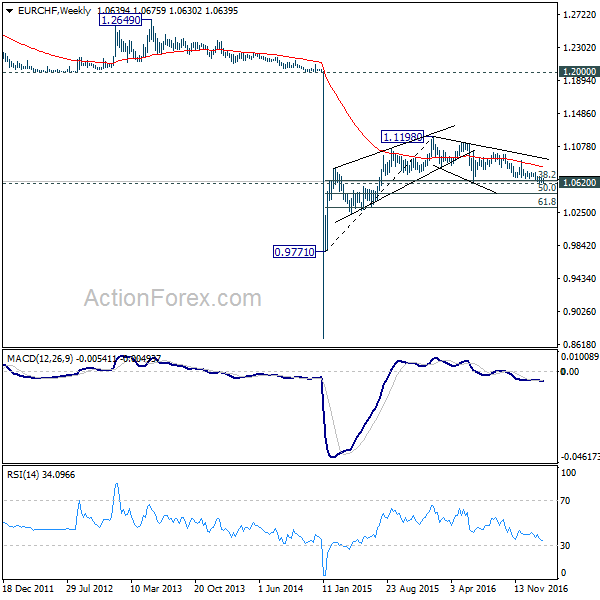
In the bigger picture, the decline from 1.1198 is seen as a corrective move. Such correction is still in progress. Sustained trading below 38.2% retracement of 0.9771 to 1.1198 at 1.0653 will target 50% retracement at 1.0485. On the upside, break of 1.0897 resistance is needed to confirm completion of such fall. Otherwise, outlook will stay bearish.
Subscribe to our daily and mid-day newsletter to get this report delivered to your mail box
Trump’s Address to Congress, BoC Policy Meeting, Key Data in Focus
Next week's market movers
- In the US, all eyes will be on President Trump's address to a joint session of Congress. Markets will be looking for any specifics on tax reform and other policies.
- In Canada, we expect the BoC to take the sidelines amid gradually improving economic data.
- We also get a plethora of key economic data from the US, Australia, the UK, Germany, the Eurozone, Canada, and Japan.
On Monday, in the US, durable goods orders for January are due to be released. The forecast is for the headline rate to have rebounded from previously, while the core figure is expected to have risen for the 5th consecutive month, indicating that despite some softness in civilian aircraft orders, the underlying trend in durable goods continues to be to the upside. The case for solid durable goods orders is supported by the nation's ISM manufacturing PMI for the month, where the new orders sub-index, already at an elevated level, rose for the 5th straight month as well.
On Tuesday, the highlight of the day will be US President Trump's address to a joint session of Congress. Following Trump's recent pledge that he is going to announce a "phenomenal" plan on tax reform within the next weeks, market participants will be on the edge of their seats for any details regarding the new administration's fiscal plans. If he announces proposals that are more or less in line with what he has pledged pre-election, such as reducing corporate tax to 15% - 20%, the USD could gain back some of its lost glamour as the theme of fiscal expansion comes back into play. On the other hand, a percentage markedly higher than the aforementioned could extend the latest slide in the USD triggered by the Fed meeting minutes. Another point of interest for investors, may be any specifics regarding the prospect of a one-time repatriation of corporate cash held abroad at a discounted 10% tax rate, a central theme of the President's campaign. A confirmation of that could help the dollar as well.
As for the US data, we get the 2nd estimate of Q4 GDP. Expectations are for economic growth to have been revised upwards, albeit slightly. This would likely be encouraging news for FOMC policymakers, who in their February policy statement noted that economic activity continued to expand at a moderate pace. Although continued strength in economic data could revive somewhat market expectations with regards to a March hike, we will stick to our guns that something like that is very unlikely.
On Wednesday, the highlight of the day will the Bank of Canada rate decision. At its latest gathering, the BoC maintained a neutral bias with regards to policy in the meeting statement. However, Governor Poloz was quick to backpedal on that stance in the press conference following the decision. He said that another rate cut remains on the table should downside risks materialize, leading investors to price in a higher probability for further easing. Since that meeting, economic data and developments have been encouraging, on balance. The labor market tightened notably in January and GDP growth rebounded in November, on a monthly basis. What's more, oil prices have remained elevated in the aftermath of the OPEC consensus, while inflation data for February came in on a solid footing. The headline rate surged to 2.1% yoy from 1.5% yoy, while the core rate rose to 1.7% yoy from 1.6% yoy. Perhaps something worrisome for the Bank is that its signals for further easing did not manage to materially weaken the CAD, which has remained strong against most of its major counterparts. Bear in mind that when they last met, BoC officials expressed their discontent about the appreciation of the currency following the US election. Taking all these into account, we expect the Bank to remain sidelined. In such a case, market focus will quickly turn to the statement accompanying the decision, as there is no press conference. Given the progress in economic data, we expect the tone of the statement to remain neutral. However, there is the possibility for another warning about the strength of CAD, considering that the currency has traded sideways against most of its major peers since then.
In Australia, GDP data for Q4 are due to be released, though no forecast is available. Following the unexpected tumble in Q3, we see the case for a rebound in Q4, a view shared by the latest RBA policy statement. We base our expectations on the fact that iron ore prices skyrocketed throughout the quarter, and that retail sales for Q4 also rebounded.
From the UK, we get the manufacturing PMI for February. Then on Thursday, we get the nation's construction PMI for the month and subsequently on Friday, the services index. Considering that economic growth has remained robust in the UK ever since the referendum, we think that investors will monitor these surveys primarily as gauges of how fast inflation is rising and thereby, of whether or not the BoE is likely to tighten its policy in the foreseeable future. Following comments from BoE policymakers on Tuesday, such a scenario appears rather unlikely. Even Ian McCafferty, a notorious hawk among the Committee, signaled that there is "some hope" that interest rates could start to normalize in two or three years. Even though that depends on how inflation evolves over the coming months, the fact that presently there seems to be very little appetite for rate hikes even by the most hawkish MPC members is important in our view.
From Germany, we get the preliminary CPI for February. In January, the yearly CPI rate rose even further to 1.9%, which is in line with the "below, but close to 2%" ECB's inflation target for the bloc. Without any forecast available for February, we see the case for the rate to have risen again and perhaps overshoot 2%. Our view is supported by the nation's composite PMI survey, which showed that prices charged by firms accelerated to a 68-month high in February. Something like that could raise speculation that the bloc's overall CPI, due to be released the following day, may follow suit and accelerate further.
From the US, we get a plethora of economic data. Let's kick off with personal income and spending data, both for January. The forecast is for income to have risen at the same pace as previously, while spending is expected to have slowed, but to have still grown at a healthy rate. We see the risks surrounding the income forecast as skewed to the downside, considering the disappointing average hourly earnings print for the month. At the same time, a slowdown in spending is supported by a similar reaction in January's retail sales.
We also get the ISM manufacturing PMI for February and on Friday, we get the non-manufacturing index for the same month. Both figures are expected to tick down, but to still remain well above the key 50 barrier that separates expansion from contraction. Despite the potential declines, given that these indices are expected to remain at healthy levels, we doubt that they will have a material effect on market pricing regarding the next Fed rate hike.
Finally, we get the core PCE price index for January, though no forecast is available yet. Nonetheless, given that this is the Fed's favorite inflation measure, and that this rate has been range-bound since February 2016, we expect it to attract a lot of attention as investors try to gauge the timing of the next increase in borrowing costs. A potential increase in this rate could spark new hopes with regards to a March hike, as it could confirm that underlying inflationary pressures have begun to accelerate, something already indicated by the acceleration in the core CPI of the same month.
Overall, we maintain our view that the FOMC is unlikely to rush into a March hike amid lackluster wage growth and heightened uncertainty around fiscal policy, which in our view is supported by the Fed minutes on Wednesday. Our model which is based on the yields of the Fed funds futures now shows a 28% probability for a March hike, but we see even that number as somewhat optimistic if we take into account that the Committee has turned more dovish this year through the rotation of voting rights. Therefore, we still expect the next rate hike to come in June. Alongside a potential uptick in the core PCE price index rate, we would like to see some acceleration in wage growth and some clarity around fiscal reform, before we reconsider this view.
On Thursday, we get Eurozone's preliminary CPI data for February, though no forecast is available. Our own view is that the headline rate may have risen further, but we remain mindful on whether the core rate will follow suit. The bloc's composite PMI survey for February showed that the rate of inflation in the euro area was the steepest since July 2011, supporting our view for a higher headline CPI rate. However, the report also found that part of the progress was owed to higher commodity prices, something that may be filtered out of the core CPI. ECB President Draghi placed a lot of emphasis on the core rate at the latest policy gathering. He said that although the headline rate has risen, that reflects primarily transitory effects. He made it clear that until there are convincing signs of an upward trend in core inflation, the Bank is likely to keep its dovish policy stance unchanged. Given these signals, we expect the core CPI to be closely watched, as a noticeable upturn in this rate in coming months is needed to fuel market speculation regarding the prospect of "ECB tapering" in the foreseeable future.
From Canada, we get GDP data for Q4. In the absence of a forecast, we see the case for GDP growth to have accelerated from the previous quarter. Retail sales were stronger in Q4 than Q3, oil prices were elevated for most of Q4, prior and following the OPEC consensus, and the nation's exports rose markedly following a soft Q3. Considering that when it last met, the BoC noted that another rate cut remains on the table, we believe that accelerating GDP growth is likely to diminish somewhat the likelihood for further easing by the Bank.
As we noted above, we also get the UK construction PMI for February.
On Friday, during the Asian morning, we get Japan's CPI data for January. In the absence of any forecast, we see the case for both the headline and the core rates to have risen. We base our view on the nation's forward-looking Tokyo headline and core CPI rates for January, both of which rose. Nevertheless, we doubt that any modest increase in these rates will lead to a material shift in BoJ policy away from QQE with yield-curve control. We think that the BoJ is likely to be happy to keep its ultra-loose policy intact for a while, amid gradually improving economic data overall and a considerably weaker yen following the US election.
From the UK we get the services PMI for February, and from the US, the ISM non-manufacturing PMI for the same month, both of which we already described.
Weekly Economic and Financial Commentary
U.S. Review
U.S. Housing Market Remains Solid
- In a light week of U.S. economic indicators, we focus on the housing market with existing home sales and the FHFA home price index released during the week. Existing home sales climbed more than expected in January, reaching a new-cycle high, but the solid pace will likely not be sustained in the coming months, as borrowing costs rise and inventories remain at a historically low level.
- Resulting from lean inventories, home prices remained firm in January, with the three-month moving average median home resale price up 6.0 percent year over year and FHFA home prices up 6.3 percent above year-ago levels.
U.S. Housing Market Takes Center Stage
During a light week of economic indicators, we received up-todate data on sales activity and pricing in the U.S. housing market. Following the first monthly contraction in five months in December, existing home sales rebounded 3.3 percent in January to a 5.69 million-unit rate, reaching the highest level in the postrecession period. Single-family sales rose 2.6 percent from an upwardly revised December print, and condos/co-ops grew 8.3 percent during the month.
The jump in sales activity in January is consistent with the surge in mortgage purchase applications in November, as would-be buyers rushed to lock-in rates following the election. On average it takes about two months to close on a home, according to the National Association of Realtors.
Existing home sales remained firm in 2016, registering a 3.8 percent increase relative to the previous year, but the pace intimates a moderation in activity from the strong 6.3 percent rate posted in 2015. Despite still-elevated consumer and builder sentiment, the pace of December existing sales activity likely will not be sustainable, as the low level of inventories continues to impede overall sales activity and the increase in mortgage rates makes it a bit more difficult for some prospective buyers to enter the market.
Total housing inventory now sits at 1.69 million, which is down 7.1 percent from a year earlier (top chart). Given the historically low level of inventories, home prices remained firm in January, with the three-month moving average median home resale price up 6.0 percent year over year (middle chart). Also released during the week, the FHFA home price index showed that prices grew 6.3 percent above year-ago levels.
One reason inventories remain low is the increase in housing rental unit conversions following the housing bust. Indeed, institutional buyers began purchasing distressed single-family homes for rentals, with initial holdings estimated at 180,000 (albeit a relatively small share on a national basis). The largest concentration of institutional holdings is in markets that saw the highest level of foreclosures during the downturn like Atlanta, Tampa, and Phoenix, according to company filings. In fact, these three markets combined comprise about one-third of total single-family institutional holdings.
With the homeownership rate for the under-35 age cohort (typically first-time home buyers) at a record-low level at just 34 percent, we expect the unprecedented high-share of renteroccupied households will remain firm in the coming years (bottom chart). Some first-time home buyers will also face hurdles from the recently reversed policy to reduce mortgage insurance premiums (MIPs) paid by borrowers on FHA-backed loans. In one of the first policy moves by the Trump Administration, FHA MIPs were increased from .60 percent (reduced in December) to .85 percent for most buyers. FHA purchase applications fell in January and February after a 6.7 percent increase in December.
U.S. Outlook
Consumer Confidence • Tuesday
Consumer confidence slipped 1.5 points to start 2017, after surging to a cycle high in December. The drop was solely due to a decline in the expectations component, which fell 6.6 points on the month, while the present situation component rose. Despite the monthly decline, at a reading of 111.8, the index still points to an optimistic U.S. consumer.
Consumers' assessment of current employment conditions has improved along with continued strengthening in the U.S. labor market. The proportion of consumers claiming jobs are "hard to get" has fallen meaningfully in line with the tightening of the U.S. labor market. We expect consumers to remain fairly optimistic over the course of the year, as continued job gains and income growth help propel sentiment and, in kind, consumer spending.
Previous: 111.8 Wells Fargo: 113.5 Consensus: 111.0
Personal Income & Spending • Wednesday
After a relatively weak start to Q4, personal consumption expenditures perked up 0.5 percent in December. Consumer spending was buoyed by a 1.4 percent pickup in purchases of durable goods, while spending on services rose a smaller 0.4 percent on the month.
On an inflation-adjusted basis, personal consumption expenditures rose 0.3 percent. Meanwhile, real disposable income inched up just 0.1 percent in December after a flat reading in November. With consumption outpacing income gains, the savings rate has fallen. The saving rate dropped to 5.4 percent in December from a rate of 5.6 percent in November and 6.1 percent a year ago.
We continue to expect personal consumption expenditures to support economic growth in the year ahead, as steady employment gains and real personal income growth support spending.
Previous: 0.3% Wells Fargo: 0.3% Consensus: 0.3% (Month-over-Month)
ISM Manufacturing • Wednesday
The ISM manufacturing index rose for the fifth consecutive month in January, climbing to 56.0. Gains were broad-based across index components, pointing to steady optimism among survey respondents. Nondefense capital goods orders ex-aircraft, our preferred gauge of near-term business fixed investment spending, rose 0.8 percent in December following a solid 1.5 percent reading in November. The production and new orders components also edged higher over the month. The employment component had perhaps the best upside surprise of the print, perking up to 56.1, the second-highest reading since the start of 2013. This was corroborated by the "hard" payrolls data, which reported a monthly gain of 5,000 manufacturing jobs. The steady improvement reported in this barometer for the factory sector suggests headwinds have eased relative to one year ago. We look for the ISM index to maintain its recent gains in February.
Previous: 56.0 Wells Fargo: 55.9 Consensus: 56.0
Global Review
Global Economy Continues to, Slowly, Improve.
- The Markit PMIs for the manufacturing and services sectors improved in February in the Eurozone and in Germany. Both manufacturing PMIs hit a cycle high, underscoring the improvement in this sector in the global economy.
- In South America, the Brazilian central bank lowered its Selic benchmark interest rate to 12.25 percent from 13.0 percent, and has brought interest rates down 200 bps since September of last year. We still see some more interest rates cuts in the coming months, as the rate of inflation has come back to the central bank's target of 4.5 percent plus/minus 2 percentage points.
Global Economy Continues to, Slowly, Improve
The Eurozone Markit manufacturing PMI cycle continued its improvement in February to a high of 55.5 from a 55.2 reading in January in a sign that the improvement in global economic activity is alive and well. However, the manufacturing index was not the only index that improved, as the Markit services PMI also shot up to 55.6 from a previous reading of 53.7, also a cycle high.
We saw a similar situation in Germany with its Markit/BME manufacturing index hitting a high of 57.0 in February from 56.4 in January while the Markit services PMI also rose to 54.4 from a reading of 53.4 the previous month. Meanwhile, we saw further improvement in Germany's IFO business climate index as well as in the expectations and current assessment IFO indices, which bodes well for the German economy going forward. At the same time Germany's Gfk consumer confidence index dropped marginally, from 10.2 in February to 10.0 in March, but remained close to the cycle high of 10.2.
Meanwhile, Mexico released Q4 and full-year GDP growth rates from the supply side and the numbers showed an economy that continues to grow but growth is not even across the sectors. The economy grew by 2.3 percent during 2016, down from a growth rate of 2.6 percent the previous year. However, the industrial sector's growth was down during the year, declining 0.4 percent and driven by the continuous collapse in the mining sector. However, the manufacturing sector, albeit still weak, was able to post a growth rate of 1.3 percent during the year.
We remain concerned for Mexican economic growth this year due to the current political environment, both north and south of the border and the potential effects this new environment may continue to have in the currency, the rate of inflation, and in expectations regarding the future. Thus, we are still forecasting a mild recession for this year. We will be able to make a better call on this year's performance after the release of Q1 2017 results as we may see the full effect of the depreciation of the currency, the increase in interest rates and the strong increase in inflation, which will all take a bite of economic activity this year.
In South America, the Brazilian central bank reduced its Selic benchmark interest rate by 75 bps this week to take the rate to 12.25 percent. The Selic rate is down 200 bps since September of last year, as inflation has already returned to the central bank's target of 4.5 percent plus/minus two percentage points after recording a rate of 10.7 percent in January of last year. January 2017's year-over-year rate of inflation was 5.4 percent. Furthermore, our expectation is that inflation dynamics will continue to improve during the first half of this year so the probability of more rate cuts by the Brazilian central bank remains in place, at least in the near term. These actions by the Brazilian central bank will help the country leave behind two years of GDP declines, and although we are not expecting a strong economic rebound this year. The economy will finally add to global GDP after two consecutive years of contraction.
Global Outlook
Australian GDP • Wednesday
Australia's export-oriented economy has been under pressure in recent years as slower growth in China (Australia's top export market) has weighed on growth in Australia.
For the most part in recent years, resilient domestic demand has offset the weakness in trade. In Q3 2016 however, steep declines in business investment spending pushed overall GDP growth into negative territory. In our view, this kept the potential for further rate cuts from Australia's Reserve Bank. More recently, the RBA has signaled a willingness to remain on hold, citing strength in the Aussie labor market.
Next week, we will get a sense of how the Australian economy finished out 2016 when Q4 GDP figures print on Wednesday.
Previous: -1.8% Consensus: 1.9% (QoQ, CAGR)
Canadian GDP • Thursday
Canadian GDP growth picked up to annualized pace of 3.5 percent in Q3 2016. The fastest quarterly growth rate in two years had a lot to do with a bounce-back in oil exports after wildfires held back exports in the prior quarter. Still, it was not all exports, as consumer spending also grew at a steady clip and inventories helped lift growth as well.
Thursday of next week brings a first look at Canadian GDP growth for Q4. Manufacturing shipments increased in two out of three months during the period and the same can be said of retail sales. Together, that suggests domestic demand may have held up well during the period. While trade figures may not benefit from the same low-base-effects that flattered the headline GDP number in Q3, Canada did return to a modest trade surplus in Q4.
Previous: 3.5% Wells Fargo: 2.0% Consensus: 2.0% (QoQ, CAGR)
Japanese CPI • Friday
In September 2016 the Bank of Japan (BoJ) added to its already accommodative monetary policy by introducing yield curve control and a pledge to overshoot its 2.0 percent inflation target.
The yield curve control essentially entails conducting the BoJ's purchases of Japanese government bonds (JGB), with a goal of achieve a 10-year JGB yield of 0.0 percent. The CPI overshoot is a bit more straight-forward with its pledge to overshoot the 2.0 percent target and "stay above the target in a stable manner."
The yield on the 10 year JGB has been range-bound near zero since September, but CPI inflation-while somewhat higher-has a long way to go to even hitting its target and obviously further to go to exceed it. Through December, CPI inflation was just 0.3 percent. Next Friday, we will get a look at January CPI figures for Japan.
Previous: 0.3% Wells Fargo: 0.3% Consensus: 0.3% (Year-over-Year)
Point of View
Interest Rate Watch
Capital Flows and Refinance Risk.
Recent trends in capital flows may signal a change in sentiment and thereby, upside risk to benchmark Treasury rates in the year ahead.
As illustrated in the top graph, there has been a recent dip in foreign private purchases of U.S. securities and while this has happened in the past, we are concerned that with the uptrend in Treasury debt issuance ahead, a decline in market demand would pit an upward bias to Treasury rates going forward. This bias would be reinforced by a Federal Reserve focused on raising the benchmark federal funds rate in response to rising inflation numbers.
CBO Baseline: More Debt
Under the current budget baseline, CBO projects a steady rise in U.S. debt held by the public as a percentage of GDP (middle graph). This baseline does not reflect the effect of fiscal stimulus either in the form of tax cuts or infrastructure/defense spending. Over the next 10 years, CBO projects federal revenues and outlays to average 18.1 percent of GDP and 22.0 percent of GDP, respectively. The result is a large and growing budget gap. This gap stems mostly from growing outlays for the major health programs, Social Security and net interest expenses. Our projected federal budget deficit for the current 2017 fiscal year climbs to $650 billion or 3.4 percent of GDP and then $950 billion or 4.7 percent of GDP for fiscal year 2018. The secular shift to mandatory spending and net interest expense is illustrated in the bottom graph.
Supply and Demand Matters
This projected increase in Treasury deficits/debt issuance over the next two years stands in contrast to the decline in foreign private purchases we have seen, as shown in the top graph. This pattern creates a refinancing risk over the next few years. In the past, the failure to fund refinancing at a profitable pace has been the focus of many credit squeezes and economic downturns. We are alert to this risk as we move forward.
Credit Market Insights
Expanding Household Debt
According to the Federal Reserve's quarterly report on debt and credit, household debt balances increased significantly to $12.58 trillion in the Q4 of 2016 and now remains just 0.8 percent below its Q3 2008 peak of $12.68 trillion. Mortgage balances, which comprise the largest share of household debt, increased $130 billion from Q3 2016. Moreover, all categories of non-housing debt balances grew in Q4, with a $22 billion jump in auto loan balances, a $32 billion increase in credit card balances and a $31 billion increase in student loan balances.
Despite the growing debt burden, delinquency rates were relatively stable in Q4 2016. Roughly 200,000 consumers had a bankruptcy notation amended to their credit reports in Q4 2016, 4 percent fewer than in the same quarter last year. Mortgage delinquencies were also roughly stable, with 1.6 percent of mortgage balances 90 or more days delinquent at the end of Q4 2016. Likewise, credit card delinquency rates for 90 days or more were unchanged at 7.1 percent. However, auto loan delinquency rates continued to deteriorate, with 3.8 percent of auto loan balances 90 or more days delinquent on Dec. 31, representing a 0.2 percentage point increase from the previous quarter.
Finally the number of credit inquiries within six months, declined from the previous quarter to 171 million.
Topic of the Week
How Many Rate Hikes in 2017?
Among financial market participants, the general consensus is that the Federal Open Market Committee (FOMC) will continue raising its target for the fed funds rate in the near future. Whether the FOMC can shake its recent string of projecting multiple rate hikes and delivering just one remains an open question.
The answer will likely depend on the state of the labor market and inflation expectations. In our past work, we have provided an econometric model to estimate the near-term path of the fed funds rate (Persistent Sightings of Low-Inflation Zombies—A Threat to Market Pricing? available upon request). The model utilizes probabilities of inflationary, disinflationary and stable price pressures, top chart, along with a measure of the state of the labor market to estimate the path of the fed funds rate, bottom chart.
Our model results suggest a possibility of more than one rate hike in 2017. Why? Since June 2011, the probability of disinflationary price pressure was higher than the other two price scenarios. The persistent inflation readings below the Fed's target of two percent inflation were considered to be one major reason (along with other factors) for only one rate hike per year for 2015/2016.
Today, according to our model, the inflation outlook for the near term has changed from disinflation to stable prices. That is, since November 2016, the probability of stable prices has been higher than the other two price scenarios and the model suggests a rate hike in the next six months. The persistent below two percent inflation rate has been a major cause of the slow pace of monetary policy normalization, and our model indicates there has been a change in the inflation outlook and thereby the potential for more than one rate hike in 2017. We will continue to monitor our model and will update our readers accordingly.
The Weekly Bottom Line
HIGHLIGHTS OF THE WEEK
United States
- The outlook for economic growth got a bit rosier this week with the release of the preliminary February survey results of purchasing managers that showed economic momentum continuing to build at the start of 2017.
- The data flow this week was light for the U.S., but existing home sales for January confirmed that the U.S. housing market remains resilient despite the uptick in mortgage rates. Still, the outsized strength in January is unlikely to be maintained, as a number of temporary factors come off in upcoming months.
- Little news in the FOMC minutes other than a confirmation that the U.S. economy was evolving in line with expectations. Overall, the FOMC remains confident that the slow and steady absorption of economic slack, and the corresponding progress of inflation toward its 2% target, warrants a gradual pace of tightening of monetary policy.
Canada
- A soft December retail sales report was a blemish on the otherwise constructive fourth quarter data flow for the Canadian economy.
- We continue to expect the Canadian economy to have grown by 2.2% in 2016Q4, above the Bank of Canada's expectations of 1.5% advance. Net trade, consumption, government spending, and residential investment are all expected to have contributed to growth.
- For the Bank of Canada, we expect the focus at next week's decision to remain on the strength of the currency, rising longer-term borrowing costs, and still weak underlying inflationary pressures. As such, we remain of the view that the Bank of Canada is unlikely to move its policy interest rate from 0.50% any time soon.
UNITED STATES - BUILD IT AND THEY WILL COME
This week we got further signs that global economic growth continued to firm at the start of 2017. Despite elevated policy uncertainty, financial market volatility remains low, but it's unclear if this is a sign of market certainty or complacency about the economic outlook.
Indeed, the global outlook is looking a little rosier than a month ago. Preliminary surveys of manufacturers for February point to continued strong expansion in advanced economies despite elevated political uncertainty from upcoming European elections.
One thing markets have taken notice of is the gains Marine Le Pen has made in the polls. If she were to become President of France, the populist candidate plans to call a referendum on France remaining in the EU if she is unable to renegotiate its terms of membership. The threat of 'Frexit' caused spreads between French (and other euro area) bonds with German bunds to widen this week.
The data flow this week was light, but supported our view of U.S. economy growing above its trend pace at the start of 2017. Along with the supportive preliminary manufacturing survey data, January existing home sales rose to the highest level in a decade in January - despite a 70 basis point rise in mortgage rates since last September (Chart 1). Strong existing home sales are further confirmation of the progress the U.S. housing market has made since the crash over a decade ago. Nonetheless, this elevated level of activity is unlikely to be maintained in upcoming months for a number of reasons.
First, some of the activity likely reflects a pulling-forward in contract signings in order to lock-in low mortgage rates. Secondly, unusually warm weather also helped pull forward some activity from the spring market. Lastly, until more sellers put their homes on the market, the low inventory of homes will weigh on sales volumes and put upward pressure on prices (Chart 2). While several years of home price growth have moved helped homeowners to rebuild equity buffers and should allow move-up buyers to re-enter the market, a gradual move higher in housing turnover is more likely than a sudden shift. Overall, we expect the U.S. housing market will record another strong performance this year, supported by fundamentals such as rising household formation and past gains in income and wealth.
The strong performance of the U.S. economy to start the year remains broadly consistent with the Fed's economic projections, as was noted in the minutes released this week from the first FOMC meeting of the year. The Fed also discussed the uncertainty about the economic impact from the proposed changes in fiscal policy by the new administration, changes that will likely have material implications to the Fed's economic projections and the pace of policy normalization. Overall, the FOMC remains confident that the slow and steady absorption of economic slack, and the corresponding progress of underlying inflation toward its 2% target, warrants a gradual pace of tightening of monetary policy. Our view is for the next move up the fed funds rate to take place in June, but we cannot rule out a March or May rate hike if the data flow surprises to the upside.
CANADA - 2016 LIKELY TO HAVE ENDED ON A HEALTHY NOTE
The past week saw a grab bag of economic data ahead of next week's GDP report and the Bank of Canada interest rate decision. The data generally pointed to a healthy economy, as small business confidence rose to a two-year high and corporate profits rose again for a second straight quarter, placing earlier declines firmly in the rear-view mirror.
If there was disappointment to be found in the data, it was in the retail sales figures for December, which saw spending down both in dollar and volume terms (Chart 1). It has been suggested that changing shopping patterns (such as the rise of 'Black Friday' sales in Canada) may not be fully accounted for in the data, but in non-seasonally adjusted terms, December saw weaker sales volumes than has been typical of the past five years, consistent with softened consumer demand.
December's retail sales figures notwithstanding, it appears that Canada had a fairly healthy end to 2016. Quarterly GDP figures, to be released on March 2nd, are likely to show that the economy expanded above its potential speed again in the fourth quarter, with our tracking pointing to an expansion of 2.2% (quarter-on-quarter at annual rates). Net exports are expected to be key driver of growth, alongside consumer demand, real estate, and government investment (further details are included in the 'Upcoming Releases' section of this document).
At 2.2%, growth is anticipated to have been stronger than the 1.5% that Bank of Canada was expecting at the time of their January Monetary Policy Report. Somewhat unusually, the Bank will not know the actual growth figure before their monetary policy decision, which is universally expected to be a hold. More interesting than the decision will be the language in the accompanying statement. Governor Poloz likely remains concerned about the level of both the Canadian dollar and longer-term borrowing rates, both of which have been taken along for the ride as their U.S. counterparts have risen post-election.
While higher rates are likely appropriate for the U.S., Canada remains at a different stage of the economic cycle, and we expect Governor Poloz to emphasize this fact once again in an effort to counteract rises in the currency and borrowing costs. Underscoring the challenge that Governor Poloz faces are the January inflation figures (Chart 2). Headline inflation rose sharply to hit 2.1%, but this was largely on the back of energy prices (and, to a lesser extent, associated carbon pricing measures). The Bank of Canada's three alternative measures of inflation, which attempt to capture the 'underlying' dynamics, remained stubbornly soft, reflecting the still sizeable slack remaining in the Canadian economy.
As such, we expect that the Bank of Canada will look through the energy price effects (which are likely to persist for several quarters), focusing instead on these core measures and the remaining slack. While market pricing has moved up in recent weeks on the recent string of solid economic data, we remain of the view that Canadian monetary policy is likely to remain patient. Indeed, given the still sizeable downside risks to the economic outlook, a cut from the Bank of Canada appears the greater risk.
Week Ahead Dollar Mixed as Trump Pro-Growth Policies Remain Vague
Trump to Speak Before Congress on Feb 28
The U.S. dollar is mixed against majors as the Federal Open Market Committee (FOMC) minutes pointed to an interest rate hike "fairly soon" but were contrasted with cautious comments from Treasury Secretary Steven Mnuchin that have reduced expectations of pro-growth policies being introduced in the short term. House Speaker Paul Ryan invited President Trump at the end of January to speak before congress to deliver his first public address after his inauguration. This could be an opportunity to refocus his administration into pushing his anticipated fiscal stimulus and infrastructure spending policies.
The Bank of Canada (BoC) will release its rate statement on Wednesday, March 1 at 10:00 am EST (3:00 pm GMT). The Canadian central bank is anticipated to hold interest rates unchanged at 0.50 percent despite rising inflation. The loonie has gained as the price of crude remains strong after the Organization of the Petroleum Exporting Countries (OPEC) production cut agreement came in effect earlier in the year despite the increase in drilling activity in North America. Weekly U.S. crude inventories will be published on Wednesday, March 1 at 10:30 am EST (3:30 pm GMT)
The EUR/USD lost 0.459 percent in the last five days. The single currency is trading at 1.0562 after touching lows of 1.0494 in the middle of the week as the minutes from the Federal Open Market Committee (FOMC) were released. The lack of commitment from Fed officials despite the hawkish rhetoric is passing the buck to the Trump administration to be the one responsible for signalling when rates will rise.
French political anxiety was reduced as pro-European candidate Emmanuel Macron's campaign is gathering momentum as one-time favourite Francois Fillon's scandal has shaken the election's outlook. The first round of the elections will take place on the 23 of April with low probability of a decisive win by candidates will force a second run between the top two candidates in early May. Polls now have Marie LePen and Emmanuel Macron going through to the run-off. Macron is then expected to get 59 percent of the vote making him the next French President.
The USD is also losing some momentum as the pro-growth policies promised by President Trump are now expected to come later in the year. Mnuchin's comments about a significant tax reform passing by the August recess. Trump's words before congress on February 28 could add some clarity to his economic agenda and in turn boost the USD, or if he intends to put priority on anti trade and immigration policies it could distract from the economic boost the Fed and the market are waiting for.
Gold rose 1.781 percent during the week. The yellow metal is trading at $1,260.19 as investors flocked to the safe haven asset after the U.S. has lacked commitment to its fiscal stimulus and political anxiety surrounding the French elections and Greek bailout payments.
Although the U.S. Federal Reserve members have said on various occasions that the central bank is ready to hike, and in some cases that waiting too long before raising rates would not be beneficial there is little evidence they will change interest rates in the upcoming March meeting. The CME FedWatch tool shows the market is pricing the probability of a rate hike at only 22.1 in March. The lack of details form the Trump administration on pro-growth policies have benefited the precious metal who is now near the levels it reached after the election on the surprise win by Donald Trump.
The USD/MXN lost 2.859 percent in the last 5 days. The currency pair is trading at 20.5403 after the Mexican central bank announced a new currency intervention tool on Tuesday. A $20 billion dollar hedging program that will not draw on Banxico's $20 billion dollar international reserves. The peso is trading near post U.S. election levels.
An official visit from U.S. Secretary of State Rex Tillerson and U.S. Homeland Security Secretary John Kelly visited Mexico in an effort to improve international relations with its southern neighbour. The comments from Kelly in particular appeared to contradict those from Trump as the Homeland Security Secretary said there would be no mass deportations.
The biggest factor in the peso's depreciation was Trump's immigration and trade rhetoric. The market was caught by surprise when the President continues right on his campaign persona when there were other pressing matters to the U.S. economy. Mexican fundamentals have had little effect on the value of the currency as the high liquidity of the peso have made it a proxy for emerging market investments and later as a speculative vehicle to gauge the Trump effect. The lost momentum of the Trump trade has made the peso one of the top performers in the month of February.
Market events to watch this week:
Monday, February 27
- 8:30 am USD Core Durable Goods Orders m/m
Tuesday, February 28
- 8:30 am USD Prelim GDP q/q
- 10:00 am USD CB Consumer Confidence
- 7:30pm AUD GDP q/q
- 8:45pm CNY Caixin Manufacturing PMI
Wednesday, March 1
- 4:30 am GBP Manufacturing PMI
- 10:00 am CAD BOC Rate Statement
- 10:00 am CAD Overnight Rate
- 10:00 am USD ISM Manufacturing PMI
- 10:30 am USD Crude Oil Inventories
Thursday, March 2
- 4:30 am GBP Construction PMI
- 8:30 am CAD GDP m/m
- 8:30 am USD Unemployment Claims 245K 244K
Friday, March 3
- 4:30 am GBP Services PMI
- 10:00 am USD ISM Non-Manufacturing PMI
- 1:00pm USD Fed Chair Yellen Speaks
*All times EST
Weekly Focus: Will We Finally Get Some Details on Trump’s Tax Policy?
Market movers ahead
- In the US, Donald Trump's speech to Congress on Tuesday will be monitored closely, as a few weeks ago he promised that he would announce 'something phenomenal in terms of tax'.
- In the UK, the so-called 'committee stage' begins on Monday, when the House of Lords is due to discuss and vote on amendments to the EU exit legislation.
- Next week is also packed with interesting data releases: in the US, PCE core inflation for January, which is due on Wednesday, could be important for timing the next FOMC rate hike and in the euro area we expect HICP inflation to rise further in February.
- In Scandinavia, we also have a very busy week in terms of data releases. Most noteworthy are Swedish Q4 GDP data and Norway's NAV unemployment report. Finally, the currency reserves figures from Danmarks Nationalbank (DN) will show whether DN sold DKK in FX intervention to fend off the upward pressure on DKK in February.
Global macro and market themes
- Holding an EU/euro referendum would be difficult for Marine Le Pen without strong parliamentary backing.
- EUR periphery spread widening if Le pen wins but ECB set to stand ready to ease financial spillover.
- In FX markets, we would expect the EUR to weaken versus other major currencies and EUR/USD to settle 2-3 figures lower.
- Nordic FX and FI markets are set to see safe-haven inflows in the case of a Le Pen win.
Higher Energy Prices Pushed Canadian Inflation above 2% in January
- CPI inflation jumped to 2.1% year-over-year from 1.5% in December as energy price inflation surged to 12%.Today's reading is well above the consensus forecast of 1.6% and marks the first time inflation has exceeded 2% since October 2014.
The all items index rose 0.9% on a monthly, unadjusted basis in January, marking the strongest increase in two years. A good portion of the gain reflected a 4.5% rise in the energy component as both gasoline and natural gas prices picked up strongly. Newly-introduced carbon pricing schemes in Ontario and Alberta were major factors, although higher commodity prices also played a role. Another policy change in Ontario /an HST rebate on electricity bills/provided some offset, driving electricity price inflation into negative territory for the first time in three years. Food prices rose for just the second time in six months, although the rate of food price deflation accelerated to -2.1% year-over-year as a currency-driven surge in fresh food prices in January 2016 fell out of the calculation. The current period of food price deflation is the most significant since 1992 and reflects lower prices for agricultural commodities, less exchange rate pass-through, and according to the Bank, more intense competition in the retail sector.
Some measures of core inflation were firmer in January, particularly the all items ex food and energy index which is now up 2.2% year-over-year. However, the Bank of Canada's new core measures were little changed on balance, with the average of the three remaining steady at 1.6% (December's average was revised down from 1.7% after rounding).
Our Take:
Between base effects in the food and energy components, newly-introduced carbon pricing and other policy changes at the provincial level, there is a lot to digest in today's inflation report. Ultimately, while the headline reading came in well above market expectations and the Bank of Canada's forecast, the main driver of the increase (energy prices) was not a surprise. Inflation is on track to exceed the Bank's 1.8% projection for the first quarter, but their new core measures, which remain slightly below 2% on average, are consistent with their assessment that the economy is running below potential. On the labour market side, job growth has been very strong in recent months and measures of slack have generally returned to levels seen prior to the oil price shock, although weak wage growth seems to indicate the economy remains short of full employment. With underlying details of today's inflation report largely fitting the Bank's narrative, we expect next week's policy statement (following what is universally expected to be a steady rate decision) will continue to reflect a neutral, if not slightly cautious tone.