Sample Category Title
AUD Rally Continues, 0.77 Handle Now In Focus
Key Points:
- Upsides are available but just how far the rally can extend is unclear.
- Last week's performance leaves the AUD well positioned to surge.
- Both technicals and fundamentals are going to be vital this week.
The AUDUSD has been trending higher for some time now and many are beginning to question where it willend up. Some analysts have the pair pegged to hit the 0.80 handle before reversing once again but the 0.77 level also seems to be providing ample resistance as well. As a result, it's worth taking a look at the AUD's most recent week and also what the bias could be for the week to come.
Starting with last week's performance, the Aussie Dollar spent most of last week trending steadily higher in reaction to a number of weaker US fundamental results. Namely, the Market Flash Manufacturing PMI came in at only 54.3 and the Jobless Claims increased to 244K. Any positive US data was offset by the 0.5% uptick in the Australian Hourly Earnings result and remarks from the RBA's Lowe signalling that he believed interest rates had bottomed. However, news that Deutsch bank had forecasted an AUD rally up to the 0.80 mark also added to the overall buying pressure. Unfortunately, these gains were short-lived as a strong Michigan Consumer Sentiment result of 96.3 was all it took to send the pair reeling as the week closed.
As a result of last week's performance, the AUDUSD is in an interesting position. Specifically, the pair has some room to move higher but it is also beholden to the zone of the resistance around the 0.77 handle which seems intent on remaining in intact. Consequently, we will have to look at both the technicals and the fundamentals to establish a bias for the week to come.
On the technical front, the AUD looks to be firmly in an uptrend with the 12, 20, and 100 day EMA's being about as bullish as they possibly could be. Additionally, whilst the rally is moderating somewhat, the Parabolic SAR readings and the ADX oscillators are both signalling that this uptrend remains fairly robust. Interestingly, the RSI is still neutral which seems to indicate that gains may also be more sustainable that initially thought, despite them likely being capped by the 0.77 handle once again.
As for what lies ahead in the news, there is quite a lot of economic data on offer but the major item to monitor is the Australian GDP result. Specifically, the quarterly data is due to be released and, whilst it is currently forecasted at 0.7%, the market will be wary of another negative outcome which would put the nation into a technical recession. Indeed, these fears will be mounting in the wake of Lowe's remarks, in which, he mentioned that Australia was unlikely to reach its 3% GDP growth target. However, a sufficiently positive result could be just the thing needed to spark a rally capable of pushing past the 0.77 handle.
Ultimately, upsides are present for this pair but just how large these are is much less certain. As a result, monitor both the technical and fundamental factors mentioned above as they will be invaluable in staying ahead of the rather unpredictable AUD.
European Open Briefing
Global Markets:
- Asian stock markets: Nikkei down 0.85 %, Shanghai Composite fell 0.30 %, Hang Seng rose 0.10 %, ASX 200 lost 0.30 %
- Commodities: Gold at $1257 (+0.10 %), Silver at $18.43 (+0.10 %), WTI Oil at $54.25 (+0.45 %), Brent Oil at $56.60 (+0.50 %)
- Rates: US 10-year yield at 2.34, UK 10-year yield at 1.08, German 10-year yield at 0.18
News & Data:
- Australian Inventories Q4 0.3% (QoQ) (Prev 0.5%)
- Australian Company Operating Profit Q4 20.1% (QoQ) (prev 1.0%)
- PBoC Fixes USDCNY Reference Rate At 6.8814 (prev fix 6.8655 prev close 6.8700)
CFTC Positioning Data:
- EUR short 58K vs 47K short last week. Shorts increased by 11K
- GBP short 66K vs 67K short last week. Shorts trimmed by 1K
- JPY short 50K vs 51K short last week. Shorts trimmed by 1K
- CHF short 9K vs 11K short last week. Shorts trimmed by 2K
- CAD long 25K vs 19K long. Longs increased by 6K
- AUD long 33K vs 24K long. Longs increased by 9K
- NZD long 3K vs long 3K last week. No change.
Markets Update:
The Pound came under pressure overnight amid renewed speculations about another Scottish independence referendum. GBP/USD started the new trading week around 1.2460 and fell to a low of 1.2390 ahead of the Tokyo open. The pair later recovered to 1.2430.
Other than that, the US Dollar had a rather mixed performance. The Australian Dollar was the strongest overnight, despite the risk-off sentiment in equity markets. AUD/USD rose from 0.7665 at the open to a high of 0.7705. Meanwhile, EUR/USD began the trading week at 1.0555 and rallied to 1.0575 later in the session.
USD/JPY came under pressure along with the Nikkei and fell to 111.90. However, the pair managed to recover to 112.30. Resistance is now seen at 112.55 and 112.90.
Upcoming Events:
- 10:00 GMT – Euro Zone Consumer Confidence
- 10:00 GMT – Euro Zone Business Climate
- 13:30 GMT – US Durable Goods Orders
- 15:00 GMT – US Pending Home Sales
- 16:00 GMT – FOMC Member Kaplan speaks
- 21:45 GMT – New Zealand Trade Balance
- 23:50 GMT – Japan Industrial Production
- 23:50 GMT – Japan Retail Sales
The Week Ahead:
Tuesday, February 28th
- 00:00 GMT – Australian HIA New Home Sales
- 00:00 GMT – Australian ANZ Business Confidence
- 00:30 GMT – Australian Current Account
- 07:45 GMT – French CPI
- 07:45 GMT – French GDP
- 10:00 GMT – Italian CPI
- 13:30 GMT – US GDP
- 14:45 GMT – US Chicago PMI
- 15:00 GMT – US CB Consumer Confidence
- 15:00 GMT – US Richmond Manufacturing Index
- 20:00 GMT – FOMC Member Harker speaks
- 20:30 GMT – FOMC Member Williams speaks
- 21:00 GMT – US President Trump speaks
- 22:30 GMT – Australian AIG Manufacturing Index
Wednesday, March 1st
- 00:30 GMT – Australian GDP
- 01:00 GMT – Chinese Manufacturing PMI
- 01:00 GMT – Chinese Non-Manufacturing PMI
- 01:45 GMT – Chinese Caixin Manufacturing PMI
- 08:45 GMT – Italian Manufacturing PMI
- 08:50 GMT – French Manufacturing PMI
- 08:55 GMT – German Manufacturing PMI
- 08:55 GMT – German Unemployment Change
- 08:55 GMT – German Unemployment Rate
- 09:00 GMT – Euro Zone Manufacturing PMI
- 09:30 GMT – UK Manufacturing PMI
- 13:00 GMT – German CPI
- 13:30 GMT – US Core PCE Price Index
- 13:30 GMT – US Personal Income
- 13:30 GMT – US Personal Spending
- 13:30 GMT – Canadian Current Account
- 14:45 GMT – US Manufacturing PMI
- 15:00 GMT – US ISM Manufacturing PMI
- 15:00 GMT – Bank of Canada Interest Rate Decision
- 15:30 GMT – US Crude Oil Inventories
- 18:00 GMT – FOMC Member Kaplan speaks
Thursday, March 2nd
- 00:30 GMT – Australian Building Approvals
- 00:30 GMT – Australian Trade Balance
- 06:45 GMT – Swiss GDP
- 08:15 GMT – Swiss Retail Sales
- 09:30 GMT – UK Construction PMI
- 10:00 GMT – Euro Zone CPI
- 10:00 GMT – Euro Zone Unemployment Rate
- 13:30 GMT – US Initial Jobless Claims
- 13:30 GMT – Canadian GDP
- 23:30 GMT – Japanese CPI
- 23:30 GMT – Japanese Household Spending
Friday, March 3rd
- 01:45 GMT – Chinese Caixin Services PMI
- 07:00 GMT – German Retail Sales
- 08:45 GMT – Italian Services PMI
- 08:50 GMT – French Services PMI
- 08:55 GMT – German Services PMI
- 09:00 GMT – Euro Zone Services PMI
- 09:00 GMT – Italian GDP
- 09:30 GMT – UK Services PMI
- 10:00 GMT – Euro Zone Retail Sales
- 14:45 GMT – US Services PMI
- 15:00 GMT – US ISM Non-Manufacturing PMI
- 18:00 GMT – Fed Chair Yellen speaks
GBP/JPY Daily Outlook
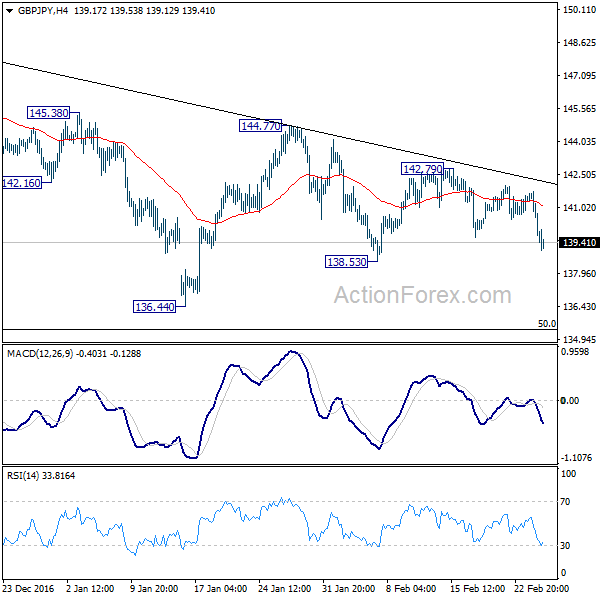
Daily Pivots: (S1) 138.80; (P) 140.28; (R1) 141.15; More...
GBP/JPY dips notably today but stays in range of 138.53/142.79. Intraday bias remains neutral first. Overall, price actions from 148.42 are seen as a corrective pattern. Below 138.53 will bring deeper fall, possibly through 136.44 support. But strong support could be seen at 50% retracement of 122.36 to 148.42 at 135.39 to bring rebound. Above 142.79 will turn bias back to the upside for 144.77 and above.
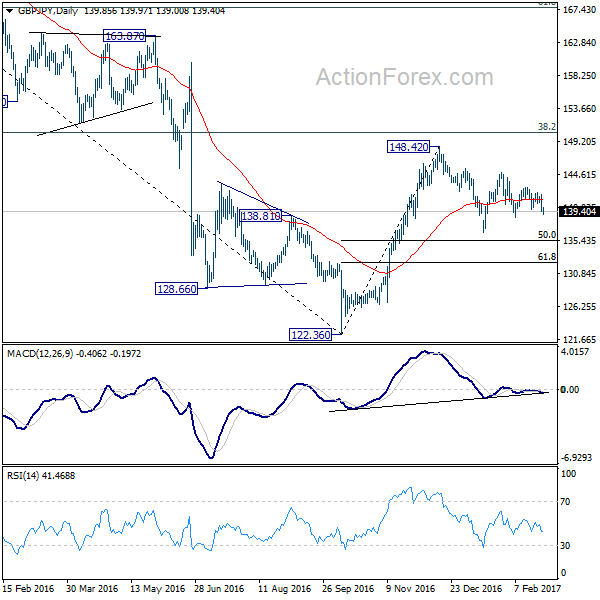
In the bigger picture, price actions from 122.36 medium term bottom are still seen as a corrective pattern. Main focus is on 38.2% retracement of 195.86 to 122.36 at 150.42. Rejection from there will turn the cross into medium term sideway pattern with a test on 122.36 low next. Though, sustained break of 150.42 will extend the rebound towards 61.8% retracement at 167.78.
EUR/JPY Daily Outlook
Daily Pivots: (S1) 117.91; (P) 118.71; (R1) 119.18; More...
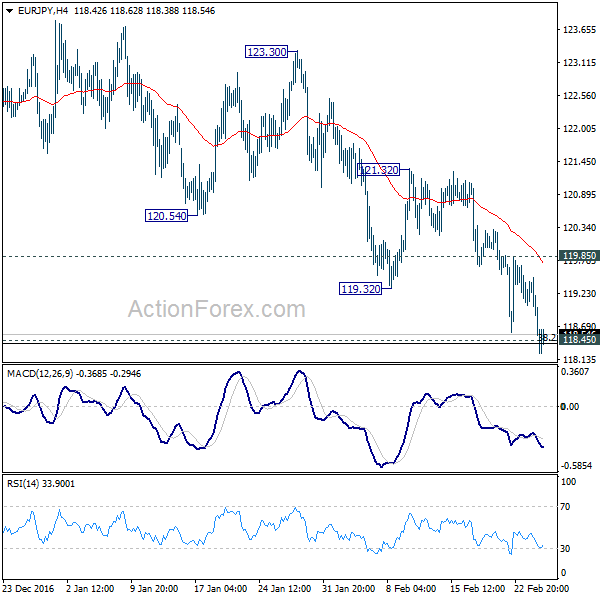
Intraday bias in EUR/JPY remains cautiously on the downside for the moment. Current development argues that whole rebound from 109.20 has completed at 124.08 already. Sustained trading below 118.45 cluster support (38.2% retracement of 109.20 to 124.08 at 118.39) will confirm. In such case, EUR/JPY should target 61.8% retracement at 114.88 and below. On the upside, though, break of 119.85 minor resistance will indicate short term bottoming and turn bias back to the upside for 121.32 resistance instead.
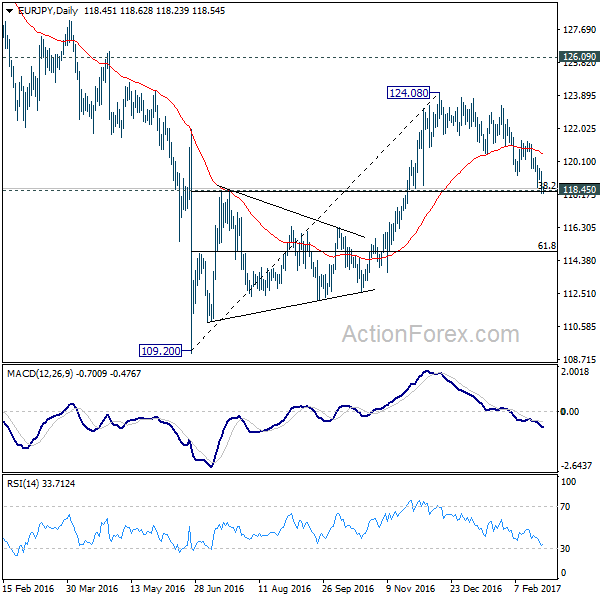
In the bigger picture, price actions from 109.20 medium term bottom are seen as part of a medium term corrective pattern from 149.76. Current development argues that it's completed at 124.08, ahead of 126.09 key resistance level. Deeper fall would be seen back to 109.20 low. Break there will extend the whole medium term down trend from 149.76 high.
Subscribe to our daily and mid-day newsletter to get this report delivered to your mail box
EUR/AUD Daily Outlook
Daily Pivots: (S1) 1.3700; (P) 1.3767; (R1) 1.3830; More...
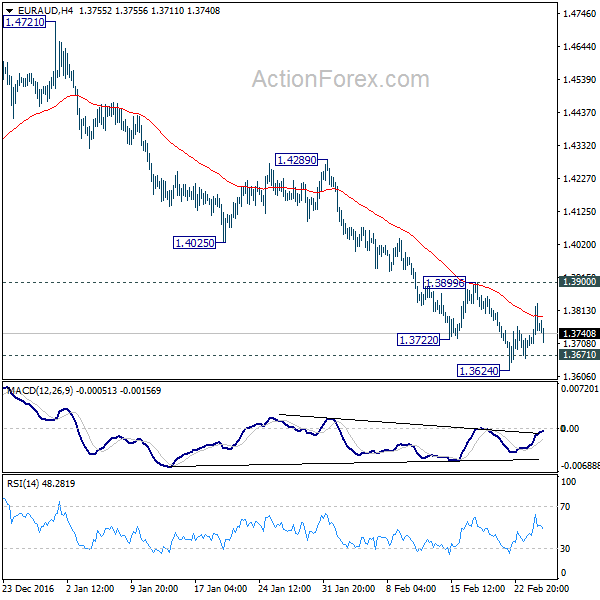
Intraday bias in EUR/AUD remains neutral for the moment. At this point, we'd still expect strong support from 1.3671 to contain downside to complete the correction from 1.6587. This is supported by bullish convergence condition in 4 hour MACD. Break of 1.3900 resistance will confirm short term bottoming and turn bias back to the upside for 1.4289 resistance. However, sustained break of 1.3671 will invalidate our view.
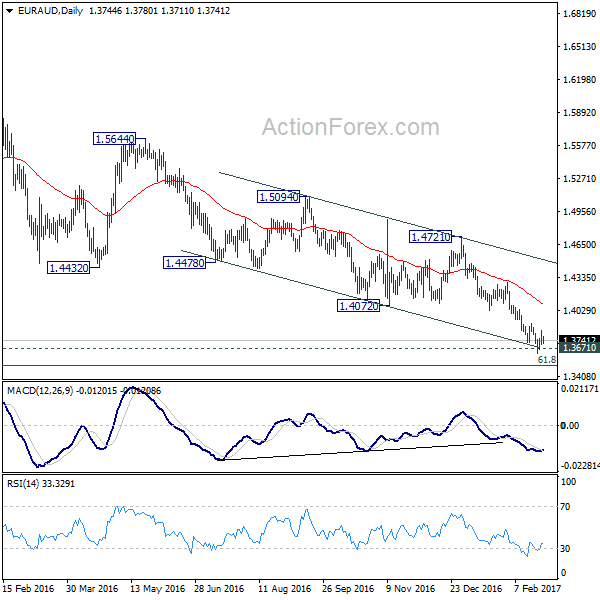
In the bigger picture, price actions from 1.6587 medium term top are viewed as a corrective pattern. We'd expect strong support from 1.3671 key level to contain downside and bring rebound. Up trend from 1.1602 should not be finished and will resume later. Break of 1.4721 resistance will indicate completion of such correction and turn outlook bullish for retesting 1.6587 high. However, sustained break of 1.3671 will invalidate our bullish view and would turn focus back to 1.1602 long term bottom.
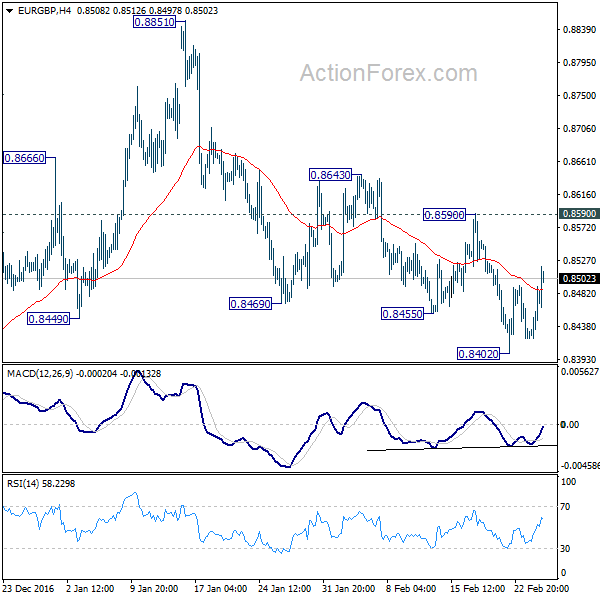
EUR/GBP Daily Outlook
Daily Pivots: (S1) 0.8428; (P) 0.8460; (R1) 0.8498; More...
EUR/GBP recovers today but stays in range of 0.8402/8590. Intraday bias remains neutral first. With 0.8590 resistance intact, we're holding on to our bearish view. That is, fall from 0.8851 is the third leg of the whole corrective pattern from 0.9304. Below 0.8402 will turn bias to the downside for 0.8303 first. Break will confirm our bearish view and target 0.8116 key cluster support level. However, on the upside, break of 0.8590 resistance will dampen our view and turn bias back to the upside.
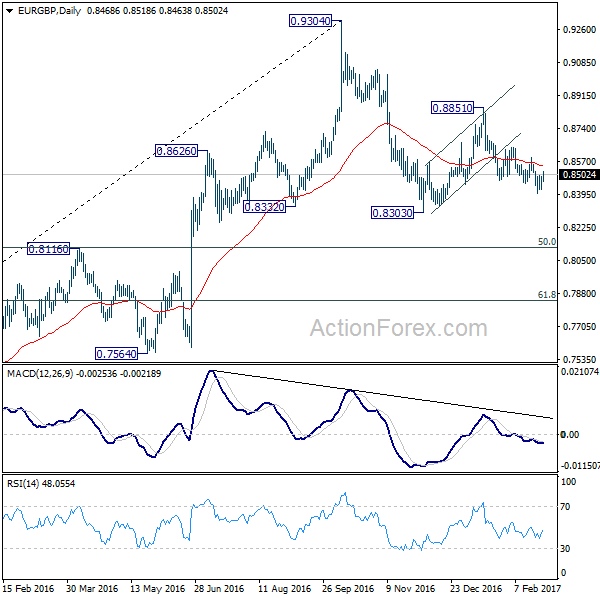
In the bigger picture, price actions from 0.9304 are viewed as a medium term corrective pattern. Deeper fall cannot be ruled out yet. But we'd expect strong support from 0.8116 cluster support (50% retracement of 0.6935 to 0.9304 at 0.8120) to contain downside. Overall, the corrective pattern would take some time to complete before long term up trend resumes at a later stage. Break of 0.9304 will pave the way to 0.9799 (2008 high).
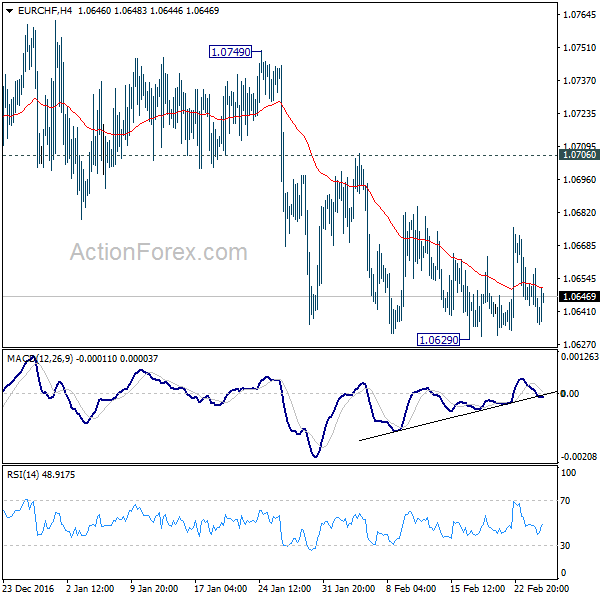
EUR/CHF Daily Outlook
EUR/CHF Daily Outlook
Daily Pivots: (S1) 1.0632; (P) 1.0645; (R1) 1.0655; More...
EUR/CHF continued to stay in range above 1.0629 last week without any new development. Initial bias remains neutral this week first. As 1.0706 resistance stays intact, deeper decline is still expected in the cross. Firm break of 1.0620 key support level will extend the larger decline from 1.1198 to 1.0485 fibonacci level. However, break of 1.0706 resistance will indicate short term bottoming and turn bias back to the upside. Further break of 1.0749 resistance will raise the chance of medium reversal.
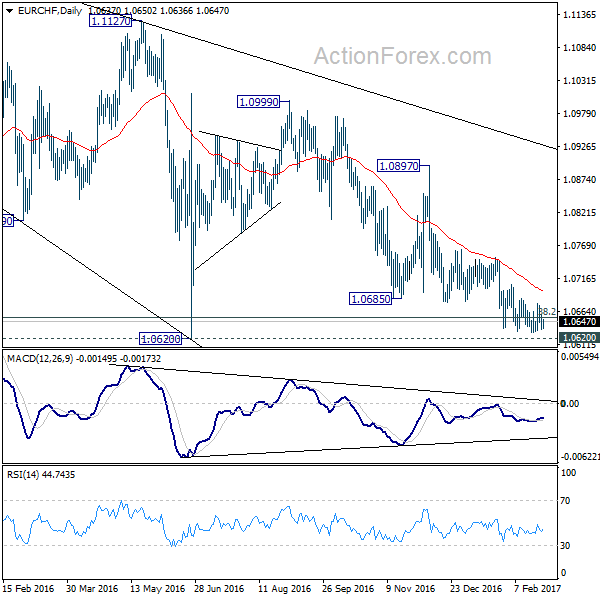
In the bigger picture, the decline from 1.1198 is seen as a corrective move. Such correction is still in progress. Sustained trading below 38.2% retracement of 0.9771 to 1.1198 at 1.0653 will target 50% retracement at 1.0485. On the upside, break of 1.0897 resistance is needed to confirm completion of such fall. Otherwise, outlook will stay bearish.
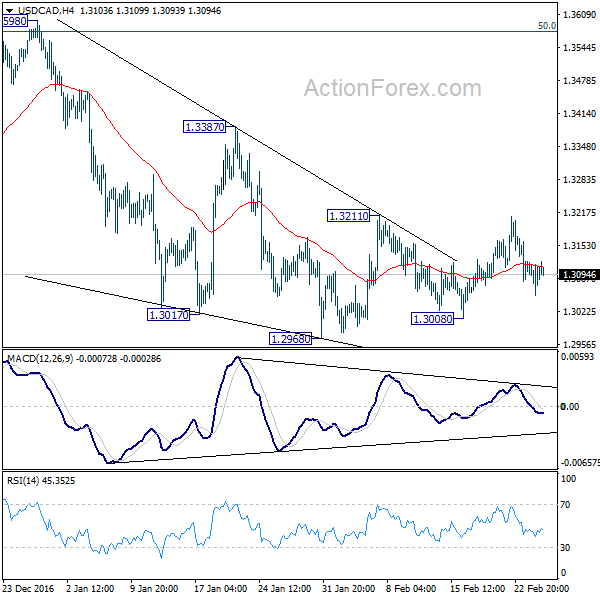
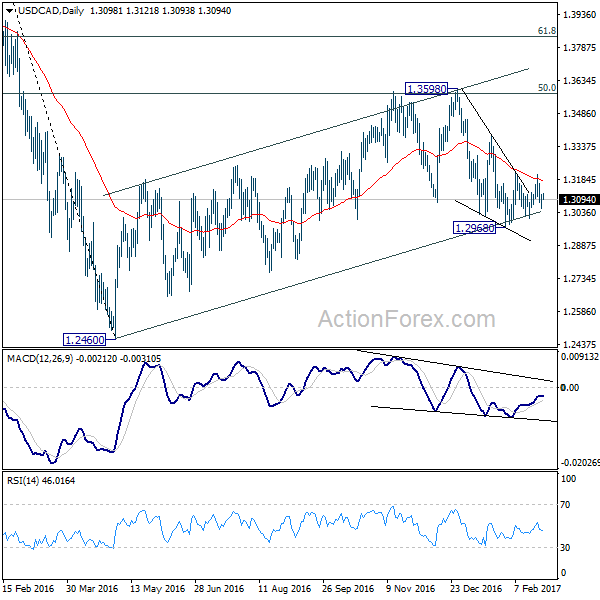
USD/CAD Daily Outlook
Daily Pivots: (S1) 1.3052; (P) 1.3085; (R1) 1.3128; More...
USD/CAD is staying in range of 1.2968/3211 and intraday bias remains neutral first. On the upside, break of 1.3211 resistance will argue that fall from 1.3598 has completed at 1.2968. And more importantly, rise from 1.2460 is still in progress. In that case, intraday bias will be turned back to the upside for 1.3598 and above. On the downside, below 1.2968 will revive the case that rise from 1.2460 is completed and turn outlook bearish for this low. Overall, choppy rise from 1.2460 is still seen as a corrective move.
In the bigger picture, price actions from 1.4689 medium term top are seen as a correction pattern. The first leg has completed at 1.2460. The second leg could be completed at 1.3598 and fall from there is tentatively seen as the third leg. Break of 1.2460 will target 50% retracement of 0.9460 to 1.4689 at 1.2075 before completing the correction. In case of another rise, we'd look for reversal signal above 61.8% retracement of 1.4689 to 1.2460 at 1.3838.
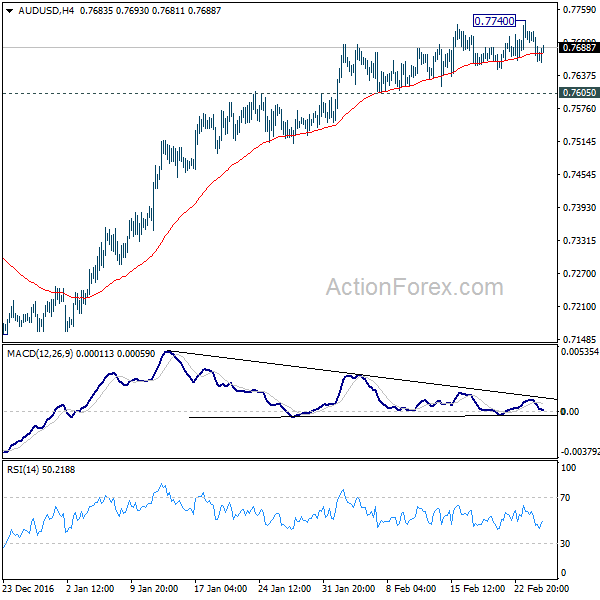
AUD/USD Daily Outlook
Daily Pivots: (S1) 0.7648; (P) 0.7684; (R1) 0.7703; More...
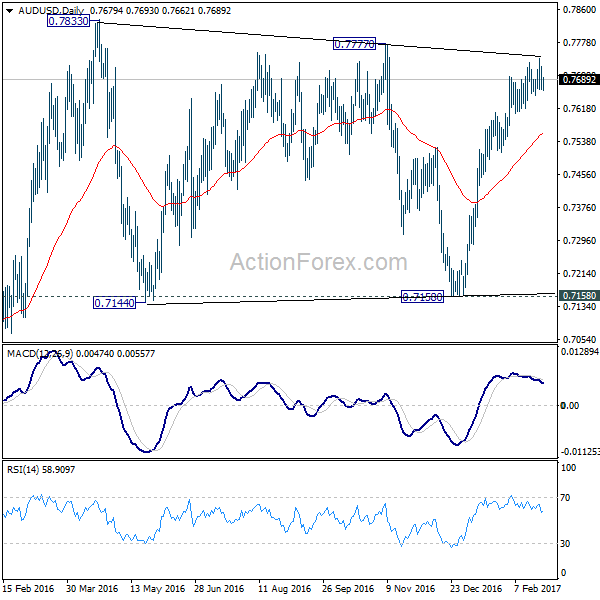
AUD/USD is staying in tight range of 0.7605/7740 and intraday bias remains neutral first. The pair continued to lose upside momentum as seen in bearish divergence condition in 4 hour MACD. In case of another rise, upside should be limited by 0.7777/7833 resistance zone and bring near term reversal. On the downside, break of 0.7605 support will indicate that rise from 0.7158 has completed already and turn bias back to the downside for 55 day EMA (now at 0.7560) first.
In the bigger picture, we're still treating price actions from 0.6826 low as a correction. And, as long as 38.2% retracement of 0.9504 to 0.6826 at 0.7849 holds, long term down trend from 1.1079 is expected to resume sooner or later. Break of 0.6826 low will target 0.6008 key support level. However, firm break of 0.7849 will indicate that rise from 0.6826 is developing into a medium term rebound, rather than a sideway pattern. In such case, stronger rise should be seek to 55 month EMA (now at 0.8186) and above.
USD/JPY Daily Outlook
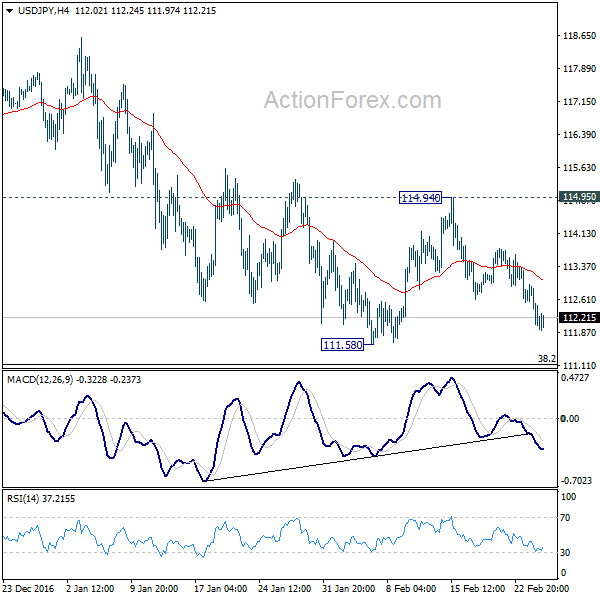
Daily Pivots: (S1) 111.70; (P) 112.33; (R1) 112.72; More...
USD/JPY is staying in range of 111.58/114.94 and intraday bias remains neutral first. The corrective fall from 1118.65 could extend lower. But we'd still expect strong support from 38.2% retracement of 98.97 to 118.65 at 111.13 to contain downside and bring rebound. On the upside, above 114.94 resistance should confirm completion of pull back from 118.65. In such case, intraday bias will be turned back to the upside for retesting 118.65.
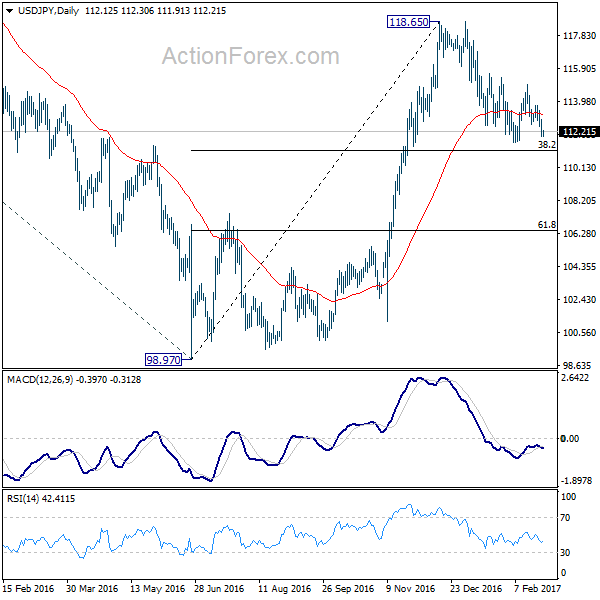
In the bigger picture, price actions from 125.85 high are seen as a corrective pattern. The impulsive structure of the rise from 98.97 suggests that the correction is completed and larger up trend is resuming. Decisive break of 125.85 will confirm and target 61.8% projection of 75.56 to 125.85 from 98.97 at 130.04 and then 135.20 long term resistance. Rejection from 125.85 and below will extend the consolidation with another falling leg before up trend resumption.