
Sample Category Title
Yen Jumped on Falling Yields and Risk Aversion, Euro Suffered
Yield treasury yield suffered sharp selloff on Friday. 30 year yield closed below 3.000 handle at 2.955, down -0.068. 10 year yield also lost -0.071 to close at 2.317 and carried near term bearish implications. Markets are getting increasing dissatisfied on the lack of progress from US president Donald Trump's administration regarding fiscal stimulus. There was no detail on the so called "phenomenal" tax reform yet. Instead, Trump just continued his attack on media, intelligence agencies and other countries like China. There were talks that Trump could eventually deliver virtually no fiscal stimulus that has an impact of this year's growth. All eyes will turn to his address to Congress on February 28. And reactions could be even more apparent if Trump fails to deliver anything concrete. Dollar also suffered and ended the week mixed.
10 year yield heading to 2.130
10 year yield's firm break of 55 day EMA and breach of 2.325 support last week dampened the triangle scenario. Instead, corrective move from 2.621 is now more likely to head lower to 38.2% retracement of 1.336 to 2.621 at 2.130 before completion. Such development would likely limit any rally attempt in the greenback.
Dollar index could dip through 99.23
Dollar index's rally attempt last week already failed below 101.76 near term resistance. Focus is now back on 100.41 minor support. Break there would likely extend the corrective fall from 103.82 through 99.23. And in that case, such correction is likely of larger degree and would probably target 95.88 support before completion.
Political worries persist in Europe
Yen, on the other hand, ended the week as the strongest major currency last week. Falling US yields was seen as a major factor. Risk aversion in Europe was another one. FTSE ended Friday down -27.67 pts or -0.38%, at 7243.70 after dipping to as low as 7192.45. DAX lost -143.8 pts, or -1.2% to close at 11804.03. CAC lost -46.05 pts, or -0.94%, to close at 4845.24. Investors were getting more concerned with political uncertainties with eyes on elections in France, the Netherlands and Germany. In particular, risk of Frexit would jump should far-right Marine Le Pen wind presidency. Euro and Swiss Franc ended the week as the weakest major currencies.
DAX might topped in near term
The sharp fall in DAX on Friday is rising the chance of near term reversal, on bearish divergence in daily MACD and RSI. A test on 55 day EMA (now at 11532.07) would likely be seen at least. But key level lies in 11479.78 support. Break there should confirm failure ahead of 12390.75 historical high and should turn near term outlook bearish for 108.27. Such development would likely drag EUR/JPY further lower.
To sell EUR/JPY as short term trade
Recapping the developments, there are downside risks in both US yield and European stocks. The uncertainty over French elections will not go away any time soon. And there are also risks that Trump would fail to deliver anything concrete. Hence, firstly, we'd expect some more upside in Yen in near term. Dollar, however, might have a mild upper against Euro due to resilience in US stocks. Thus, we'll try to sell EUR/JPY at market this week, with a stop at 119.90. 114.88 is the target for a short term trade. But we could get out of EUR/JPY earlier, depending on the development.
EUR/JPY Weekly Outlook
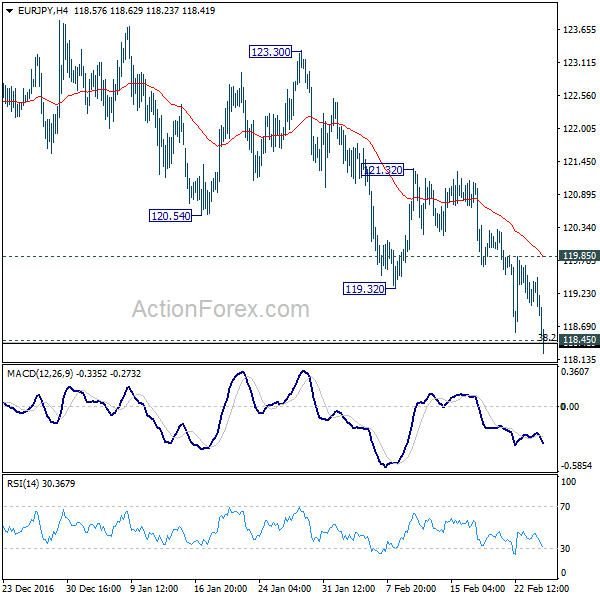
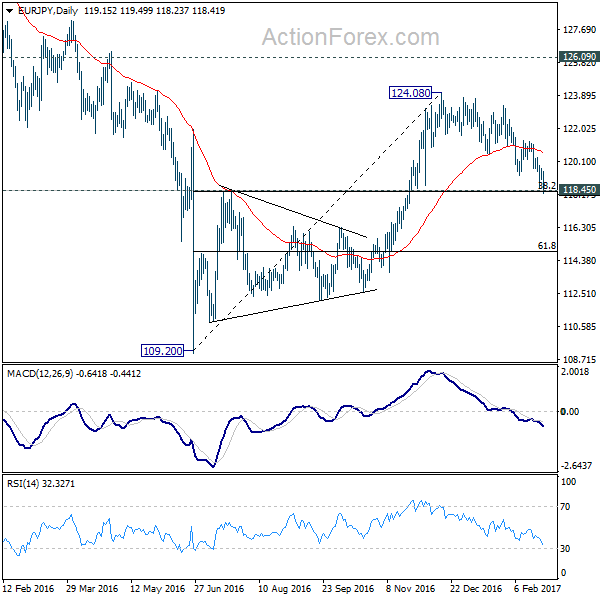
EUR/JPY's decline from 124.08 extended lower last week and breached 118.45 cluster support (38.2% retracement of 109.20 to 124.08 at 118.39). The development argues that whole rebound from 109.20 has completed at 124.08 already. Initial bias is mildly on the downside this week. Deeper fall would be seen to 61.8% retracement at 114.88 and below. On the upside, though, break of 119.85 minor resistance will indicate short term bottoming and turn bias back to the upside for 121.32 resistance instead.
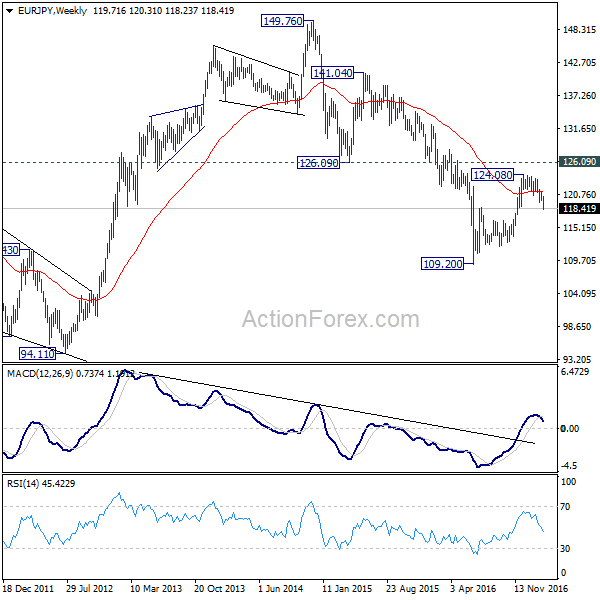
In the bigger picture, price actions from 109.20 medium term bottom are seen as part of a medium term corrective pattern from 149.76. Current development argues that it's completed at 124.08, ahead of 126.09 key resistance level. Deeper fall would be seen back to 109.20 low. Break there will extend the whole medium term down trend from 149.76 high.
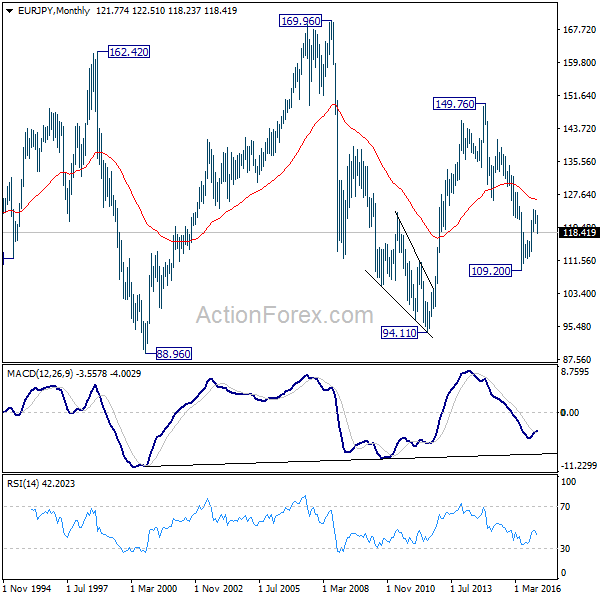
In the long term picture, medium term decline from 149.76 is seen as part of a long term sideway pattern from 88.96. Decisive break of 126.09 will indicate that such decline is completed and EUR/JPY has started another medium term rally already. Before that, deeper fall is mildly in favor towards 94.11 low.
EUR/USD Weekly Outlook
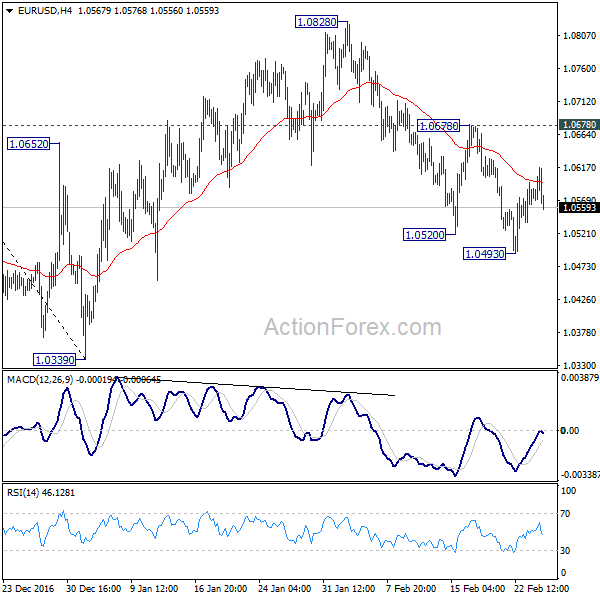
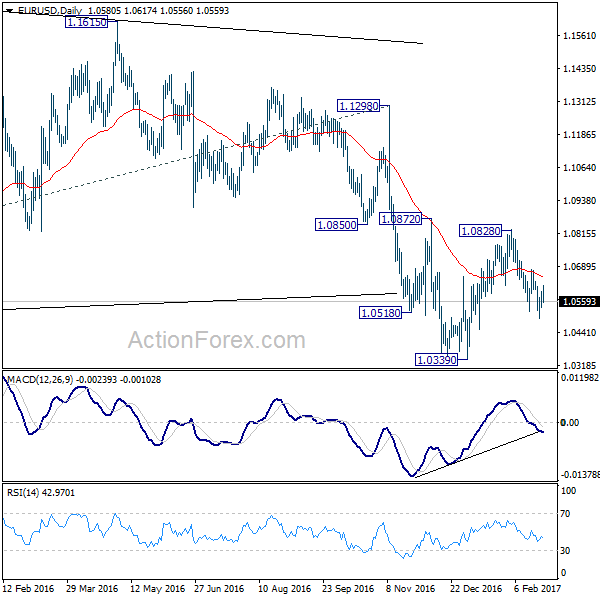
EUR/USD dipped to 1.0493 last week but quickly recovered. Initial bias remains neutral this week first. Though, with 1.0713 minor resistance intact, deeper decline is still expected. We're viewing fall from 1.0828 as resuming the larger down trend. Below 1.0493 will target 1.0339 low first. Break will confirm our bearish view and target parity. However, break of 1.0678 will dampen our view and turn focus back to 1.0828 resistance instead.
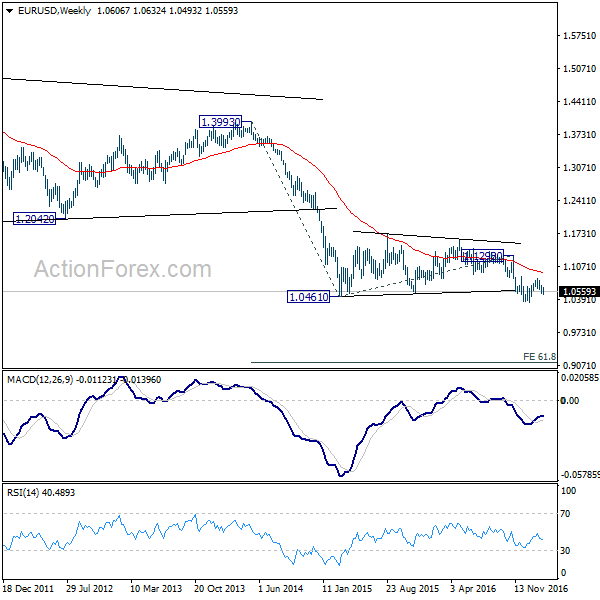
In the bigger picture, whole down trend from 1.6039 (2008 high) is in progress. Such down trend is expected to extend to 61.8% projection of 1.3993 to 1.0461 from 1.1298 at 0.9115. On the upside, break of 1.1298 resistance is needed to confirm medium term bottoming. Otherwise, outlook will stay bearish in case of rebound.
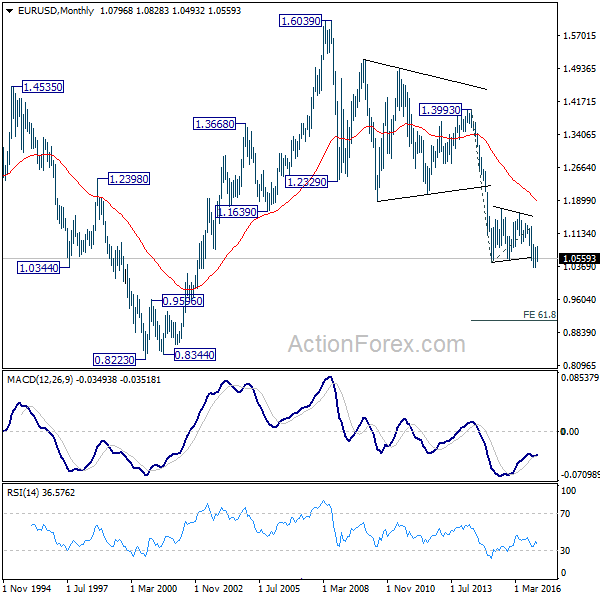
In the long term picture, the down trend from 1.6039 (2008 high) is still in progress and there is no clear sign of completion. We'd expect more downside towards 0.8223 (2000 low) as long as 1.1298 resistance holds.
Subscribe to our daily and mid-day newsletter to get this report delivered to your mail box
USD/JPY Weekly Outlook
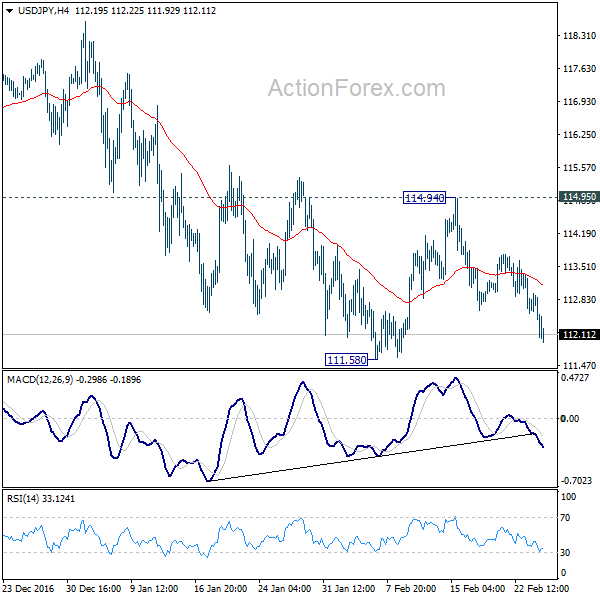
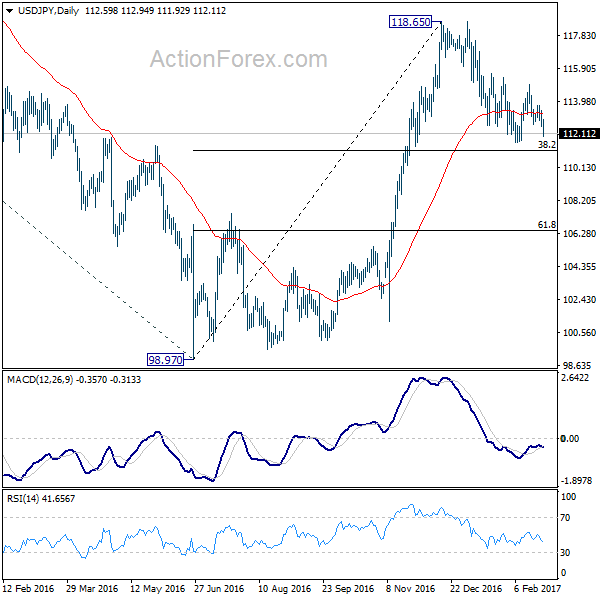
USD/JPY gyrated lower last week but stayed above 111.58 low. Initial bias remains neutral this week first. The corrective fall from 1118.65 could extend lower. But we'd still expect strong support from 38.2% retracement of 98.97 to 118.65 at 111.13 to contain downside and bring rebound. On the upside, above 114.94 resistance should confirm completion of pull back from 118.65. In such case, intraday bias will be turned back to the upside for retesting 118.65.
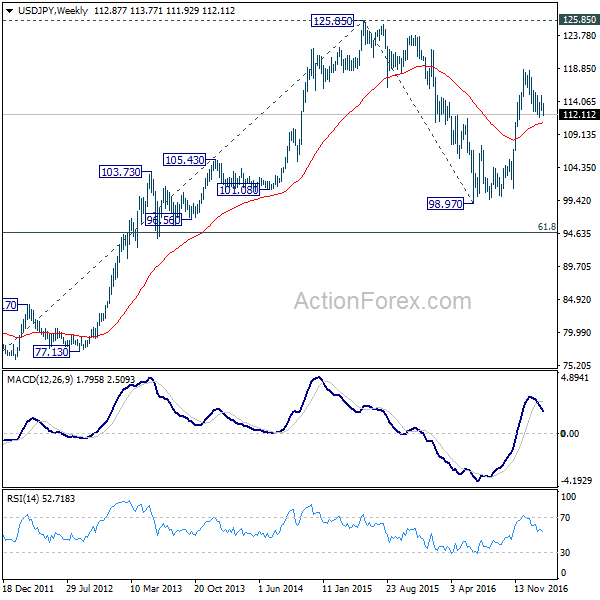
In the bigger picture, price actions from 125.85 high are seen as a corrective pattern. The impulsive structure of the rise from 98.97 suggests that the correction is completed and larger up trend is resuming. Decisive break of 125.85 will confirm and target 61.8% projection of 75.56 to 125.85 from 98.97 at 130.04 and then 135.20 long term resistance. Rejection from 125.85 and below will extend the consolidation with another falling leg before up trend resumption.
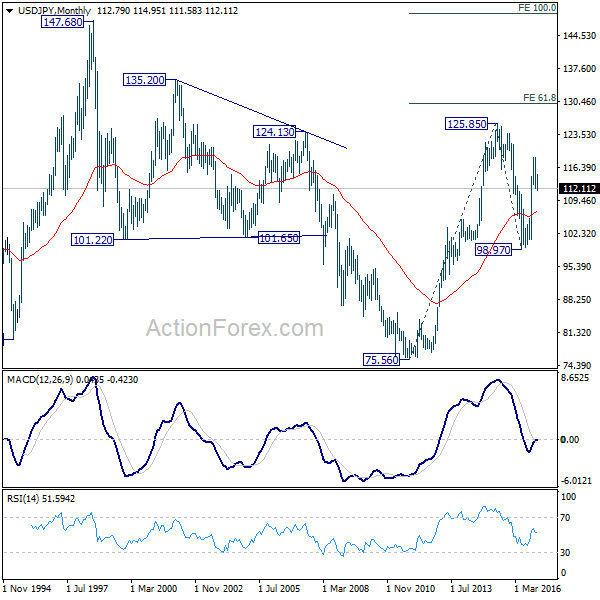
In the long term picture, the rise from 75.56 long term bottom to 125.85 medium term top is viewed as an impulsive move. Price actions from 125.85 are seen as a corrective move which could still extend. But, up trend from 75.56 is expected to resume at a later stage for above 135.20/147.68 resistance zone.
Subscribe to our daily and mid-day newsletter to get this report delivered to your mail box
GBP/USD Weekly Outlook
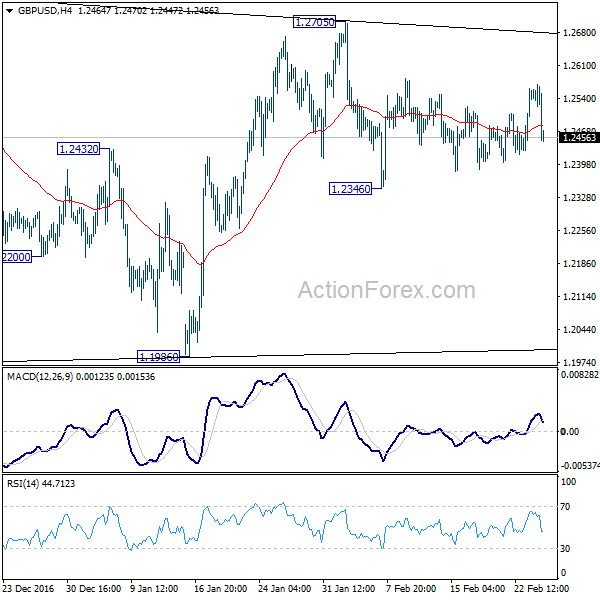
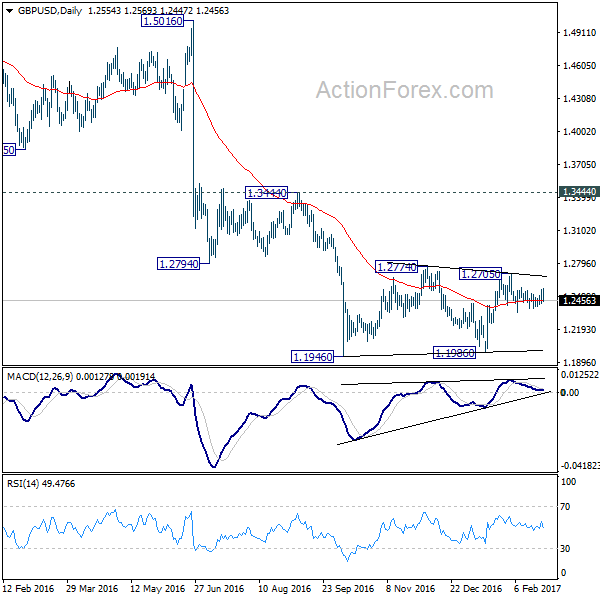
GBP/USD remained bounded in range of 1.2346/2705 last week. Initial bias remains neutral this week first. Price actions from 1.1946 are viewed as a consolidation pattern, with rise from 1.1986 as the third leg. In case of another rise, we'd expect upside to be limited by 1.2774 to bring larger down trend resumption. On the downside, below 1.2346 will revive the case that such consolidation is completed at 1.2705 already. In that case, intraday bias will turn back to the downside for retesting 1.1946 low.
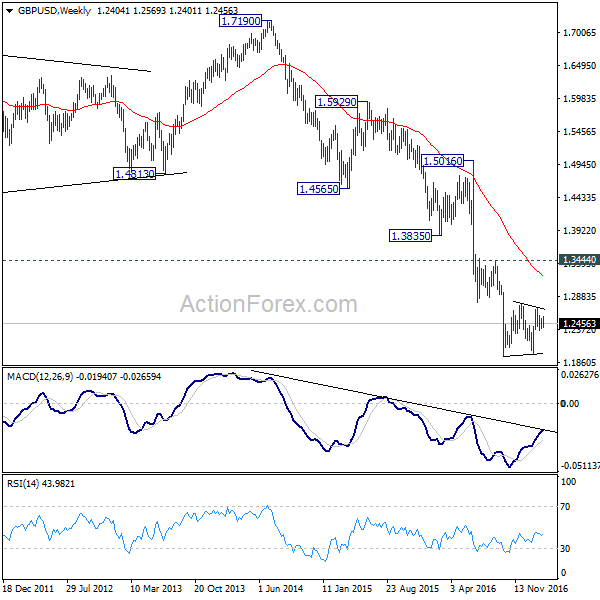
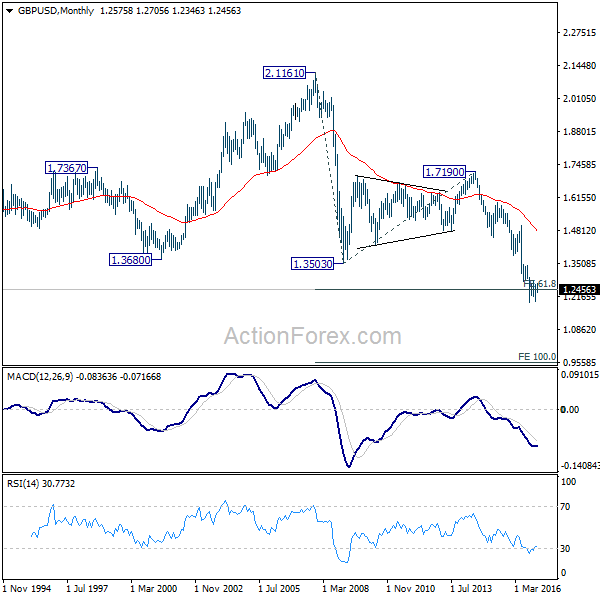
In the bigger picture, fall from 1.7190 is seen as part of the down trend from 2.1161. There is no sign of medium term bottoming yet. Sustained trading below 61.8% projection of 2.1161 to 1.3503 from 1.7190 at 1.2457 will target 100% projection at 0.9532. Overall, break of 1.3444 resistance is needed to confirm medium term bottoming. Otherwise, outlook will remain bearish.
In the longer term picture, no change in the view that down trend from 2.1161 is still in progress. Current momentum suggests that the down trend will go deeper than originally expected.
Subscribe to our daily and mid-day newsletter to get this report delivered to your mail box
USD/CHF Weekly Outlook
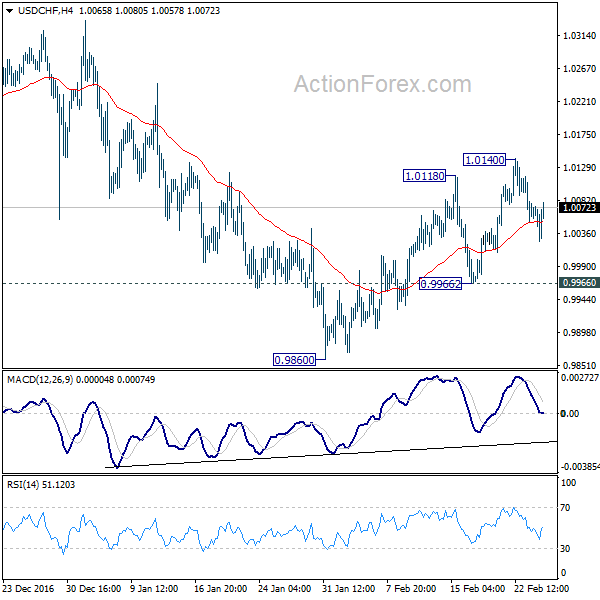
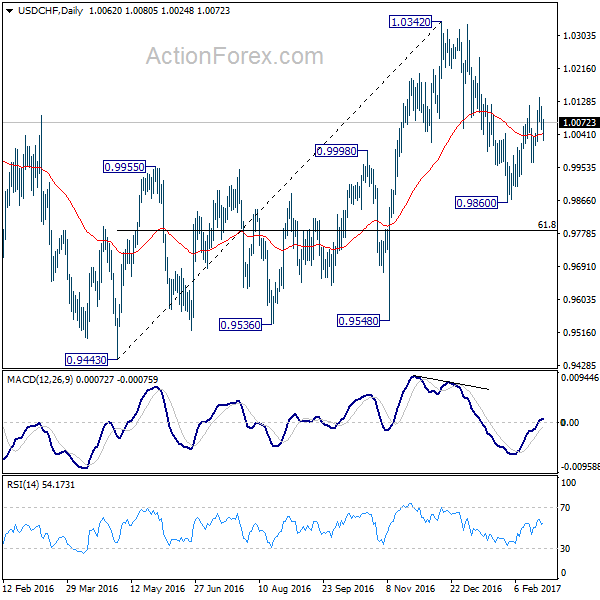
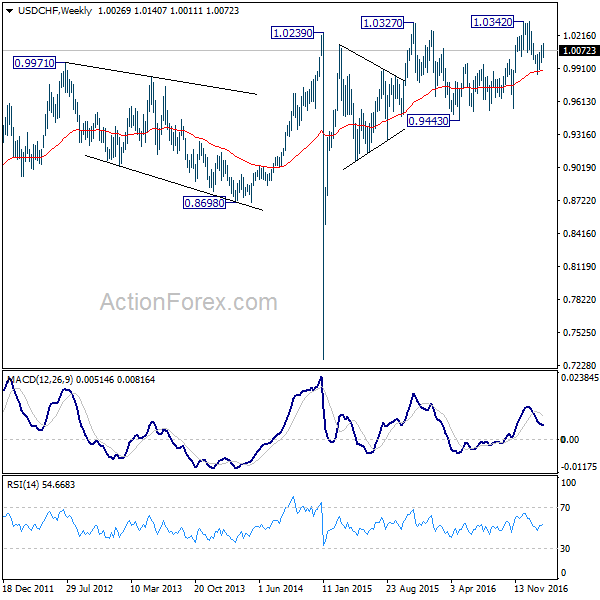
USD/CHF edged higher to 1.0140 last week but quickly retreated. Initial bias remains neutral this week first. Nonetheless, with 0.9966 support intact, further rise is in favor. Above 1.0140 will turn bias to the upside and target a test on 1.0342 resistance. Based on neutral medium term outlook, we'd be cautious on topping at around 1.0342. Meanwhile, break of 0.9966 will indicate completion of the rebound from 0.9860. And intraday bias will be turned back to the downside for 0.9860.
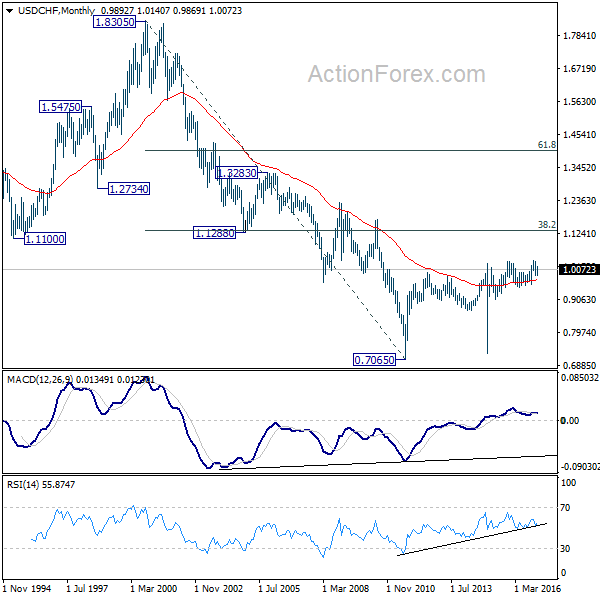
In the bigger picture, prior rejection from 1.0327 resistance argues that USD/CHF is staying in a medium term sideway pattern. In any case, decisive break of 1.0342 resistance is needed to confirm underlying strength. Otherwise, we'll stay neutral in the pair first. In case of another fall, we'd expect strong support from 0.9443/9548 support zone. Meanwhile firm break of 1.0342 will target 38.2% retracement of 1.8305 to 0.7065 at 1.1359.
Subscribe to our daily and mid-day newsletter to get this report delivered to your mail box
AUD/USD Weekly Outlook
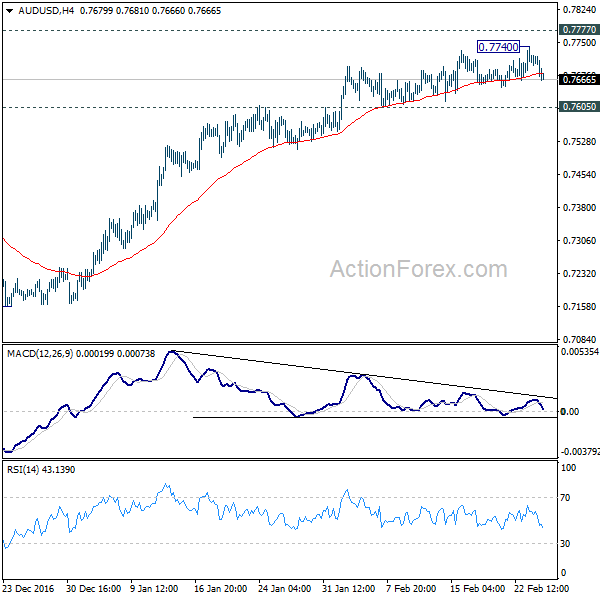
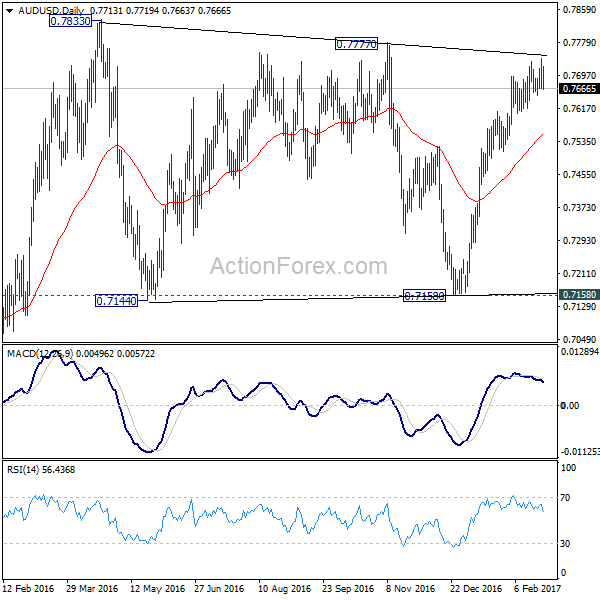
AUD/USD edged higher to 0.7740 last week but quickly retreated. Initial bias stays neutral this week first. The pair continued to lose upside momentum as seen in bearish divergence condition in 4 hour MACD. In case of another rise, upside should be limited by 0.7777/7833 resistance zone and bring near term reversal. On the downside, break of 0.7605 support will indicate that rise from 0.7158 has completed already and turn bias back to the downside for 55 day EMA (now at 0.7551) first.
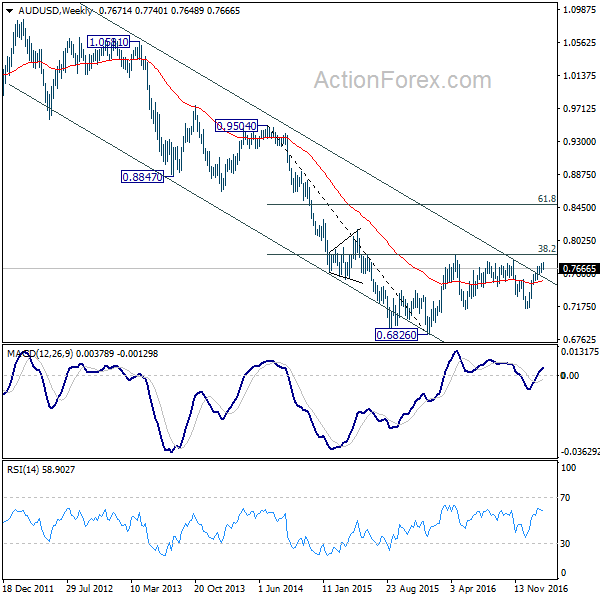
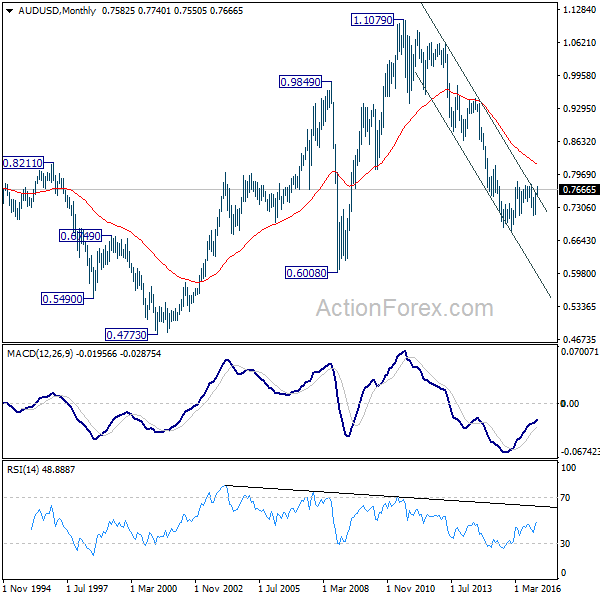
In the bigger picture, we're still treating price actions from 0.6826 low as a correction. And, as long as 38.2% retracement of 0.9504 to 0.6826 at 0.7849 holds, long term down trend from 1.1079 is expected to resume sooner or later. Break of 0.6826 low will target 0.6008 key support level. However, firm break of 0.7849 will indicate that rise from 0.6826 is developing into a medium term rebound, rather than a sideway pattern. In such case, stronger rise should be seek to 55 month EMA (now at 0.8186) and above.
In the longer term picture, while the down trend from 1.1079 might extend lower, we're not anticipating a break of 0.6008 (2008 low) yet. We'll look for bottoming above there to reverse the medium term trend.
Subscribe to our daily and mid-day newsletter to get this report delivered to your mail box
USD/CAD Weekly Outlook
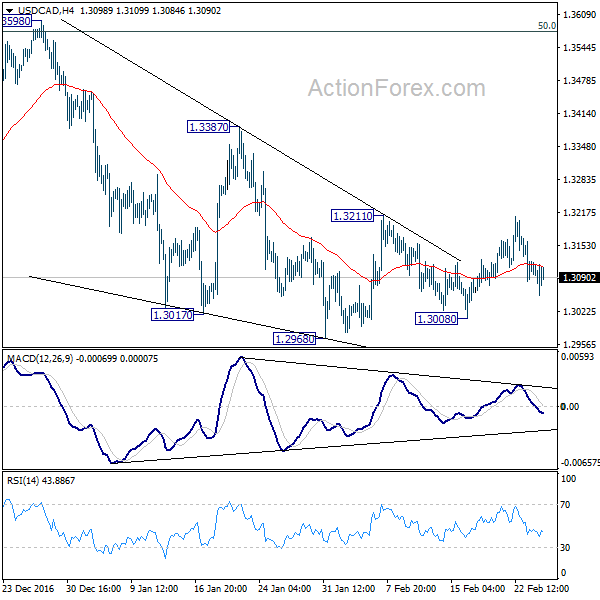
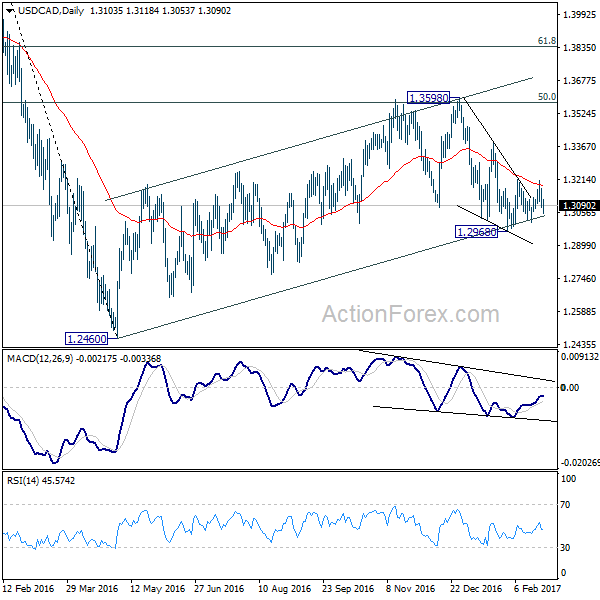
USD/CAD stayed in range of 1.2968/3211 last week and outlook remains mixed. Initial bias stays neutral this week first. On the upside, break of 1.3211 resistance will argue that fall from 1.3598 has completed at 1.2968. And more importantly, rise from 1.2460 is still in progress. In that case, intraday bias will be turned back to the upside for 1.3598 and above. On the downside, below 1.2968 will revive the case that rise from 1.2460 is completed and turn outlook bearish for this low. Overall, choppy rise from 1.2460 is still seen as a corrective move.
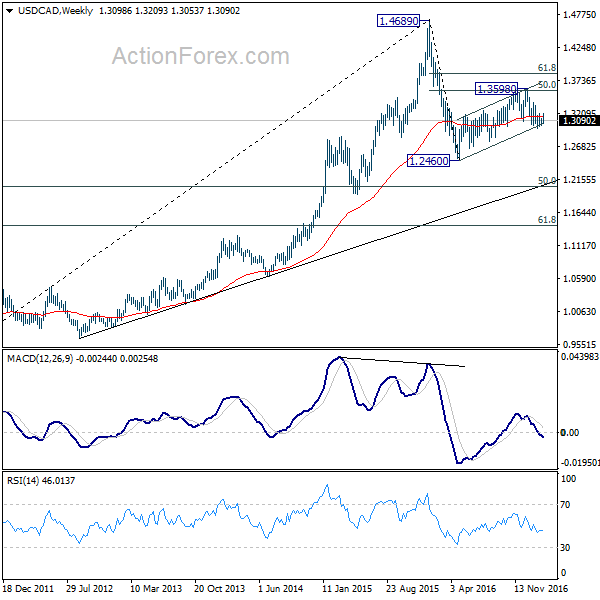
In the bigger picture, price actions from 1.4689 medium term top are seen as a correction pattern. The first leg has completed at 1.2460. The second leg could be completed at 1.3598 and fall from there is tentatively seen as the third leg. Break of 1.2460 will target 50% retracement of 0.9460 to 1.4689 at 1.2075 before completing the correction. In case of another rise, we'd look for reversal signal above 61.8% retracement of 1.4689 to 1.2460 at 1.3838.
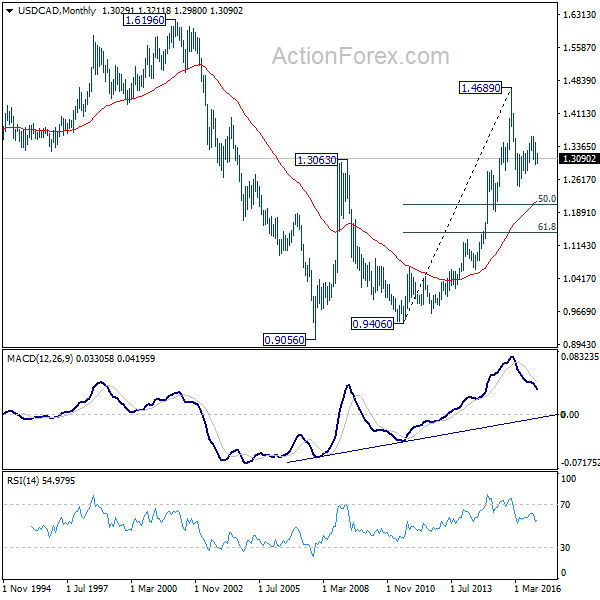
In the longer term picture, rise from 0.9056 (2007 low) is viewed as a long term up trend. It's taking a breath after hitting 1.4689. But such rise expected to resume later to test 1.6196 down the road.
Subscribe to our daily and mid-day newsletter to get this report delivered to your mail box
GBP/JPY Weekly Outlook
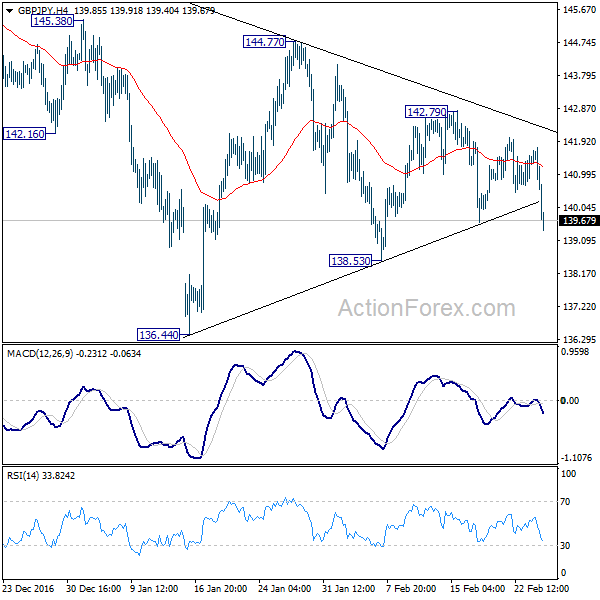
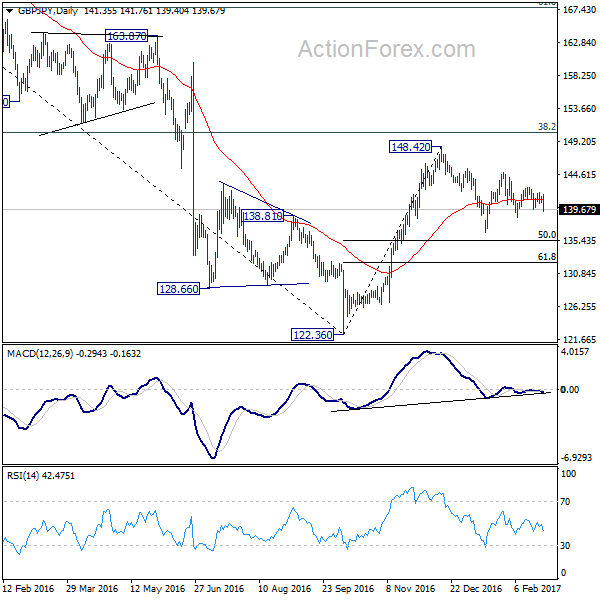
GBP/JPY weakened mildly last week but stayed in range of 138.53/142.79. Initial bias remains neutral this week first. Overall, price actions from 148.42 are seen as a corrective pattern. Below 138.53 will bring deeper fall, possibly through 136.44 support. But strong support could be seen at 50% retracement of 122.36 to 148.42 at 135.39 to bring rebound. Above 142.79 will turn bias back to the upside for 144.77 and above.
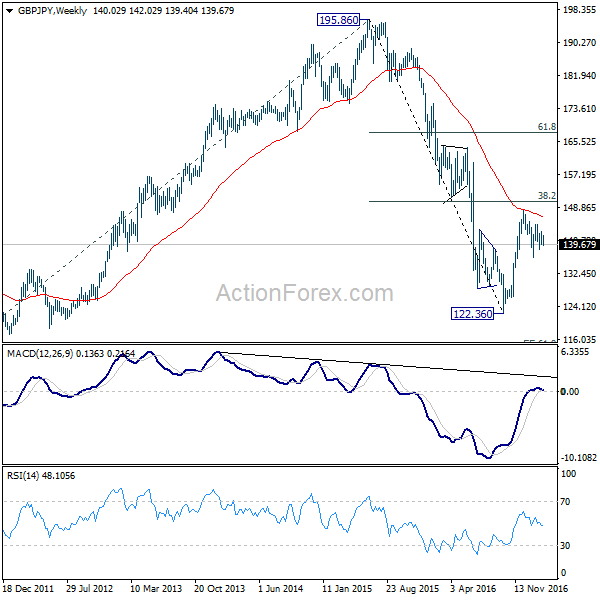
In the bigger picture, price actions from 122.36 medium term bottom are still seen as a corrective pattern. Main focus is on 38.2% retracement of 195.86 to 122.36 at 150.42. Rejection from there will turn the cross into medium term sideway pattern with a test on 122.36 low next. Though, sustained break of 150.42 will extend the rebound towards 61.8% retracement at 167.78.
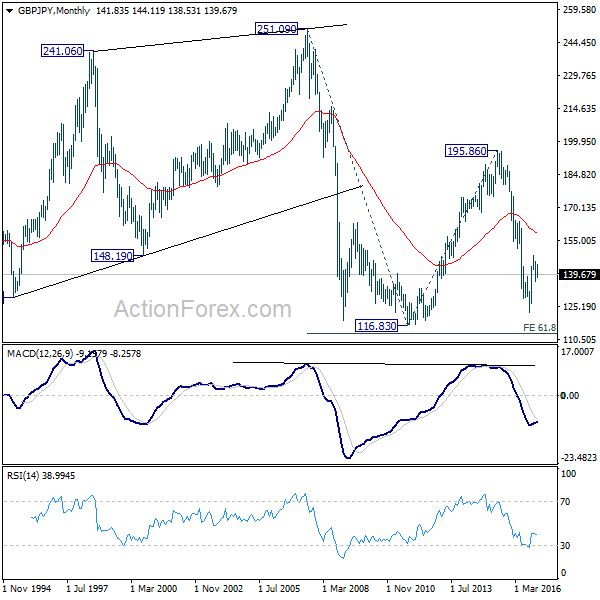
In the longer term picture, while price actions from 122.36 would develop into a medium term correction, fall from 195.86 is still seen as resuming the down trend from 251.09 (2007 high). Hence, after the correction from 122.36 completes we'd expect another fall through 116.83 low.
Subscribe to our daily and mid-day newsletter to get this report delivered to your mail box
EUR/JPY Weekly Outlook
EUR/JPY's decline from 124.08 extended lower last week and breached 118.45 cluster support (38.2% retracement of 109.20 to 124.08 at 118.39). The development argues that whole rebound from 109.20 has completed at 124.08 already. Initial bias is mildly on the downside this week. Deeper fall would be seen to 61.8% retracement at 114.88 and below. On the upside, though, break of 119.85 minor resistance will indicate short term bottoming and turn bias back to the upside for 121.32 resistance instead.
In the bigger picture, price actions from 109.20 medium term bottom are seen as part of a medium term corrective pattern from 149.76. Current development argues that it's completed at 124.08, ahead of 126.09 key resistance level. Deeper fall would be seen back to 109.20 low. Break there will extend the whole medium term down trend from 149.76 high.
In the long term picture, medium term decline from 149.76 is seen as part of a long term sideway pattern from 88.96. Decisive break of 126.09 will indicate that such decline is completed and EUR/JPY has started another medium term rally already. Before that, deeper fall is mildly in favor towards 94.11 low.
Subscribe to our daily and mid-day newsletter to get this report delivered to your mail box
EUR/GBP Weekly Outlook
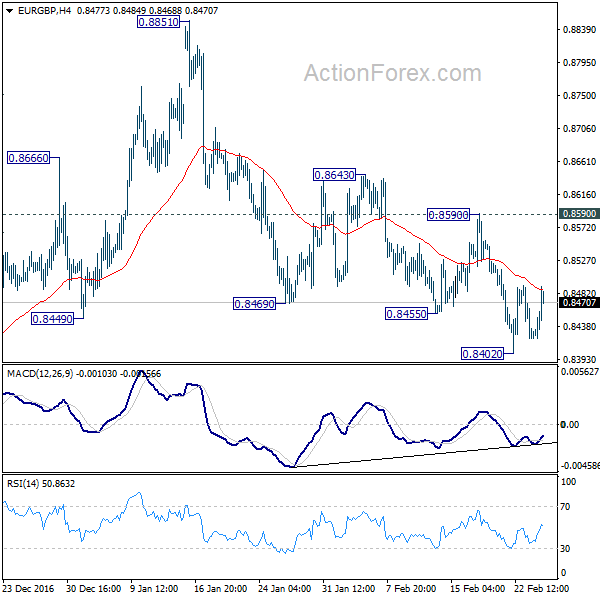
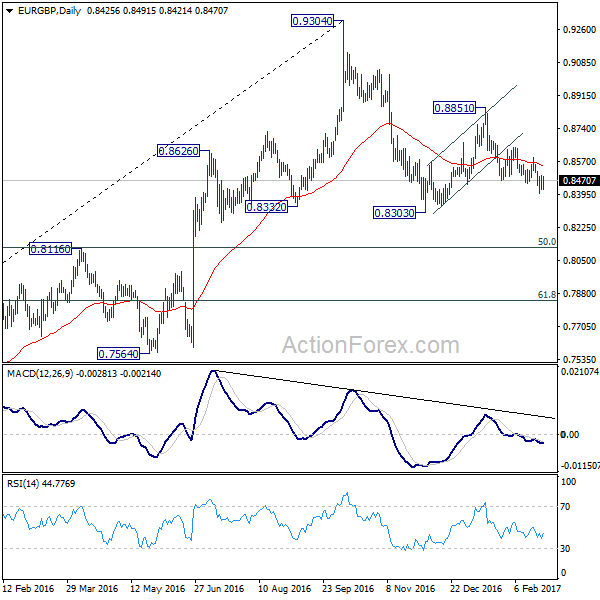
EUR/GBP dipped to 0.8402 last week but recovered. Initial bias stays neutral this week first. Nonetheless, with 0.8590 resistance intact, we're holding on to our bearish view. That is, fall from 0.8851 is the third leg of the whole corrective pattern from 0.9304. Below 0.8402 will turn bias to the downside for 0.8303 first. Break will confirm our bearish view and target 0.8116 key cluster support level. However, on the upside, break of 0.8590 resistance will dampen our view and turn bias back to the upside.
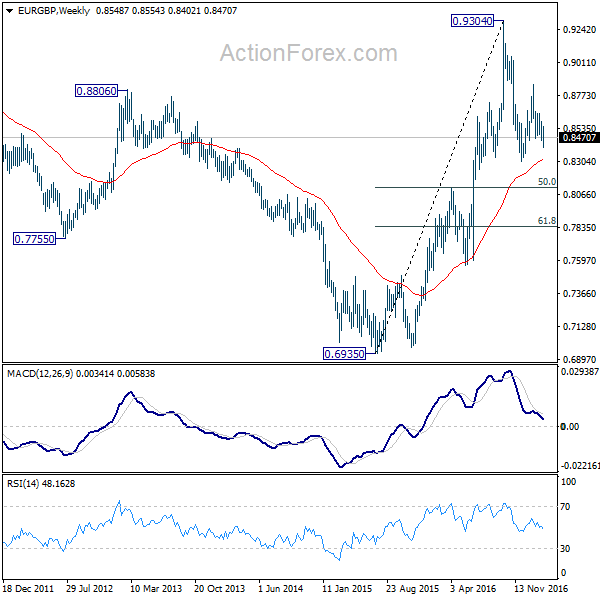
In the bigger picture, price actions from 0.9304 are viewed as a medium term corrective pattern. Deeper fall cannot be ruled out yet. But we'd expect strong support from 0.8116 cluster support (50% retracement of 0.6935 to 0.9304 at 0.8120) to contain downside. Overall, the corrective pattern would take some time to complete before long term up trend resumes at a later stage. Break of 0.9304 will pave the way to 0.9799 (2008 high).
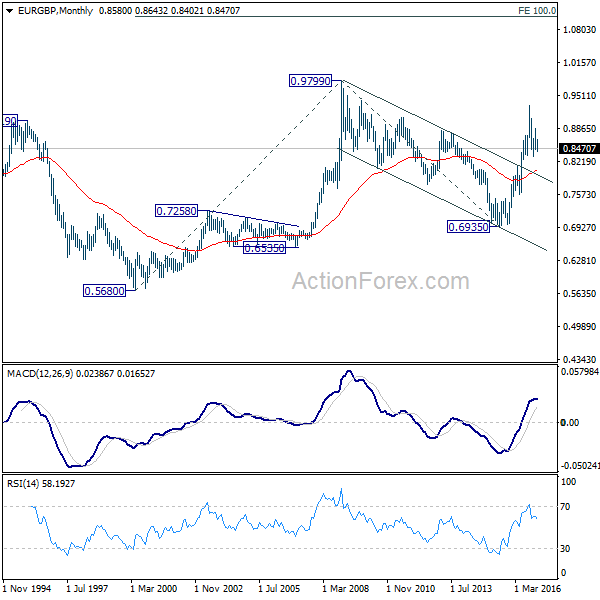
In the long term picture, firstly, price action from 0.9799 is seen as a long term corrective pattern and should have completed at 0.6935. Secondly, rise from 0.6935 is likely resuming up trend from 0.5680 (2000 low). Thirdly, this is supported by the impulsive structure of the rise from 0.6935 to 0.9304. Hence, after the consolidation from 0.9304 completes, we'd expect another medium term up trend to target 0.9799 high and above.
Subscribe to our daily and mid-day newsletter to get this report delivered to your mail box