
Sample Category Title
GBP/USD Daily Outlook
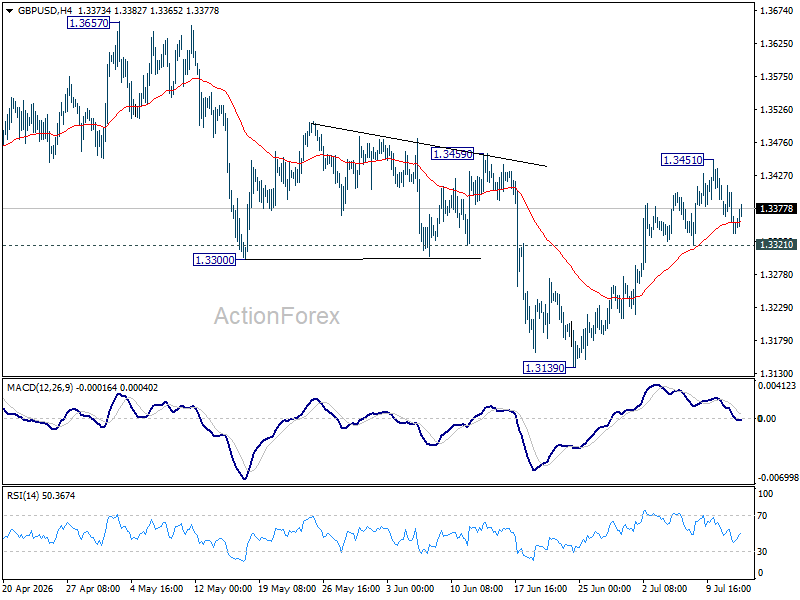
Intraday bias in GBP/USD stays neutral for consolidations below 1.3451. On the upside, firm break of 1.3459 will argue that whole correction from 1.3867 has completed, and target 1.3657 resistance for confirmation. On the downside, break of 1.3451 will turn bias back to the downside for 1.3139 support instead.
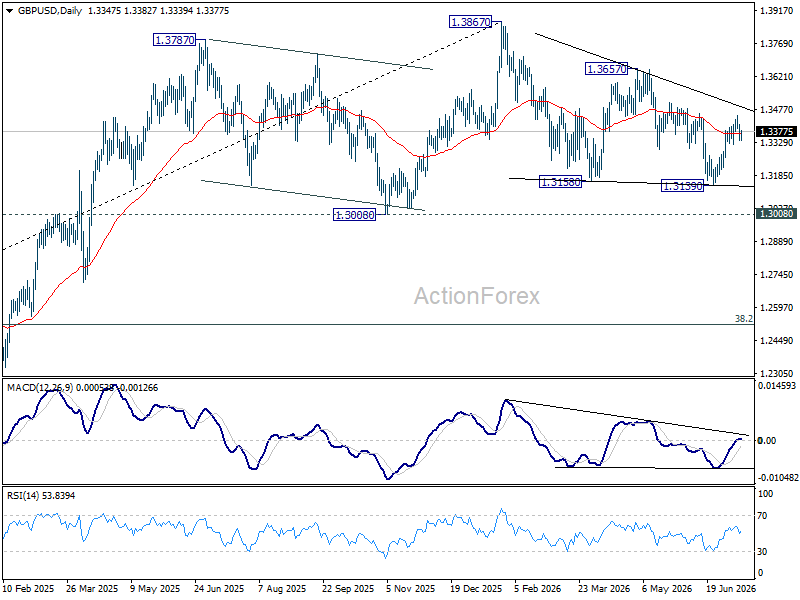
In the bigger picture, price actions from 1.3867 are a corrective pattern within the broader up trend from 1.0351 (2022 low). With 1.3008 support intact, medium term bullishness is maintained and break of 1.3867 is in favor for a later stage, towards 1.4248 key resistance (2021 high). However, firm break of 1.3008 will at least bring deeper fall to 38.2% retracement of 1.0351 to 1.3867 at 1.2524, with increased risk of bearish reversal.
USD/CHF Daily Outlook
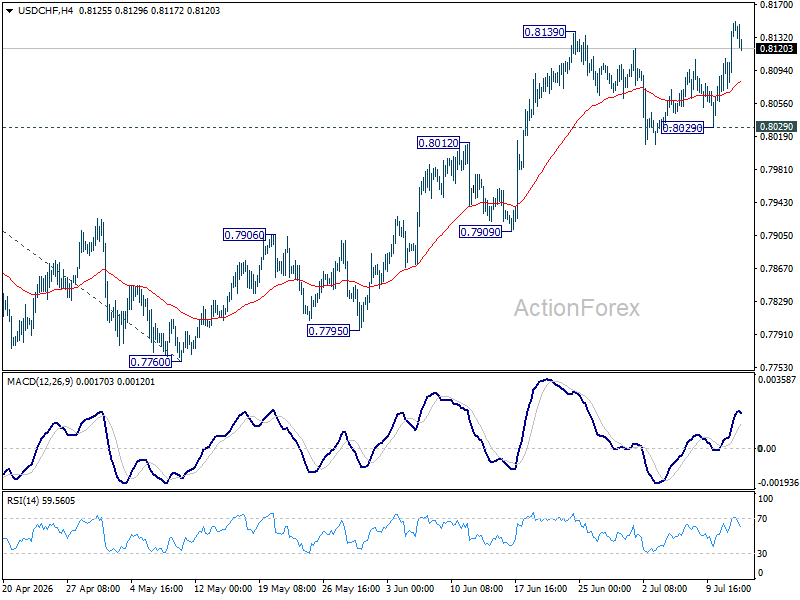
USD/CHF's rally is resuming by breaching 0.8139 resistance. Intraday bias is back on the upside. Current rise from 0.7760 should target 100% projection 0.7603 to 0.8041 from 0.7600 at 0.8198 next. For now, outlook will remain bullish as long as 0.8029 support holds, in case of retreat.
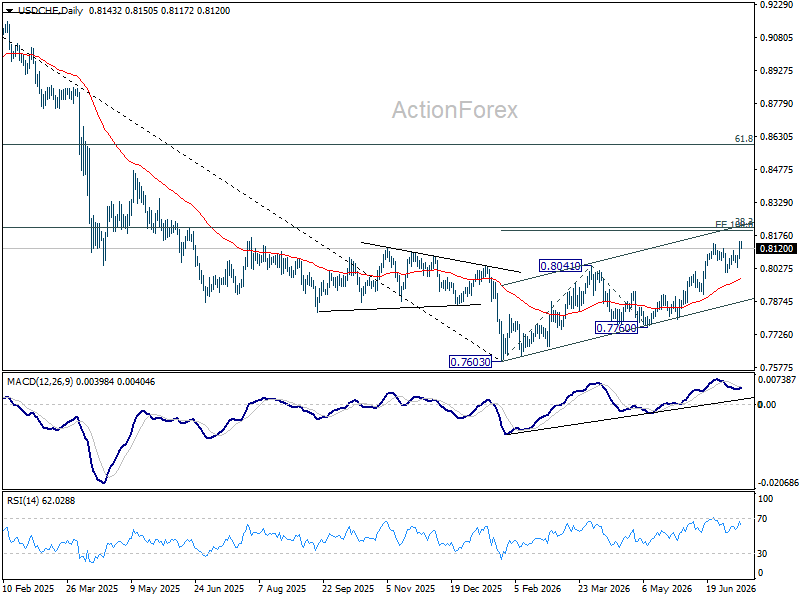
In the bigger picture, while a medium term bottom was formed at 0.7603, it's still early to call for bullish trend reversal. As long as 38.2% retracement of 0.9200 (2025 high) to 0.7603 at 0.8213 holds, the larger down trend could still continue through 0.7603 at a later stage. However, firm break of 0.7603 will argue that the trend has reversed and turn focus to 0.8332 support turned resistance (2023 low) for confirmation.
AUD/USD Daily Report
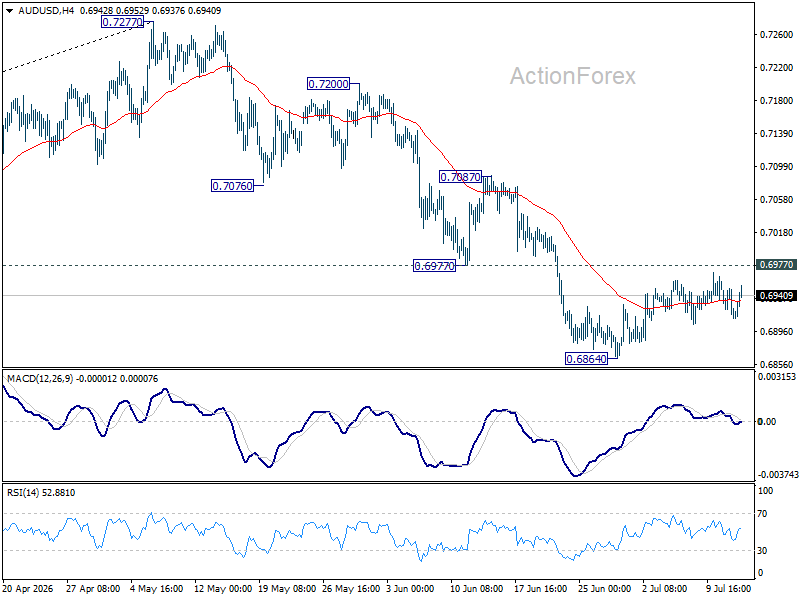
AUD/USD is extending consolidations above 0.6864 and intraday bias stays neutral. Further fall is expected as long as 0.6977 support turned resistance holds. Below 0.6864 will target 0.6832 support. Firm break there will target 0.6756 fibonacci level. However, sustained break of 0.6977 will bring stronger rebound to 0.7087 resistance instead.
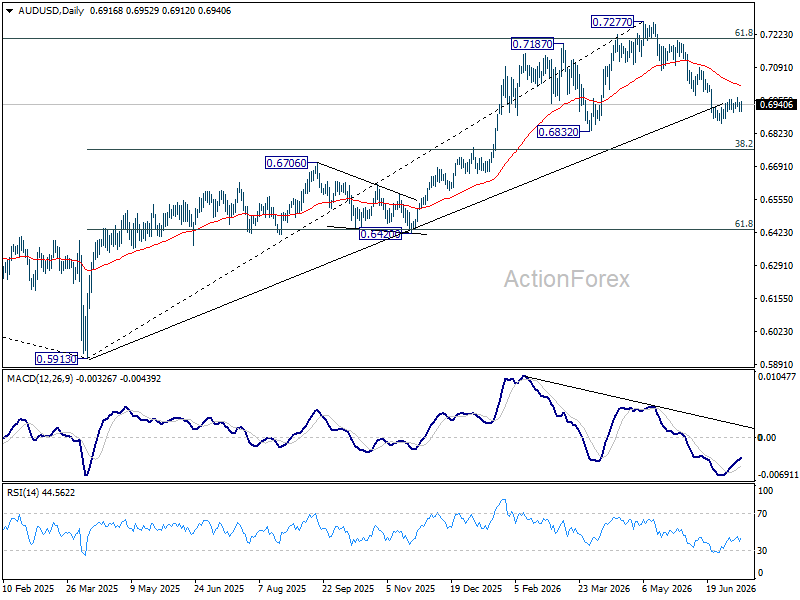
In the bigger picture, considering bearish divergence condition in D MACD, a medium term top could be formed at 0.7277 after failing to sustain above 61.8% retracement of 0.8006 (2021 high) to 0.5913 (2024 low) at 0.7206. Deeper fall could be seen to 38.2% retracement of 0.5913 to 0.7277 at 0.6756 as a correction. But strong support should be seen there to bring rebound. Consolidations would continue below 0.7277 for a while.
USD/CAD Daily Outlook
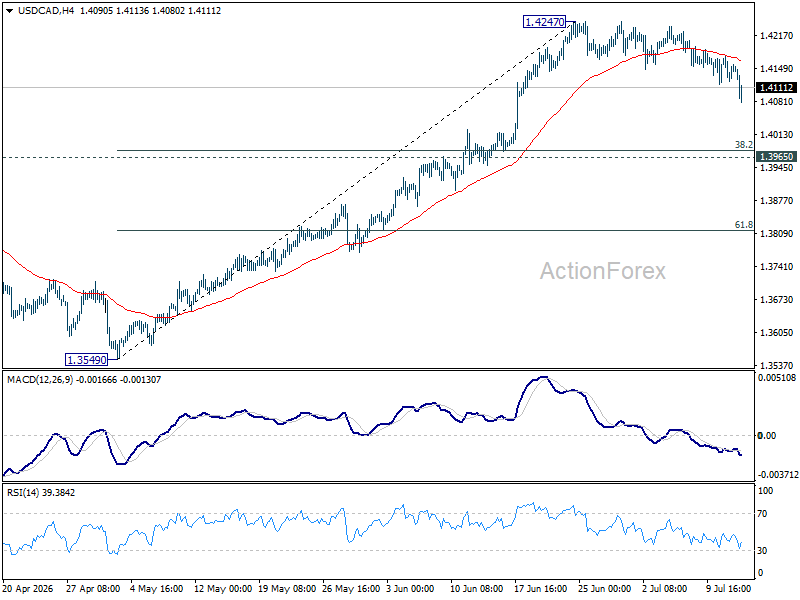
USD/CAD's consolidations from 1.4247 continue and intraday bias remains neutral. Deeper pullback cannot be ruled out. But downside should be contained above 1.3965 resistance turned support. Above 1.4247 will resume the rally from 1.3480 to 61.8% retracement of 1.4791 to 1.3480 at 1.4290. Firm break there will pave the way back to 1.4791 high.
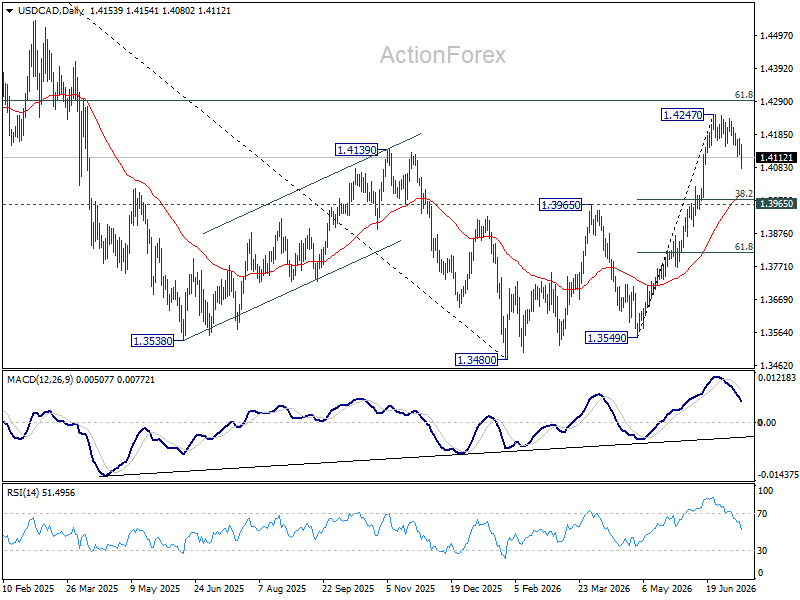
In the bigger picture, current development suggests that fall from 1.4791 has completed as a three wave correction to 1.3480. It's still early to judge if rise from there a corrective bounce, or resumption of the larger up trend from 1.2005 (2021 low). But in either case, retest of 1.4791 high should be seen next.
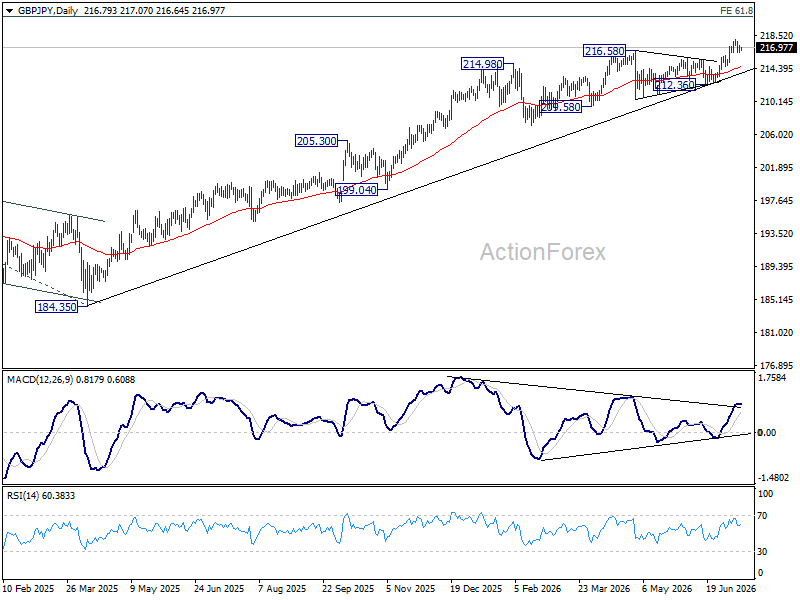
GBP/JPY Daily Outlook
GBP/JPY is staying in consolidations below 217.99 and intraday bias remains neutral. Further rally is expected as long as 214.69 support holds. On the upside, above 217.99 will target 220.90 fibonacci projection level next.
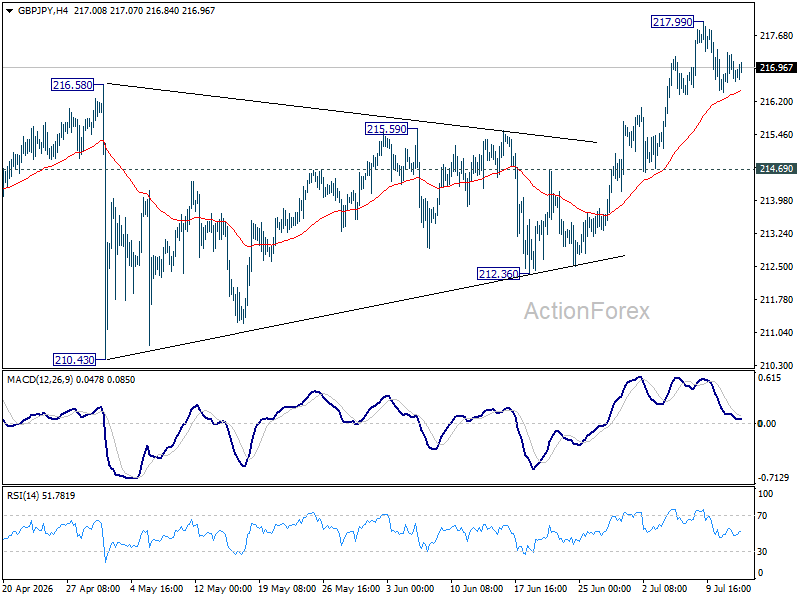
In the bigger picture, the long term up trend is in progress. Next target is 61.8% projection of 148.93 (2022 low) to 208.09 (2024 high) from 184.35 at 220.90. For now, outlook will remain bullish as long as 55 W EMA (now at 208.22) holds, in case of pullback.
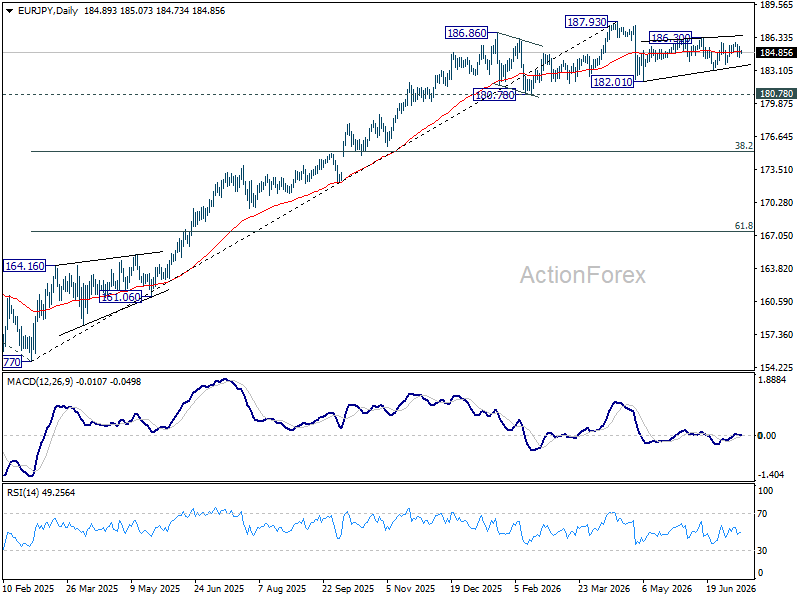
EUR/JPY Daily Outlook
Sideway trading continues in EUR/JPY and intraday bias remains neutral for the moment. On the upside, firm break of 186.30 will resume the rebound from 182.10 towards 187.93 high. On the downside, break of 183.14 will bring deeper fall to retest 182.10.
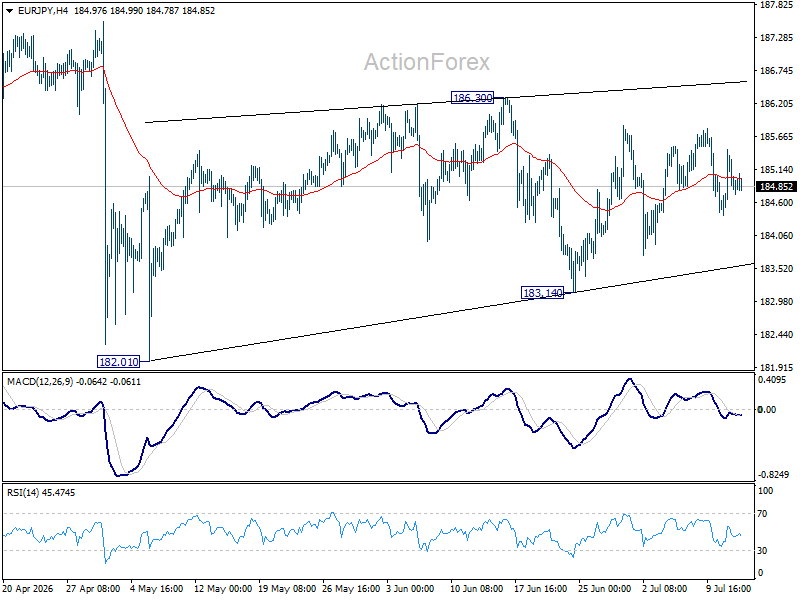
In the bigger picture, there is no sign of reversal yet. Uptrend from 114.42 (2020 low) is still expected to resume at a later stage to 78.6% projection of 124.37 (2022 low) to 175.41 (2025 high) from 154.77 at 194.88. However, sustained break of 55 W EMA (now at 179.93) will argue that it's already in a medium term down trend to 175.41 resistance turned support and below.
EUR/GBP Daily Outlook
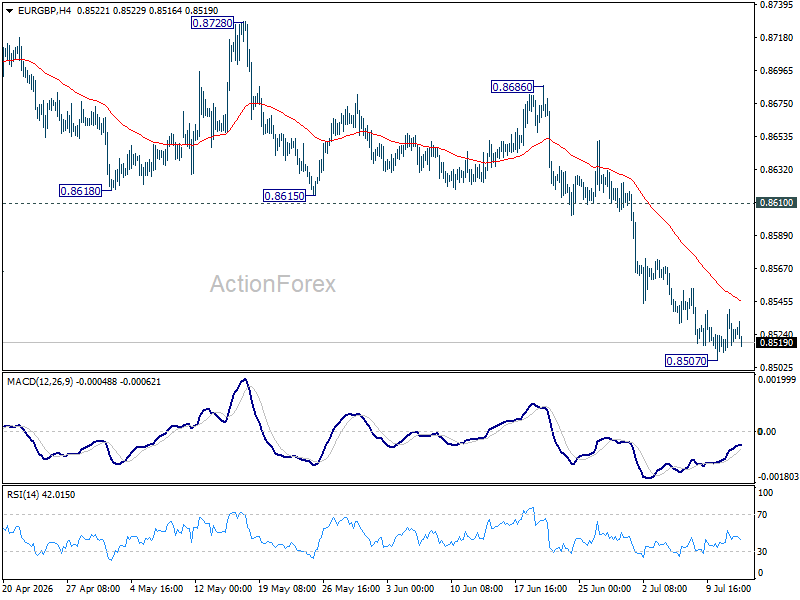
Intraday bias in EUR/GBP remains neutral as consolidations continue above 0.8507. Upside should be limited below 0.8610 support turned resistance to bring another fall. Below 0.8507 will resume larger down trend to 61.8% retracement of 0.8221 to 0.8863 at 0.8466.
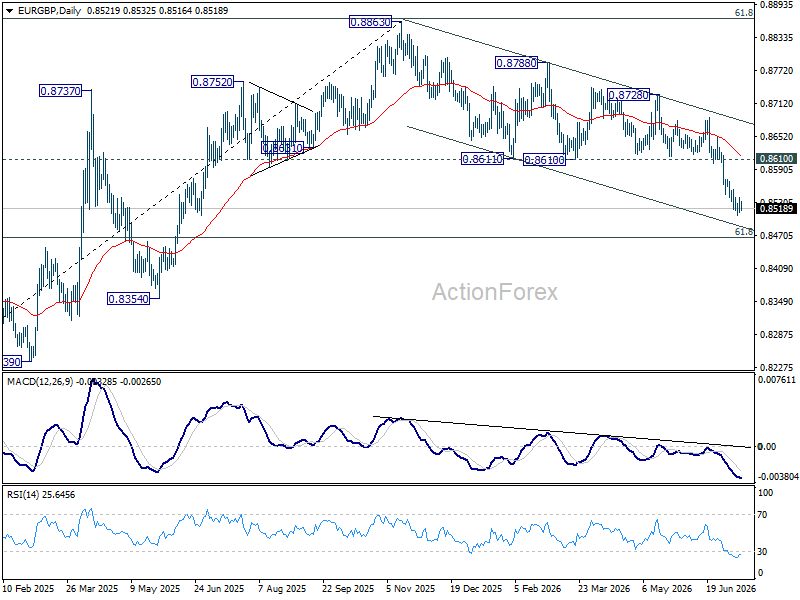
In the bigger picture, current development suggests that rise from 0.8221 (2024 low) has completed at 0.8863, just ahead of 38.2% retracement of 0.8221 (2024 low) to 0.8863 (2025 high) at 0.8618. Deeper fall would be seen back to 0.8201 (2022 low). For now, outlook will be neutral at best as long as 0.8863 hold.
EUR/AUD Daily Outlook
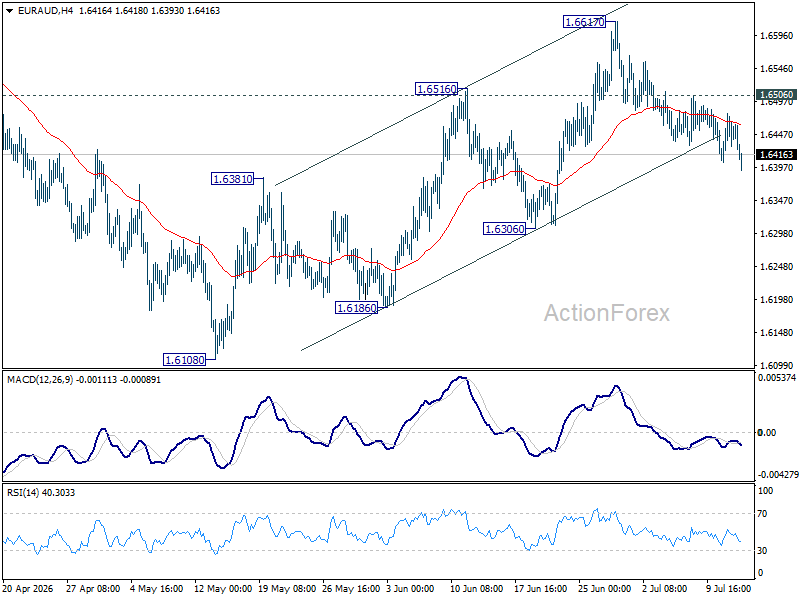
Intraday bias in EUR/AUD stays neutral at this point. Consolidations could continue below 1.6617, but outlook will stay bullish as long as 1.6306 support holds. On the upside, above 1.6506 minor resistance will bring retest of 1.6617. Firm break there will resume the rebound from 1.6108. However, decisive break 1.6306 support will argue that the rebound has completed, and bring retest of 1.6108.
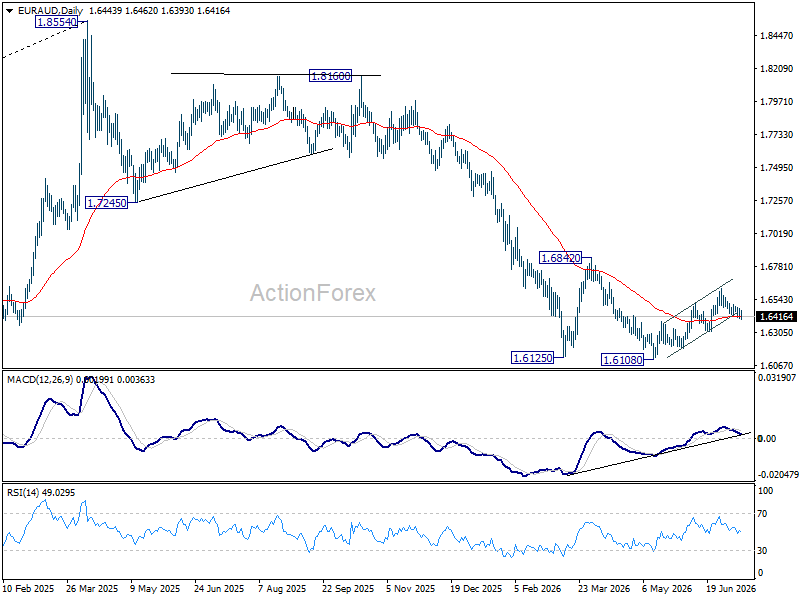
In the bigger picture, outlook will stay bearish as long as 1.6842 resistance holds. Fall from 1.8554 (2025 high) is expected to continue to 61.8% retracement of 1.4281 to 1.8554 at 1.5913. Decisive break there will pave the way back to 1.4281 (2022 low). However, firm break of 1.6842 should confirm medium term bottoming, and bring stronger rally.
EUR/CHF Daily Outlook
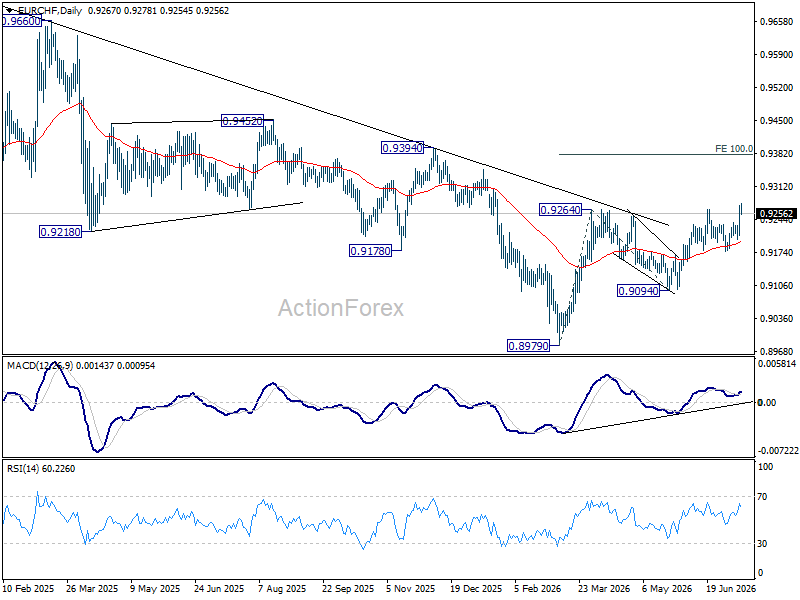
EUR/CHF's rise from 0.8979 resumed by breaking through 0.9265. Intraday bias remains on the upside. Next target is 100% projection of 0.8979 to 0.9264 from 0.9094 at 0.9379. Outlook will remain bullish as long as 0.9176 support holds, in case of retreat.
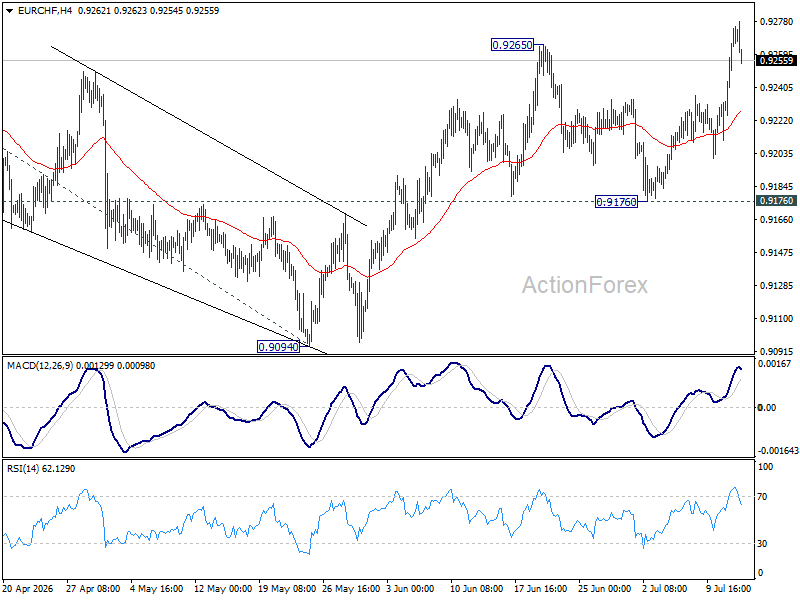
In the bigger picture, the break of medium term falling trend line resistance indicates that 0.8979 is already a medium term bottom. Considering bullish convergence condition in W MACD, rise from there should at least be reversing the fall from 0.9928, with prospect of developing into a medium term up trend. Firm break of 0.9394 resistance will add more credence to this case. For now risk will remain on the upside as long as 0.9094 support holds, in case of retreat.
Gold: The Edge of the Precipice Is Drawing Ever Closer
- An unfavourable background is weighing on gold prices.
- The Fed has not ruled out a July rate hike.
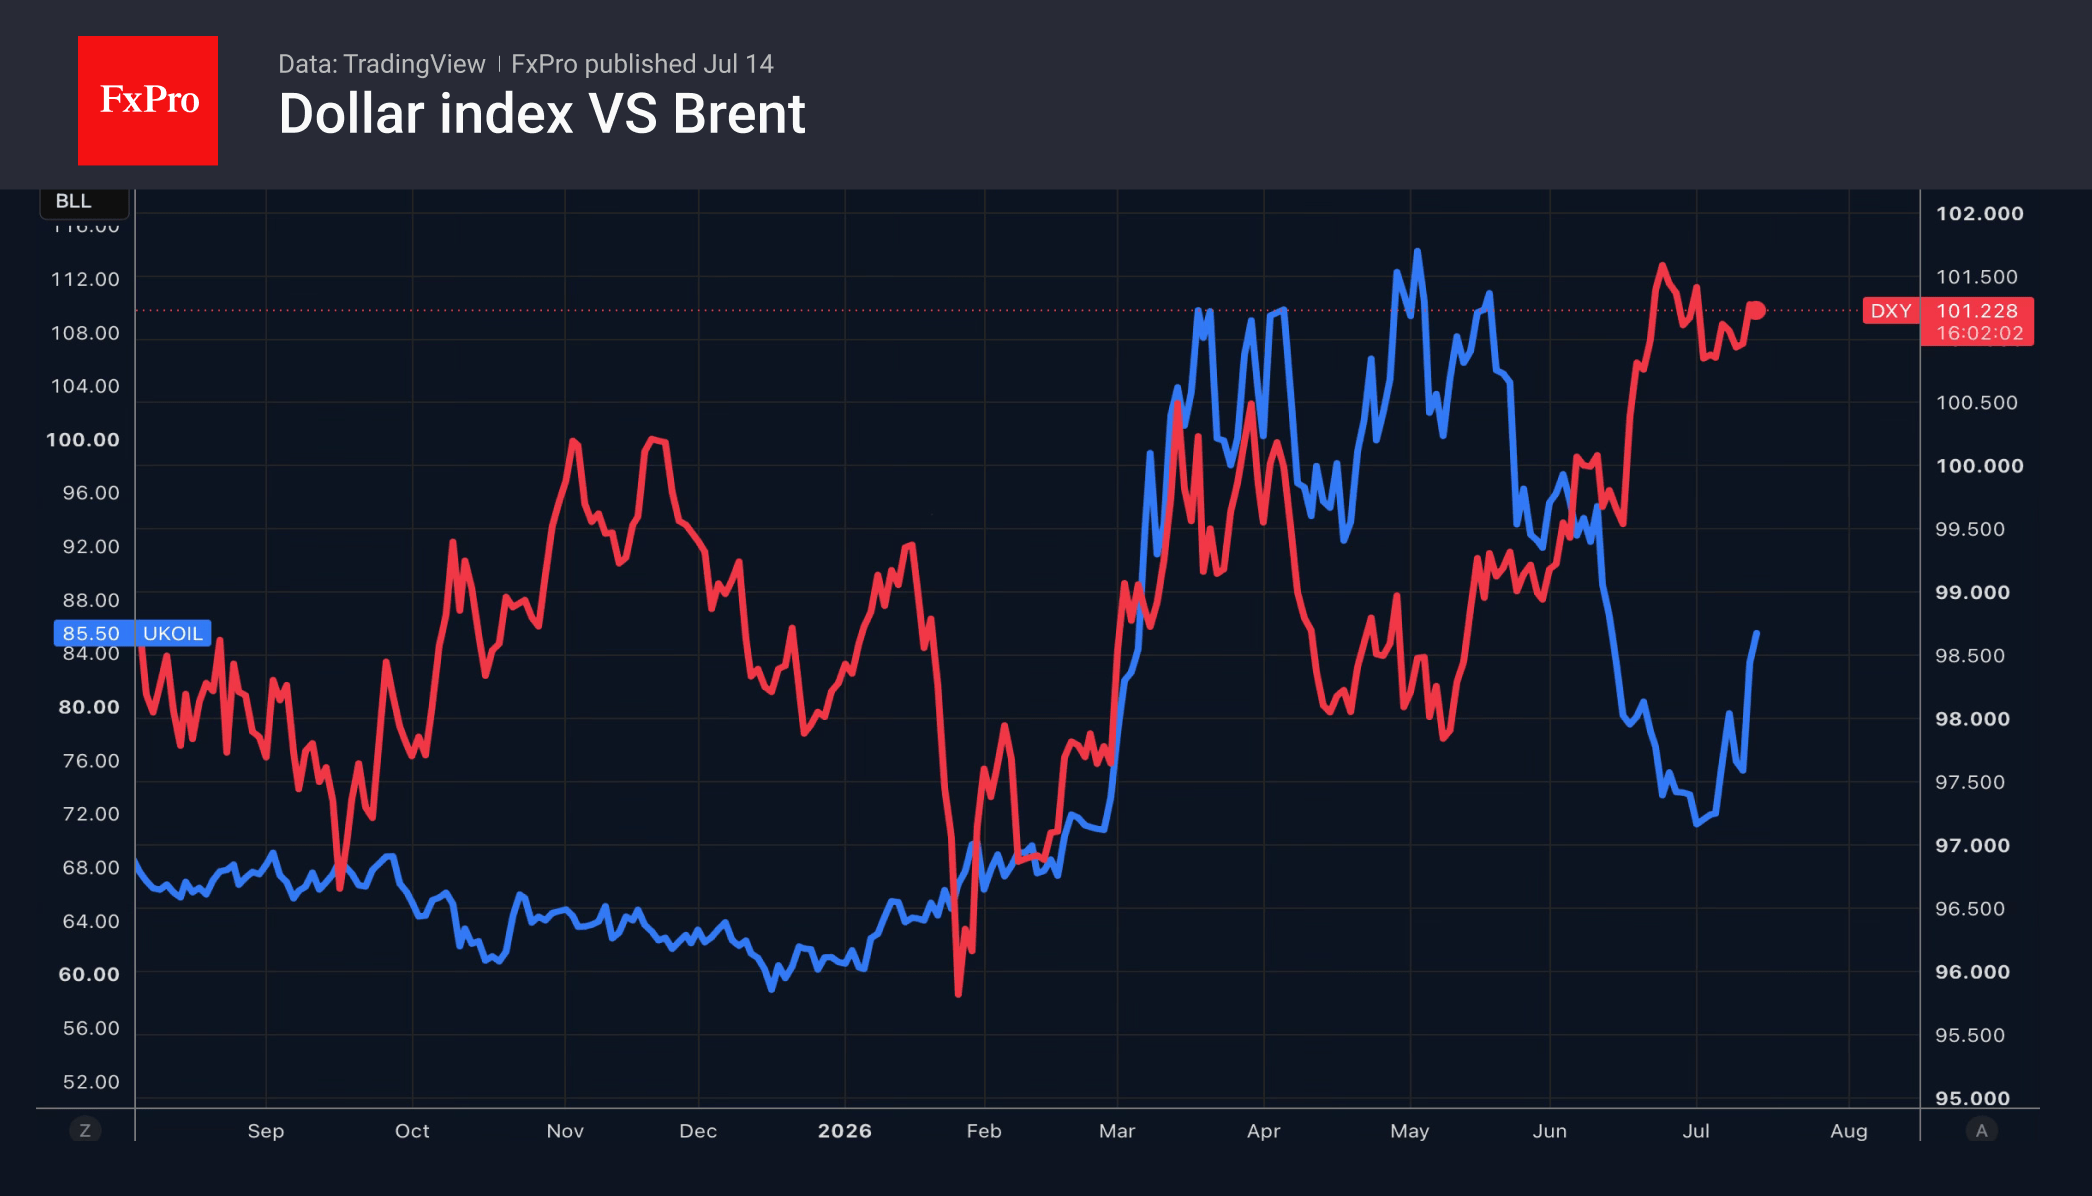
The US dollar posted its best day in three weeks on rumours of a US military blockade of the Strait of Hormuz. The escalation of the conflict in the Middle East enabled Brent to post its best daily percentage growth since 2020. This provided support for the greenback as a safe-haven asset and the currency of a net exporter of energy commodities. All the more so as the Fed may raise rates as early as its next meeting.
Christopher Waller spoke on this matter. The official expressed concerns about an acceleration in core inflation. If this is evident from the June consumer price report, the Fed should tighten monetary policy in July. The hawkish speech has raised the probability of two rate hikes in 2026 to 58% and the odds of a rate rise later this month to 43%. As a result, the US dollar has strengthened, and Treasury bond yields have risen.
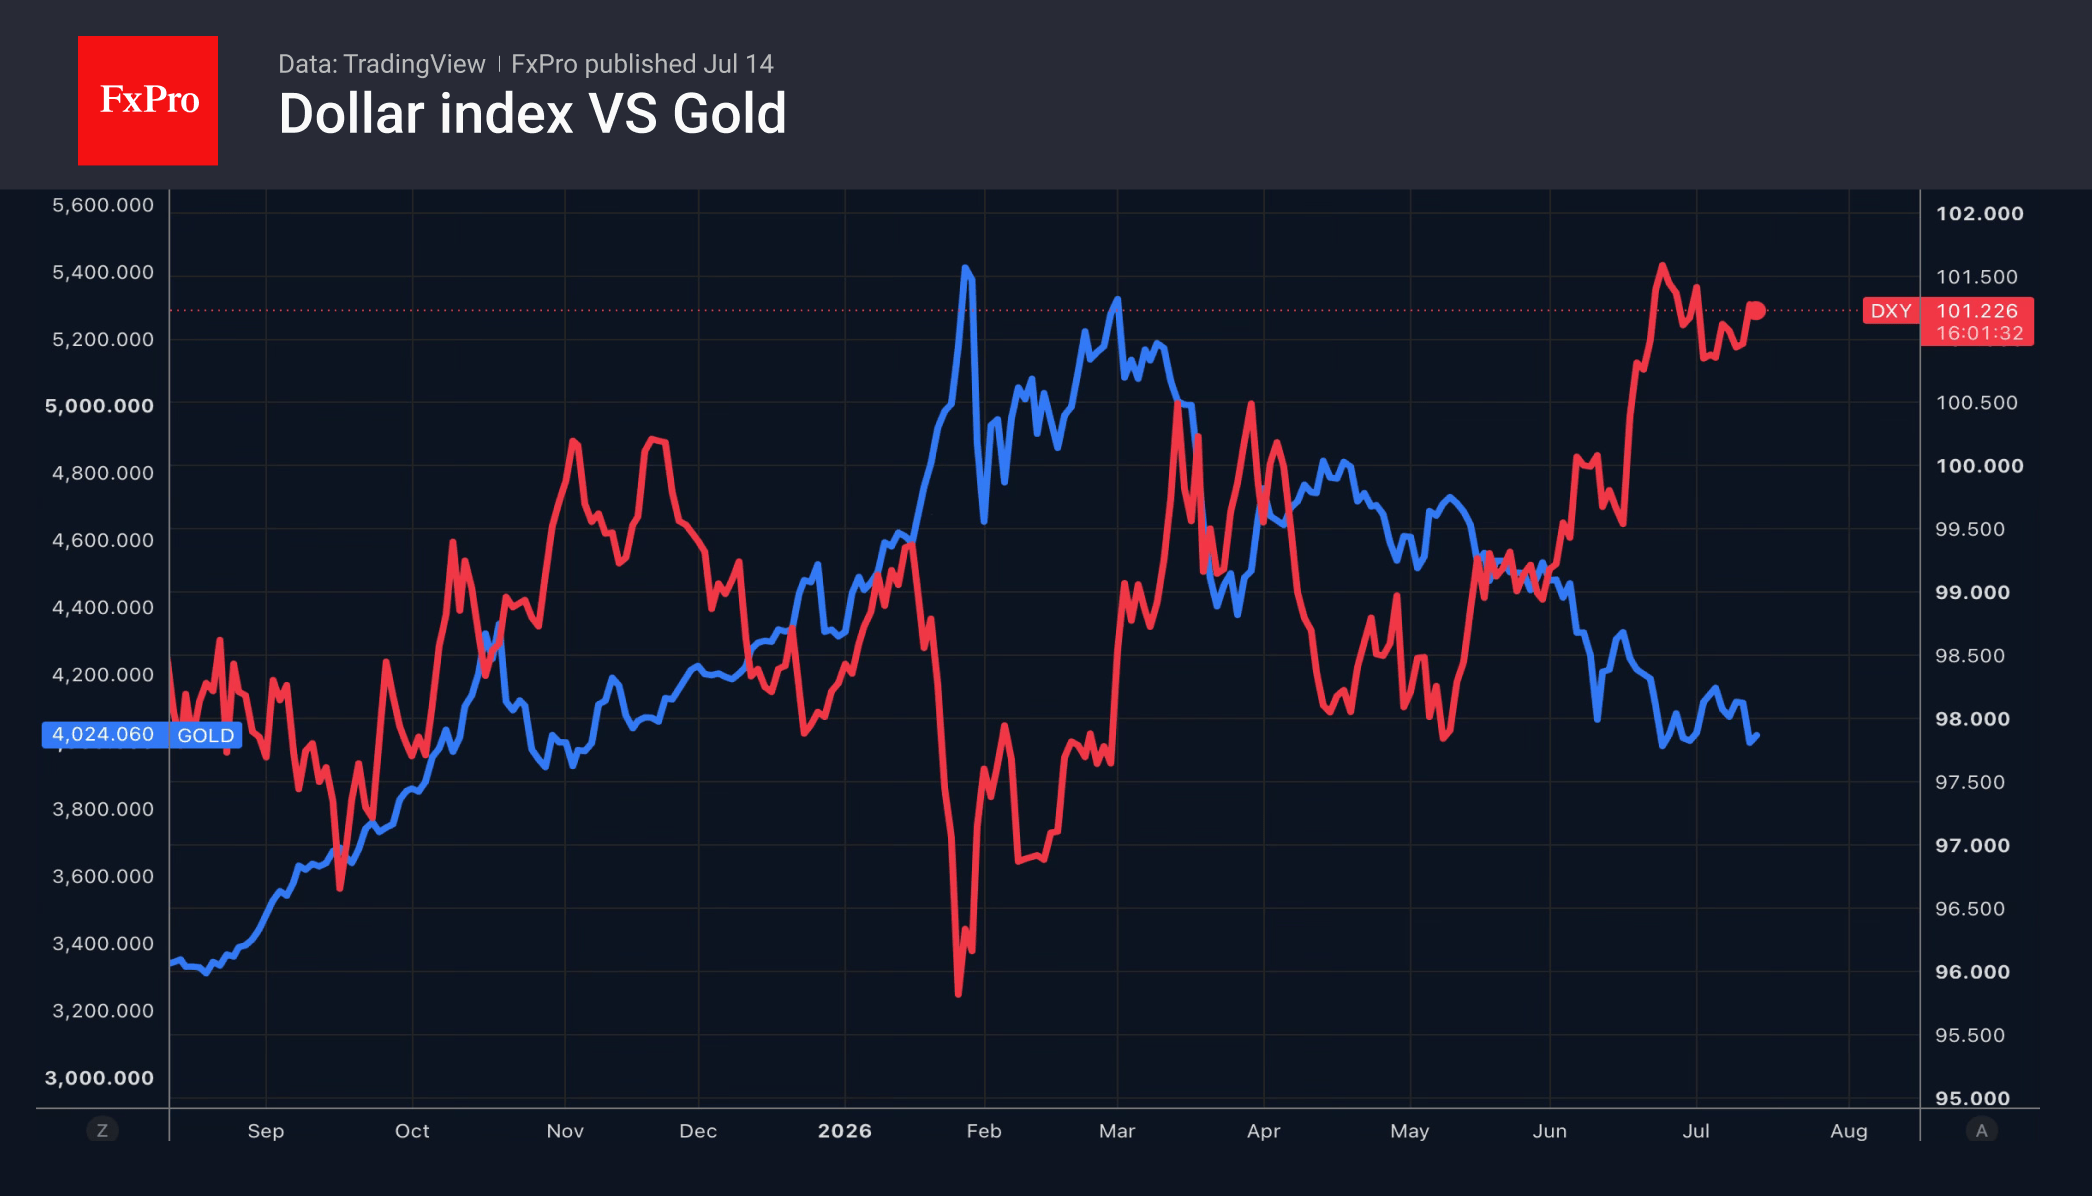
This backdrop is unfavourable for gold. It does not pay interest and is therefore unable to compete with assets that do so in a rising-interest-rate environment. At the same time, the opportunity cost of holding the precious metal in ETFs is rising, and capital outflows from specialised funds are contributing to the peak in gold prices.
Gold recorded its second-worst daily fall of 2026 on Monday. Its losses since the start of the year have exceeded 7%. Optimists, including State Street Investment Management, believe that Asian demand for the physical asset remains stable. That said, a price drop to $3,900 per ounce would trigger a rally, allowing the precious metal to find its bottom.
In reality, the fate of Gold lies in the hands of geopolitics and the US consumer price index report. Signs of accelerating core inflation in June would give the Fed grounds to raise interest rates as early as July, further strengthening the US dollar and pushing up yields on US Treasury bonds.
Keep an eye on Kevin Warsh’s testimony before Congress, as the new Fed Chair has already sent shockwaves through the financial markets twice since taking office. His hawkish rhetoric at the press conference following the June FOMC meeting and his vague comments at the ECB symposium in Sintra sent gold on a roller coaster ride.
The FxPro Analyst Team