
Sample Category Title
Bitcoin Looks Vulnerable as Downside Risks Continue to Mount
Key Highlights
- Bitcoin failed to surpass $65,000 and trimmed some gains.
- BTC/USD traded below a contracting triangle with support at $62,500 on the 4-hour chart.
- Ethereum also struggled above $1,800 and dipped from resistance.
- The US CPI could increase by 3.8% in June 2026 (YoY).
Bitcoin Price Technical Analysis
Bitcoin price attempted to gain pace for a move above $64,500 against the US Dollar but failed. BTC trimmed some gains and signaled a downside break.
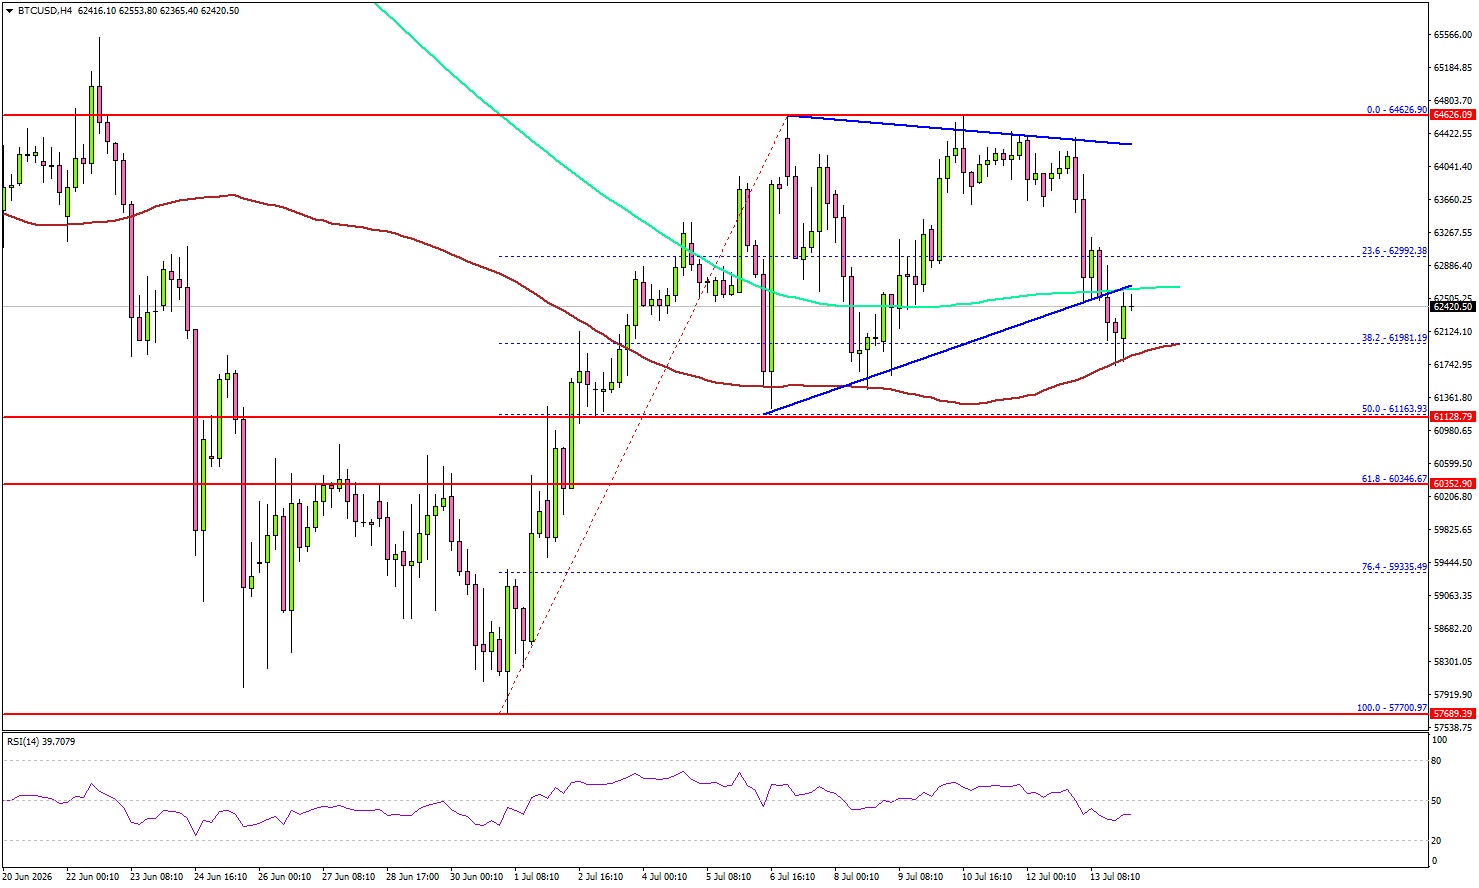
Looking at the 4-hour chart, the price formed a high near $64,626 and started a downside correction. There was a move below $63,500 and $63,200. The price traded below the 23.6% Fib retracement level of the upward move from the $57,700 swing low to the $64,626 high.
More importantly, BTC traded below a contracting triangle with support at $62,500 and the 200 simple moving average (green, 4-hour). If the bears remain in action, the price might find bids near the 50% Fib retracement level at $61,150.
A downside break and close below $61,150 could trigger a sharp decline. In the stated scenario, the price could test $60,350 or even $58,800.
On the upside, an immediate resistance could be $63,800. The first major resistance might be $64,500. The main resistance might be $65,000. A close above $65,000 could send the price toward $66,800. Any more gain might call for a test of $68,000.
Looking at Ethereum, the price seems to be facing a tough hurdle near $1,825 and might start a fresh decline in the near term.
Today’s Key Economic Releases
- US Consumer Price Index for June 2026 (MoM) – Forecast -0.1%, versus +0.5% previous.
- US Consumer Price Index for June 2026 (YoY) – Forecast +3.8%, versus +4.2% previous.
- US Consumer Price Index Ex Food & Energy for June 2026 (YoY) – Forecast +2.9%, versus +2.9% previous.
- Fed Chair Warsh testifies.
- Fed's Barr speech.
- Fed's Goolsbee speech.
- Fed's Cook speech.
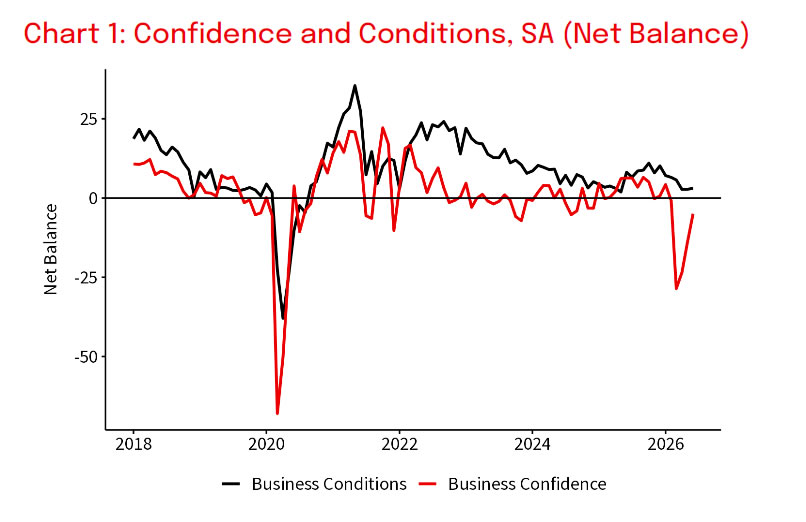
Australia NAB Business Confidence Rebounds to -5 as Inflation Pressures Ease
Australia's business confidence improved noticeably in June, with the NAB Business Confidence Index rising 9 points to -5, recovering much of the sharp deterioration seen in March. While confidence remained below zero, the survey suggests businesses became less concerned as the economic fallout from the Middle East conflict proved less severe than initially feared. Business conditions were unchanged at +3, still below the long-run average of +7, indicating activity has stabilized but remains softer than earlier in the year.
The survey paints a picture of an economy that is slowing rather than contracting. NAB Chief Economist Sally Auld said easing concerns over energy markets and broader geopolitical risks had helped restore confidence, while business conditions and capacity utilization suggest growth has moderated without falling away.
That interpretation is consistent with the survey's inflation indicators. Purchase cost growth slowed further from 2.5% to 2.0% on a quarterly basis, final product price growth eased from 0.9% to 0.6%, and retail prices fell 0.3%, the first decline in seven years. Labor cost growth accelerated from 1.5% to 2.0%, largely reflecting the increase in the minimum wage that took effect on July 1.
Survey Data
| Component | Current | Previous |
|---|---|---|
| Business Confidence | -5 | -14 |
| Business Conditions | +3 | +3 |
| Purchase Cost Growth (Quarterly) | 2.0% | 2.5% |
| Labour Cost Growth (Quarterly) | 2.0% | 1.5% |
| Final Product Price Growth | 0.6% | 0.9% |
| Retail Price Growth | -0.3% | 1.5% |
Market Takeaways
- Business confidence rebounded sharply, recovering much of the decline seen after the March Middle East conflict.
- Business conditions stabilized but remained below their long-run average, suggesting growth has slowed rather than contracted.
- Purchase cost growth and final selling price inflation both moderated, indicating the earlier energy shock had a smaller inflation impact than feared.
- Retail prices fell for the first time in seven years, reinforcing signs of easing pricing pressures in consumer-facing sectors.
- Labor cost growth accelerated following the July 1 minimum wage increase, highlighting continued wage pressures.
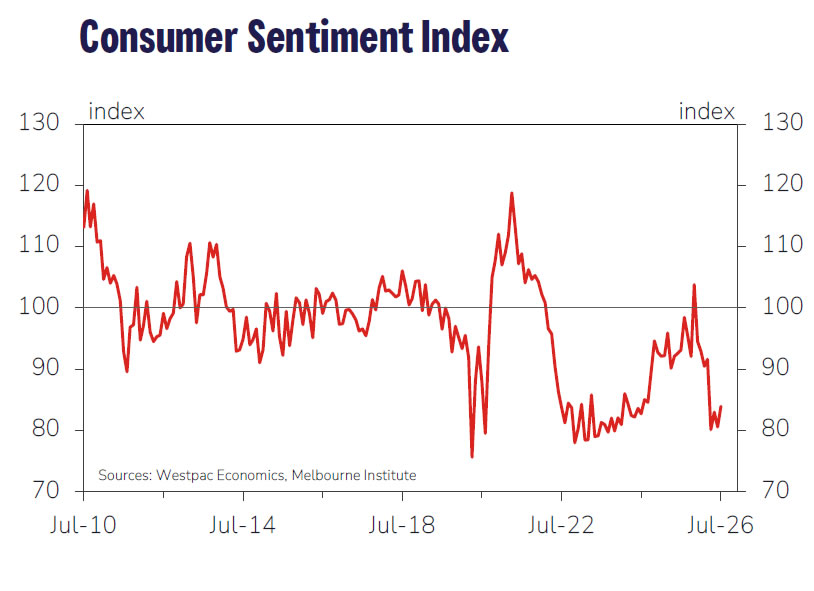
Australia Westpac Consumer Sentiment Rebounds to 83.9, but Pessimism Still Runs Deep
Australian consumer sentiment improved in July, with the Westpac–Melbourne Institute Consumer Sentiment Index rising 4.1% to 83.9. The increase suggests households have become less concerned that the Reserve Bank of Australia's June decision to leave the cash rate unchanged would be followed by another rapid sequence of rate hikes. Even so, confidence remains deeply depressed. At 83.9, the index still ranks among the weakest 10% of readings recorded over the survey's 50-year history.
The survey points to easing fears rather than renewed optimism. Expectations for the economy over the next 12 months and five years improved only marginally and remain well below long-run averages. Consumers were, however, more positive about the labor market, with the Unemployment Expectations Index falling -7.1% to 129.9, returning close to its historical norm. Uncertainty over the interest-rate outlook also remains elevated, with 17% of respondents saying they "don't know" where rates are headed—the highest proportion since March 2022—highlighting the lack of conviction surrounding the RBA's next move.
For policymakers, attention now shifts firmly to the June quarter CPI report due on July 29. Westpac argues the improvement in confidence partly reflects relief that worst-case scenarios for energy prices, interest rates and employment have not materialized. However, it also expects inflation to remain uncomfortably high, supporting another 25 basis point rate increase at the RBA's August meeting. Recent communication from senior RBA officials has emphasized that inflation persistence remains the Board's primary concern, suggesting stronger sentiment alone is unlikely to alter the central bank's readiness to tighten policy again if price pressures fail to ease.
Economic Data
| Indicator | Actual | Previous |
|---|---|---|
| Westpac–Melbourne Institute Consumer Sentiment Index | 83.9 | 80.6 |
| Consumer Sentiment (MoM) | +4.1% | — |
| Economy, Next 12 Months | 78.3 | 77.7 |
| Economy, Next 5 Years | 87.1 | 86.4 |
| Unemployment Expectations Index* | 129.9 | 139.9 |
| Consumers Unsure About Interest Rate Outlook | 17% | — |
Market Takeaways
- Consumer sentiment improved after the RBA paused in June, easing fears of a rapid succession of further rate hikes.
- Despite the rebound, confidence remains historically weak, with the index still in the lowest 10% of readings over the survey's 50-year history.
- Consumers became more optimistic about the labour market, while views on the broader economy improved only marginally.
- Uncertainty over the interest-rate outlook remains unusually high, with 17% of respondents unsure where rates are headed.
- The June quarter CPI report on July 29 is expected to be the decisive input for the RBA's August policy meeting.
- Improving confidence alone is unlikely to alter the RBA's inflation-focused stance if price pressures remain elevated.
NZIER QSBO Signals Improving Confidence but Sticky Inflation Risks
Business confidence in New Zealand improved in the June quarter, according to the latest NZIER Quarterly Survey of Business Opinion, with a seasonally adjusted net 12% of firms expecting economic conditions to improve over coming months, up from just 1% in the previous survey. The rebound came as global fuel prices eased following the US-Iran Memorandum of Understanding that guaranteed ship passage through the Strait of Hormuz, helping reverse some of the pessimism that followed the earlier Middle East conflict. However, demand remained subdued, with a net 1% of firms reporting stronger activity in their own businesses, highlighting that the improvement was driven more by sentiment than a broad-based pickup in economic conditions.
Despite stronger confidence, firms remained cautious about expanding capacity. A net 10% reduced staff numbers during the quarter, while a net 1% expect further declines in employment over the next three months. Investment intentions also stayed weak, with a net 3% planning to reduce spending on buildings, plant and machinery over the coming year. The survey period concluded before the latest escalation in US-Iran tensions and renewed surge in oil prices, suggesting hiring and investment plans could face additional pressure as geopolitical uncertainty intensifies ahead of New Zealand's general election in November.
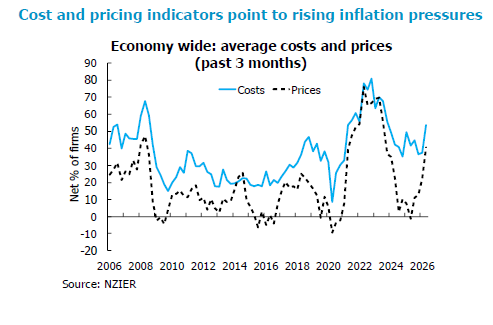
More concerning for the Reserve Bank of New Zealand, the survey pointed to a renewed build-up in inflation pressures. Firms reporting higher costs increased from a net 37% to more than half, while the proportion able to pass those costs through to customers rose to a net 41%. Cost pressures were particularly evident in the building and retail sectors, although weak construction demand continued to limit pricing power in parts of the economy.
Survey Data
| Component | Current | Trend |
|---|---|---|
| General Economic Outlook | +12% | Improving |
| Own Activity | +1% | Broadly Flat |
| Employment (Past Quarter) | -10% | Weaker |
| Employment Intentions (Next Quarter) | -1% | Slightly Weaker |
| Investment Intentions (Next 12 Months) | -3% | Weaker |
| Firms Reporting Higher Costs | >50% | Rising |
| Firms Raising Selling Prices | 41% | Rising |
Market Takeaways
- Business confidence improved markedly, with firms becoming more optimistic about the economic outlook.
- Demand remained subdued, indicating confidence has yet to translate into stronger business activity.
- Hiring and investment intentions stayed cautious, reflecting ongoing geopolitical and domestic political uncertainty.
- Cost pressures intensified significantly, with more firms reporting higher input costs and greater ability to pass them on to customers.
- The survey suggests New Zealand's recovery is continuing gradually, but inflation risks have become more persistent.
- For the RBNZ, the combination of improving confidence and firmer pricing power reinforces a cautious, data-dependent policy stance.
Fed’s Waller: Another Hot CPI Could Force Near-Term Rate Hike
Federal Reserve Governor Christopher Waller struck a markedly more hawkish tone on Monday, warning that another upside surprise in Tuesday's CPI report could force the FOMC to consider raising interest rates "in the near term." The shift is notable because Waller has generally been regarded as one of the more dovish members of the Committee. His remarks come as geopolitical tensions in the Middle East have driven Brent crude above $85, adding to concerns that higher energy prices could reinforce already persistent inflation pressures. Reflecting the changing backdrop, Fed funds futures now imply a 77% probability of a September rate hike, up sharply from around 58% just a week ago.
Describing monetary policy as being at a "crossroads," Waller made clear that upcoming inflation data will heavily influence his thinking. "If I get another higher one, I'm going to treat that as signal, not noise," he said, referring to the recent string of elevated inflation readings. He cautioned that "sternly staring at inflation until it melts before our withering gaze is not an option," underscoring his view that the Fed should not repeat the mistake of waiting too long to respond if inflation proves more persistent than expected.
Waller acknowledged there remains "a credible case" for inflation to gradually return to the Fed's 2% objective with policy left unchanged. However, he expressed growing concern that inflation is becoming more broad-based rather than being confined to tariffs and energy costs. Nearly 70% of core services categories are now recording both three-month and twelve-month inflation above 3%, suggesting underlying price pressures are spreading through the economy. Against a backdrop of a stable labor market and anchored inflation expectations, he argued that the Fed has room to tighten further if necessary without acting prematurely.
The immediate focus now turns to Tuesday's June CPI report, which Waller identified as the next major policy test. "If we get another hot reading on core inflation this week, then the FOMC will need to consider tightening monetary policy in the near term," he said. At the same time, he emphasized that it would take "several months of lower readings" before he would be convinced inflation is sustainably moving back toward target. His comments raise the stakes ahead of the inflation release and set the stage for Fed Chair Kevin Warsh's first congressional testimony later in the day, where markets will look for confirmation—or a different interpretation—of the inflation outlook.
First Impressions: NZIER Quarterly Survey of Business Opinion, June quarter 2026
Business confidence picked up a bit in the June quarter, but Middle East tensions and higher fuel prices remained on firms’ minds.
Key results (seasonally adjusted)
- General business situation: +12 (Prev: +1)
- Trading activity, past three months: +1 (Prev: 0)
- Trading activity, next three months: +10 (Prev: +13)
- Average selling prices, past three months: +37 (Prev: +23)
- Average selling prices, next three months: +52 (Prev: +43)
The NZIER’s June quarter survey of business opinion showed a modest lift in confidence as the tensions in the Middle East eased. Sentiment about the general business situation rose to a net 12% positive, compared to a net 1% in the March survey. However, the own-activity measures, which tend to have a closer correspondence with GDP growth, were little changed for the quarter.
As in the March quarter, the fast-moving events in the Middle East meant that the averages in this survey hide a lot. While the survey period ran from 10 June to 7 July, nearly all of the responses were received on two dates: on the 10th when the survey was sent out, and on the 17th after the signing of the Memorandum of Understanding between the US and Iran. For general business sentiment, early responses were a net 5% negative, while the second batch were a net 20% positive. With the renewed hostilities this month, the first batch of responses is probably more representative of where sentiment would stand if the survey was re-run today.
Other activity indicators were mixed. Investment and hiring intentions were less negative than in the March quarter, while profitability was expected to worsen further.
Conditions remain mixed across industries. Manufacturing remains relatively upbeat, buoyed by strong export sales, but respondents were more negative about the quarter ahead and noted a particularly large increases in their costs and sale prices. The building industry was a little more positive this quarter, but reported that they have continued to cut their prices despite soaring costs. Merchants (wholesalers and retailers) remained positive, but less so than last quarter.
The rise in fuel prices since March was clearly reflected in the pricing measures of the survey. A net 41% of firms reported raising their prices in the last quarter, up from 22% last quarter the highest reading since September 2023. In the next three months, a net 54% of firms intend to raise their prices, the highest since March 2023.
For the RBNZ, the implications of the survey are unclear. While it’s not surprising that a number of firms would be looking to pass on the rise in fuel and other costs, the short horizon for the survey questions (three months ahead) means that it doesn’t tell us a lot about the potential for second-round inflationary effects. And while the activity measures improved in some places, they don’t really seem to support the RBNZ’s assertion that the economy has been running stronger than they expected in their May MPS forecasts.
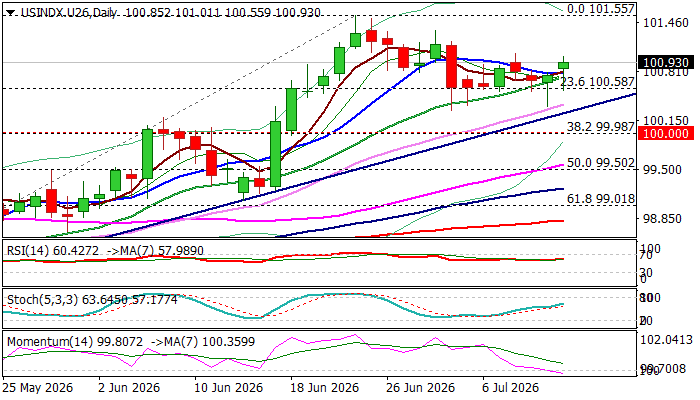
Dollar Index – Geopolitical Uncertainty and Inflation Concerns to Continue to Provide Support
The US dollar jumped on opening on Monday and quickly reversed gains but remained within approx. $50 range for the day.
Fresh escalation in the Middle East added to inflation concerns and expectations that the Fed would keep its hawkish stance for some time, with news that large pension funds are returning to dollar, after last year’s migration, added to supportive factors.
Larger picture shows the index trending higher off 2026 low (95.35) within a bull-channel, though, daily chart shows the action in a narrow-range sideways mode, capped by previously broken Fibo barrier at 100.94 (38.2% retracement of 110.00/95.35 descend) and supported by daily Kijun-sen (100.32).
Daily studies remain predominantly bullish, though 14-d momentum slipped into negative territory that may keep near-term action in directionless mode and keep the downside vulnerable.
However, bullish structure is expected to remain intact while the price holds above trendline support (100.29) and keep focus at 101.55 (new 2026 peak, the highest since early Nov 2025), break of which to signal continuation of an uptrend from 95.35 and expose targets at 101.80 (12 May 2025 peak) and 102.67 (50% retracement of 110.00/95.35).
Caution on break below 100 level (psychological / Fibo 38.2% of 97.44/101.55 upleg) that may sideline bulls for potential deeper pullback.
Res: 101.04; 101.55; 101.80; 102.67
Sup: 100.55; 100.29; 100.00; 99.50
Eco Data 7/14/26
| GMT | Ccy | Events | Act | Cons | Prev | Rev |
|---|---|---|---|---|---|---|
| 22:00 | NZD | NZIER Business Confidence Q2 | 8 | -4 | ||
| 23:01 | GBP | BRC Like-For-Like Retail Sales Y/Y Jun | 1.70% | 3.40% | ||
| 00:30 | AUD | Westpac Consumer Confidence Jul | 4.10% | -2.90% | ||
| 01:30 | AUD | NAB Business Confidence Jun | -5 | -14 | ||
| 01:30 | AUD | NAB Business Conditions Jun | 3 | 3 | ||
| 03:00 | CNY | Trade Balance (USD) Jun | 125.6B | 119.5B | 105.4B | |
| 04:30 | JPY | Industrial Production M/M May F | 0.10% | 0.50% | 0.50% | |
| 06:30 | CHF | Producer and Import Prices M/M Jun | -0.30% | -0.50% | -0.40% | |
| 06:30 | CHF | Producer and Import Prices Y/Y Jun | -2.10% | -1.80% | ||
| 10:00 | USD | NFIB Business Optimism Index Jun | 97.4 | 95.6 | 95.3 | |
| 12:30 | USD | CPI M/M Jun | -0.40% | -0.10% | 0.50% | |
| 12:30 | USD | CPI Y/Y Jun | 3.50% | 3.80% | 4.20% | |
| 12:30 | USD | CPI Core M/M Jun | 0.00% | 0.20% | 0.20% | |
| 12:30 | USD | CPI Core Y/Y Jun | 2.60% | 2.80% | 2.90% |
| 22:00 | NZD |
| NZIER Business Confidence Q2 | |
| Actual | 8 |
| Consensus | |
| Previous | -4 |
| 23:01 | GBP |
| BRC Like-For-Like Retail Sales Y/Y Jun | |
| Actual | 1.70% |
| Consensus | |
| Previous | 3.40% |
| 00:30 | AUD |
| Westpac Consumer Confidence Jul | |
| Actual | 4.10% |
| Consensus | |
| Previous | -2.90% |
| 01:30 | AUD |
| NAB Business Confidence Jun | |
| Actual | -5 |
| Consensus | |
| Previous | -14 |
| 01:30 | AUD |
| NAB Business Conditions Jun | |
| Actual | 3 |
| Consensus | |
| Previous | 3 |
| 03:00 | CNY |
| Trade Balance (USD) Jun | |
| Actual | 125.6B |
| Consensus | 119.5B |
| Previous | 105.4B |
| 04:30 | JPY |
| Industrial Production M/M May F | |
| Actual | 0.10% |
| Consensus | 0.50% |
| Previous | 0.50% |
| 06:30 | CHF |
| Producer and Import Prices M/M Jun | |
| Actual | -0.30% |
| Consensus | -0.50% |
| Previous | -0.40% |
| 06:30 | CHF |
| Producer and Import Prices Y/Y Jun | |
| Actual | -2.10% |
| Consensus | |
| Previous | -1.80% |
| 10:00 | USD |
| NFIB Business Optimism Index Jun | |
| Actual | 97.4 |
| Consensus | 95.6 |
| Previous | 95.3 |
| 12:30 | USD |
| CPI M/M Jun | |
| Actual | -0.40% |
| Consensus | -0.10% |
| Previous | 0.50% |
| 12:30 | USD |
| CPI Y/Y Jun | |
| Actual | 3.50% |
| Consensus | 3.80% |
| Previous | 4.20% |
| 12:30 | USD |
| CPI Core M/M Jun | |
| Actual | 0.00% |
| Consensus | 0.20% |
| Previous | 0.20% |
| 12:30 | USD |
| CPI Core Y/Y Jun | |
| Actual | 2.60% |
| Consensus | 2.80% |
| Previous | 2.90% |
Will AI Earnings for Q2 Disprove ‘Bubble’ Fears?
- Q2 earnings come at sensitive time geopolitically and for the tech sector.
- AI and chip stocks to face scrutiny as Wall Street wobbles.
- Is the AI outlook still optimistic or are fears of a bubble well-founded?
Hyperscalers vs enablers
The Q2 earnings season is here, with Tesla and Alphabet kicking things off for the technology sector on July 22. Artificial intelligence (AI) stocks look set to dominate the season once again. But this time round, the focus is as much on AI enablers, if not more, as it is on the hyperscalers. Specifically, semiconductors were the big winners of the second quarter, as their stocks skyrocketed to new all-time highs.
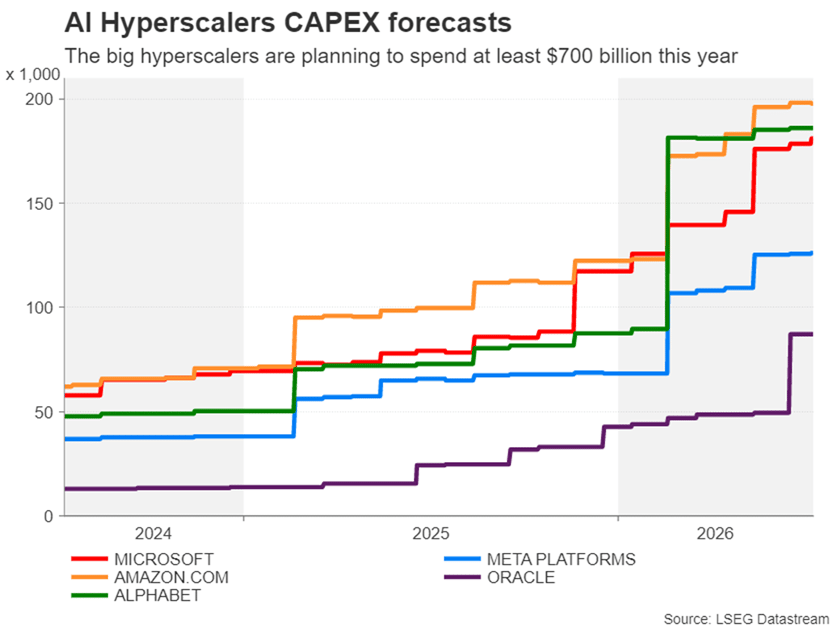
Soaring demand for AI datacentre infrastructure is proving to be a boon for chipmakers as well as other datacentre equipment manufacturers. These so-called AI enablers are benefiting directly from all the spending on AI by hyperscalers such as Microsoft, Alphabet, Amazon, Meta and Oracle.
Whereas there's a big question mark about whether all the AI investment will pay off for Wall Street's big guys, the earnings prospects for the recipients of this spending are much more of a sure bet. Hence, investors have been piling into chipmakers these past few months, while losing enthusiasm for the usual favourites like the Magnificent Seven (M7).
The semiconductor boom
The Philadelphia Semiconductor sector index, which measures the 30 largest US-traded companies that design and manufacture semiconductors, surged almost 88% in Q2. In comparison, the wider tech index – Nasdaq 100 – was up 27.5%, while the benchmark S&P 500 index gained nearly 15%.
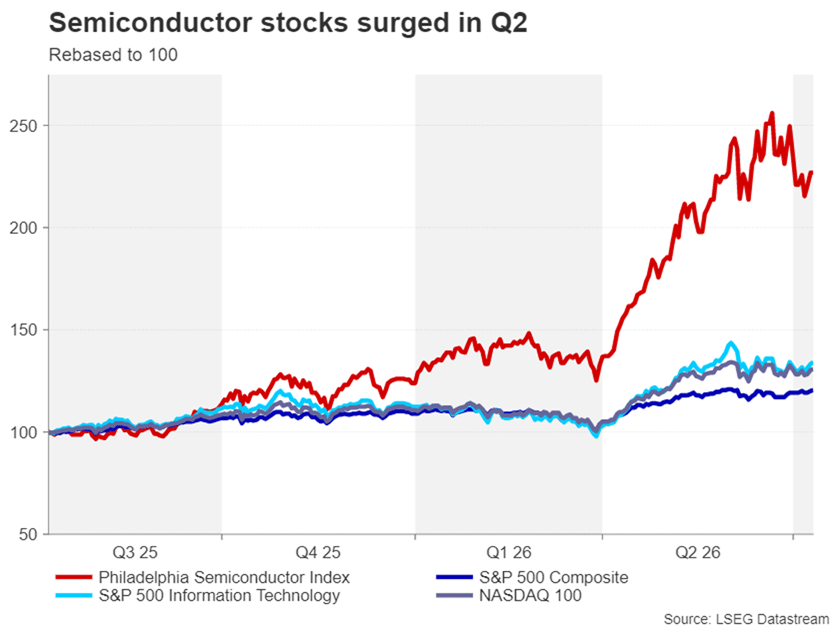
The chip rally has created new trillion-dollar companies, notably Micron Technology and SK Hynix. Interestingly, current AI and chip giant Nvidia's stock performance was more in line with those of the broader indices than the semiconductor gauge, as the company got caught in the AI frenzy much earlier on than its smaller rivals and its rally has started to cool off lately.
Heading into the Q2 earnings season, excitement is running high for the major chip stocks following the bumper earnings reported in the first quarter. The challenge is whether they will be able to sustain similar revenue growth while maintaining the bullish outlook for the upcoming quarters.
Chip stocks lead the way
For traders, though, the risk is that the triple-digit growth of Q1 will be a tough act to follow and therefore the scope for additional gains may be limited. Among the winners, Sandisk, Micron Technology and South Korea's SK Hynix topped the leaderboard, while Meta, Oracle and Microsoft found themselves at the bottom of the table.
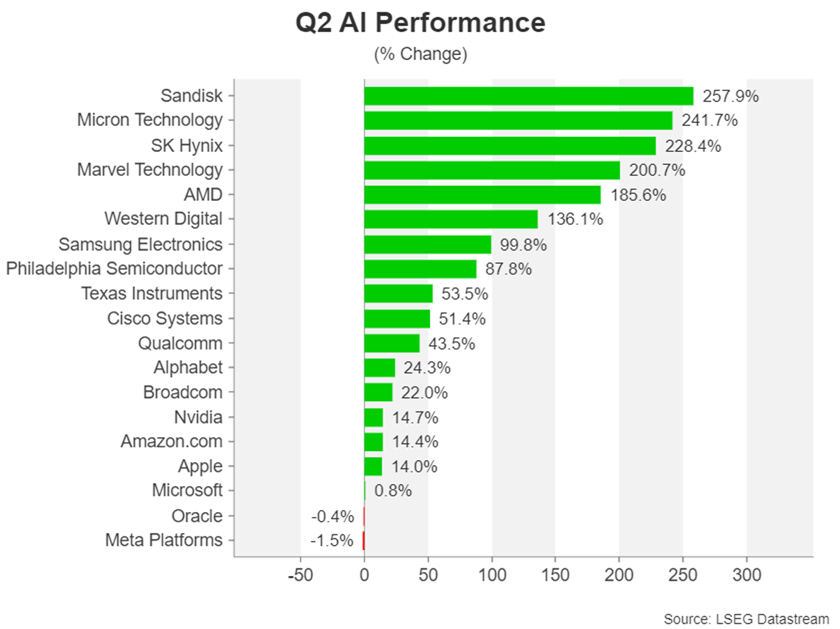
Although Oracle isn't considered part of the Big Tech, worries about its spending plans and balance sheet are casting a shadow on an otherwise healthy earnings growth, as well as on the prospects of other hyperscalers. For Meta and Microsoft, there are growing doubts about their AI ambitions and earnings potentials, which don't stack up as well when compared to their M7 peers like Alphabet and Amazon.
Going forward, the key questions for investors are: Is the strong demand holding up? How much optimism has already been priced into these stocks? And is the scarcity in memory and storage chips easing?
Rosy forecasts
The forecasts are certainly on the optimistic side. According to FactSet, Earnings growth for the S&P 500's Information Technology (IT) sector is estimated at 63.3% y/y for the second quarter, which is the second highest behind the Energy sector (122.9% y/y).
Within the IT sector, semiconductors are doing much of the heavy lifting as their projected earnings growth of 131% far eclipses that of the other sub-sectors.
Apart from the Energy and IT sectors, Materials is the only other sector that's expected to achieve faster earnings growth than the whole of the S&P 500, which is forecast at 23.6%.
Whilst the energy sector had a bumper quarter due to the jump in oil and gas prices from the US-Iran war, the AI boom has started to spread beyond IT, boosting the Materials sector. Specifically, companies engaged in the mining and production of raw materials such as metals are enjoying strong demand from the massive infrastructure spending on datacentres.
Non-tech sectors may struggle
The projections for the other sectors are not as upbeat, with only Utilities expected to achieve earnings growth of more than 10%. Nevertheless, the S&P 500 is headed for a second straight quarter of plus 20% earnings growth and the seventh with double digit growth.
This is an impressive run given the Trade War in 2025 and the Middle East conflict just in the last quarter. But will traders be impressed? Many valuations are already considered to be at extremely overstretched levels, prompting comparisons with the dot-com bubble of the late 1990s.
Elon Musk's Tesla and UK chipmaker ARM Holdings have forward price/earnings (P/E) ratios of 177 and 135, respectively, while Intel's P/E is a lofty 82.5, all of which are far above the S&P 500 trailing average of just over 22. However, some P/E ratios have come down, such as Nvidia's, and there are several chip stocks that still have below 20 P/Es, even after the recent rally.
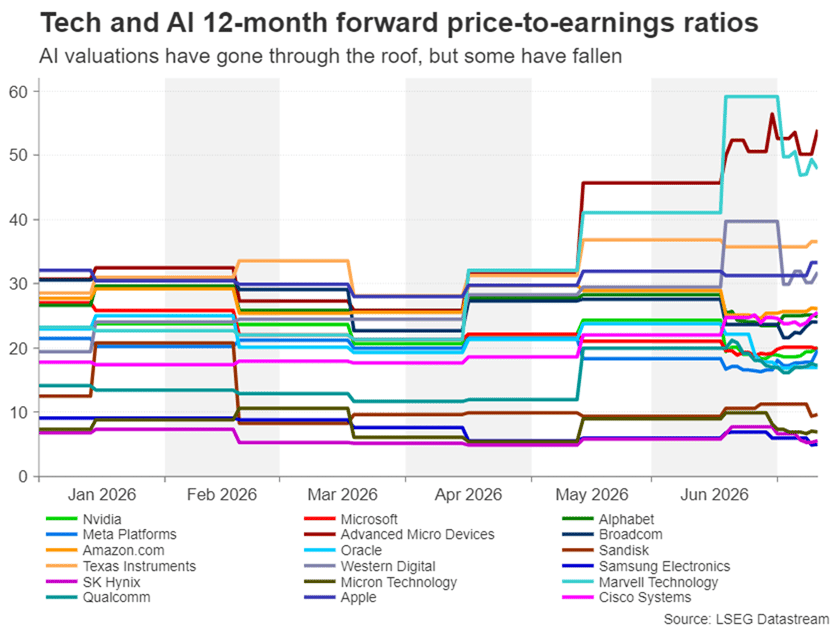
Room to grow?
This suggests that if actual earnings match the expected results over the coming quarters and the outlook remains positive, there's room for much more substantial gains for these stocks before becoming significantly overvalued.
Among them, Micron Technology, Qualcomm, SanDisk, Broadcom, Texas Instruments and Western Digital have all benefited from the explosion in new datacentres. The huge surge in demand has led to shortages in memory and storage chips, pushing up gross margins for the major producers. But others such as Advanced Micro Devices and Marvell Technology are looking somewhat overvalued with P/Es in the 50 region.
Nevertheless, with renewed jitters about the sustainability of the AI boom sparking a big selloff in chip stocks, the lower valuations may represent a buy-the-dip opportunity, even for some of the more expensive stocks. Yet, many traders will probably prefer to stay put until they've gotten a glimpse of what the new earnings season holds for the AI industry and the shifting dynamics within it.
Diverging valuations
Without a doubt, investors will be hoping to see continued double-digit growth in earnings in Q2 as well as upbeat guidance for the next few quarters. Any signs of a slowdown in revenue growth would likely spook markets. But it's important to highlight that the risks differ for the hyperscalers and enablers.
The key concern for the hyperscalers is that the record amount of capital expenditure being poured into AI is not delivering a satisfactory return on investment, particularly for those that are drying up their entire cash flows or resorting to new debt issuance to finance their AI ambitions.
The scarcity of memory chips and other AI components is also a problem for the hyperscalers, posing a two-way challenge, as it not only limits supply but also pushes up costs. Even the likes of Apple and Microsoft have been forced to hike the prices of some of their products, as margins have come under pressure. But for enablers, this is the windfall that's been fuelling their stocks higher.
Risks to the outlook
That's not to say that chip and AI equipment manufacturers are not susceptible to shortages themselves along the supply chain. Chipmakers additionally run the risk of overinvesting in their drive to expand production, potentially leading to a supply glut down the line.
The other danger for chipmakers is if the White House were to decide to loosen restrictions on Chinese memory chips – something Apple is lobbying the Trump administration for, easing the supply crunch and squeezing margins.
Beyond the AI-related developments, which are constantly evolving, there's the turbulent geopolitical landscape, amid the ongoing US-Iran tensions that are boosting inflationary pressures by putting a strain on energy flows from the Gulf, and a more uncertain period of Fed policy, with rate hikes back on the horizon. The aforementioned have increased the risk of economic slowdown both in the United States and globally. A sharp economic pain makes it more likely that the big AI spenders would tighten their purse strings at some point, hurting AI enablers the most.
One might be asking, would Nvidia also be impacted from a cutback in AI investment? After all, the company has an order backlog of $1 trillion. But this is surely already priced into its stock price, so the answer is probably yes.
AI industry: It's complicated
It's important to bear in mind, however, that not all chipmakers are the same. Each serves a specific purpose within the processor architecture and semiconductor supply chain and therefore will be impacted differently by the AI headlines. Add to the mix the Big Tech hyperscalers and their varied fundamentals and the picture gets even more complicated.
One positive outcome of this is that it allows investors to rotate within the wider tech sector as demand and industry trends change. This pattern went into full swing in the second quarter and although it makes it more difficult to predict which way AI stocks will go, it's a reminder that much of the AI industry is still in its infancy.
The Q2 earnings season will likely go only a small way in clearing all this up but will nonetheless be crucial in determining the short-to-medium term momentum in the AI trade. The one thing that has become more certain is that tech and AI stocks are more prone to large daily swings, warranting extra caution when trading them.
Sunset Market Commentary
Markets
At the start of the new trading week markets continued to 'mark-to-market' the recent flaring up of hostilities between the US and Iran. Aside multiple other sources of disagreement, the key point of the current re-escalation clearly concerns the management of (free?) traffic across the Strait of Hormuz. The US until now advocated a free transit, but even President Trump in an interview suggested that it could get paid for guarding the passage. Iran on the other hand wants to hold control over the traffic via permissions and passage only via (Iranian) approved corridors. Both parties for now avoid a return to an outright war as it occurred before signing the Memorandum of Understanding/cease-fire mid-June. From a market point of view, the oil price regained its status as guide for other markets. At $78/b Brent oil again trades well off the corrective lows touched early this month, but at the same time they show no outright panic yet. As a closely watched pointer especially for European energy costs, the reference Dutch natural gas contract (TTF) today returned north of €50/MWh (currently €51), the highest level in over a month. If sustained, these kind of levels might again erode the more benign inflation picture as it emerged from the June (EMU) inflation data. Developments can change quickly in both directions, but for now the by default momentum is for yields to grind higher. In a session devoid of any other market-relevant economic news, German yields currently add between 5 bps (2-y) and 2 bps (30-y). Money markets discount a 90% probability for a next 25 bps ECB step by September. UK Gilts even slightly underperform with yields rising between 9 bps (2-y) and 5.5 bps (30-y) as higher inflation expectations question the BoE's wait-and-see stance and as markets still try to get some insight in the budget intentions of the new Burnham government. US yields also trade with an upward bias, but in a more modest way than in the UK and Europe. US yields add between 1-3 bps across the curve. US June CPI figures (tomorrow) and Kevin Warsh's first Testimony for Congress (tomorrow and on Wednesday) are first 'autonomous' US topics to guide US interest rate markets. At least on (European) equity markets, the reaction to the new flaring up of Middle East tensions happens orderly. The Eurostoxx 50 trades little changed. US indices open mixed with the Nasdaq underperforming (-0.60%), capturing some of the nervousness in chip-stocks in Asia (in particular South Korea), this morning. In line with recent price action, geopolitical noise hardly leaves any traces on the major USD cross rates. DXY trades little changed near 100.9. EUR/USD even gains marginally in a technically irrelevant move (EUR/USD 1.1425). The yen reverses most of Friday's gains as markets understood that it is premature to expect a change in the strategy of the Government Pension Investment Fund to yield any positive flows to support Japanese government bonds and/or the yen. USD/JPY rebounded north of 162. Sterling slightly underperforms the euro, with EUR/GBP trading near 0.853 despite a rising interest rate advantage for the UK currency.
News & Views
Sources told Reuters that Japan's Government Pension Investment Fund, the world's largest, has no immediate plans to change its target asset allocations. Markets jumped to such a conclusion after finance minister Katayama last Friday said the government was pondering ways to encourage pension funds, including the GPIF, to make substantially greater investments in Japanese financial assets. It prompted sudden JPY, JGB and Japanese equity strength on expectations for potentially huge capital flows to be repatriated back into the local market. What the likes of GPIF could do, the sources said, is to work within existing allowable ranges compared to the benchmark portfolio. For domestic bonds, for example, the fund is allowed a 6 ppt deviation range around the 25% target allocation. Both the yen and JGBs today give back about half of Friday's gains.
Indian inflation accelerated more than expected to 4.38% in June from 3.93% in May. That brings it above the central bank's 4% (+/- 2 ppt deviation range) mid-point target for the first time in about one-and-a-half years. Food inflation, amongst others, quickened to 5.32% with a strong spring harvest being offset by expectations for El Niño related supply disruptions. Transport prices jumped as well, from 1.75% to 4.31%. Prices in restaurants and accommodation meanwhile are picking up a 50% increase in commercial cooking gas prices at the start of the month. Core inflation held at 3.9%. The central bank left its policy rate unchanged at 5.25% during last month's meeting but raised its inflation forecast to 5.1% for the fiscal year ending in March. Governor Malhotra said monetary policy would only respond if price pressures broadened although it is watching oil and food price developments closely.