Sample Category Title
Markets Face Triple Threat as AI Trade Cracks, Fed Risks Rise, and Iran Conflict Escalates
Markets ended the week in a far more defensive mood than they began it. After spending May climbing steadily on the back of AI enthusiasm, resilient economic growth, and hopes for easing geopolitical tensions, investors were suddenly forced to confront three separate risks at once. A sharp correction in technology stocks, renewed concerns that US interest rates could stay higher for longer, and a fresh escalation in the Middle East combined to sour sentiment across global markets.
The first blow came from the AI trade itself. Broadcom's unexpected revenue miss triggered a wave of profit-taking across semiconductor and AI-related stocks, reminding investors that valuations built on extraordinary growth expectations leave little room for disappointment. At the same time, a much stronger-than-expected US employment report reinforced confidence in the economy but also reduced the urgency for Federal Reserve easing. Meanwhile, hopes for a US-Iran peace agreement faded rapidly as military exchanges resumed around the Strait of Hormuz, reviving concerns over energy supplies and inflation.
The combination of these three developments leaves markets entering the new week at a critical juncture. A deeper correction in equities, further rises in Treasury yields, and renewed gains in oil prices would reinforce the emerging risk-off environment.
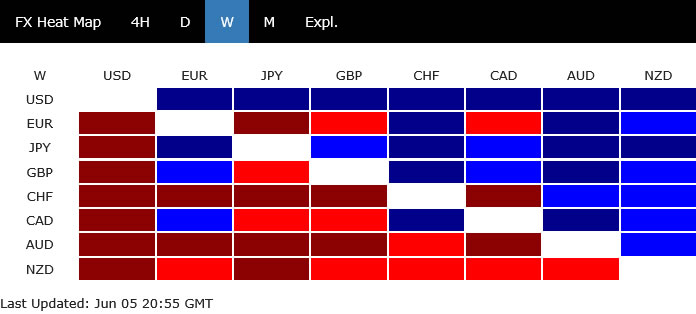
In the currency markets, Dollar finished the week as the clear winner, benefiting from all three major themes that dominated markets. If yields continue holding above 4.5% and equity markets remain under pressure, Dollar appears well positioned to extend its rally in the near term.
Yen ranked second, benefiting from geopolitical uncertainty despite renewed pressure against Dollar, while Sterling came in third.
At the other end of the spectrum, Kiwi was the weakest performer, followed by Aussie and Swiss Franc. The commodity-linked currencies suffered as risk appetite deteriorated, while Swiss Franc was weighed down by the prospect that elevated global inflation pressures could force other central banks to remain restrictive while the SNB stays comfortably on hold. Euro and Loonie occupied the middle ground.
AI Trade Faces Major Reality Check Again
The most immediate trigger for Friday's risk-off move came from the technology sector, where NASDAQ suffered its worst single-day decline in more than a year, falling around 4%. The selloff was led by semiconductor stocks after Broadcom reported fiscal second-quarter revenue below expectations. While the miss itself was relatively modest, it hit a market that had become increasingly priced for perfection after months of AI-driven gains.
Broadcom's earnings were particularly important because the company sits at the heart of the AI investment boom, supplying custom chips to major technology companies including Google and Meta. Investors have been willing to pay increasingly rich valuations across the semiconductor sector based on expectations that AI-related spending would continue accelerating almost indefinitely. Broadcom's miss challenged that assumption and reminded markets that even the strongest growth stories remain vulnerable to execution risks.
The reaction quickly spread across the broader AI ecosystem. Major semiconductor names including Micron and Arm Holdings suffered sharp declines as investors rushed to lock in profits after a prolonged rally. The speed of the selloff highlighted just how crowded the AI trade had become. When expectations are built around uninterrupted growth, even a small disappointment can trigger an outsized market response.
Importantly, the selloff does not necessarily signal the end of the AI theme. Corporate investment in AI infrastructure remains robust, and demand for computing power continues to grow rapidly. However, the market may be entering a new phase where investors become more selective and less willing to reward companies simply for AI exposure. Execution, earnings delivery, and valuation discipline are likely to matter much more than they have over the past year.
The broader concern is that technology stocks have been carrying a disproportionate share of market performance. As long as AI-related companies were moving higher, investors were willing to overlook geopolitical risks, rising oil prices, and concerns about interest rates. If leadership from the technology sector begins to fade, broader equity indices may become more vulnerable to those macroeconomic headwinds. Friday's selloff may therefore represent more than a simple earnings reaction—it could be a meaningful test of the market's dominant investment narrative.
Strong Payrolls Keep Higher-for-Longer Risks Alive
The second challenge facing markets came from the US labor market. Friday's non-farm payrolls report delivered another clear sign that the economy remains far more resilient than many investors had expected. Employment rose 172k in May, nearly double consensus forecasts, while April's figure was revised sharply higher to 179k. The unemployment rate held steady at 4.3%, and labor-force participation was unchanged, reinforcing the view that labor-market conditions remain stable despite tighter financial conditions and elevated energy costs.
The report does not necessarily point to an imminent Fed rate hike. However, it does reinforce the central bank's ability to remain patient. Fed officials have increasingly shifted their focus toward whether elevated oil prices and broader energy-related costs will generate second-round inflation effects. A resilient labor market gives policymakers the luxury of waiting to see how those pressures develop rather than feeling compelled to support growth.
That rise in yields may ultimately prove more important than the payrolls report itself. Throughout the past year, equity markets have been able to coexist with elevated interest rates because investors believed eventual easing remained likely. If stronger economic data continue to delay that easing cycle, valuation pressures could begin mounting across risk assets, particularly in the technology sector where expectations remain exceptionally high.
The next major test may come from inflation data. Payrolls alone are unlikely to force the Fed into another rate increase. But if upcoming CPI reports show that higher oil prices are beginning to feed into broader inflation measures, markets may become much more serious about pricing additional tightening. Friday's jobs report therefore did not change the policy outlook dramatically, but it kept the higher-for-longer narrative firmly alive.
Peace Hopes Fade as Middle East Conflict Re-Escalates
The third threat facing markets may ultimately prove the most important. For much of the past two weeks, investors had been pricing in the possibility of a US-Iran agreement, or at least an extension of the existing ceasefire framework. Those expectations helped drive oil prices lower and supported broader risk sentiment. By the end of the week, however, the anticipated breakthrough had failed to materialize.
Instead, military tensions intensified again across the region. US President Donald Trump had repeatedly suggested that negotiations were progressing toward a significant agreement. Yet no deal emerged, and events on the ground moved in the opposite direction. According to US military officials, American forces struck Iranian coastal radar and surveillance facilities after intercepting drones launched toward shipping lanes near the Strait of Hormuz. The strikes marked another escalation in a conflict that many investors had hoped was moving toward de-escalation.
Iran responded by claiming responsibility for attacks on US military installations in the Gulf and targeting vessels operating near the Strait. The Revolutionary Guard said missiles were launched against US bases in Bahrain and Kuwait, while also firing on tankers attempting to transit the strategic waterway. Although US and regional air defenses intercepted many of the projectiles, the incidents underscored how fragile the security situation remains.
The Strait of Hormuz remains one of the world's most important energy chokepoints, handling a substantial share of global crude exports. Markets had become comfortable with the assumption that some form of political settlement would repoen the channel. The latest military exchanges challenge that assumption and reintroduce the possibility of a prolonged period of disruption.
For now, oil prices remain below the psychologically important $100 level. But the market's reaction in coming days may prove critical. A renewed rise in crude prices would not only threaten global growth but also complicate the inflation outlook facing central banks. The longer energy prices remain elevated, the greater the risk of second-round effects spreading through transportation, manufacturing, and consumer prices. In that scenario, the Middle East conflict could become the link connecting all three threats currently confronting markets: weaker risk appetite, higher inflation, and tighter monetary policy.
NASDAQ and S&P 500 Enter Critical Technical Tests
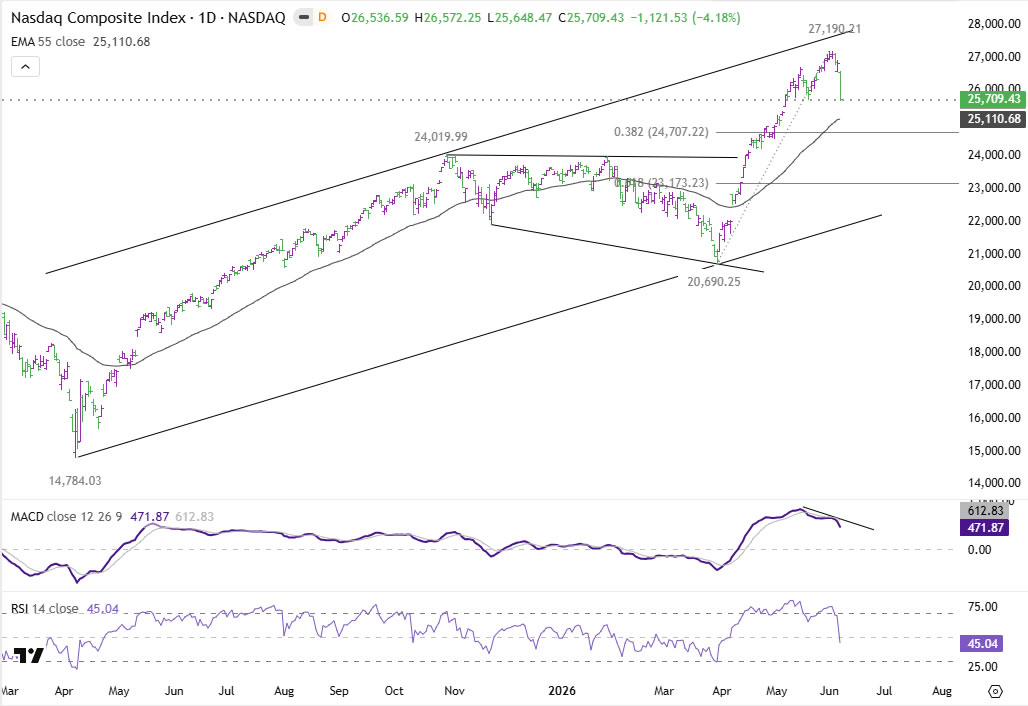
Friday's sharp selloff has left NASDAQ at an important technical juncture. Immediate focus is now on 25,709.43 support. Firm break below that level would argue that the rally from 20,690.25 has completed at 27,190.21, on bearish divergence in D MACD. The next downside target would be 38.2% retracement of 20,690.25 to 27,190.21 at 24,707.22.
That level is expected to provide meaningful support on the first test and could trigger a rebound attempt. However, if sellers remain firmly in control and the fibonacci level breaks decisively, the correction could deepen toward 61.8% retracement at 23173.23.
For now, near term risk for NASDAQ will stay on the downside as long as 27,190.21 resistance holds, in case of recovery.
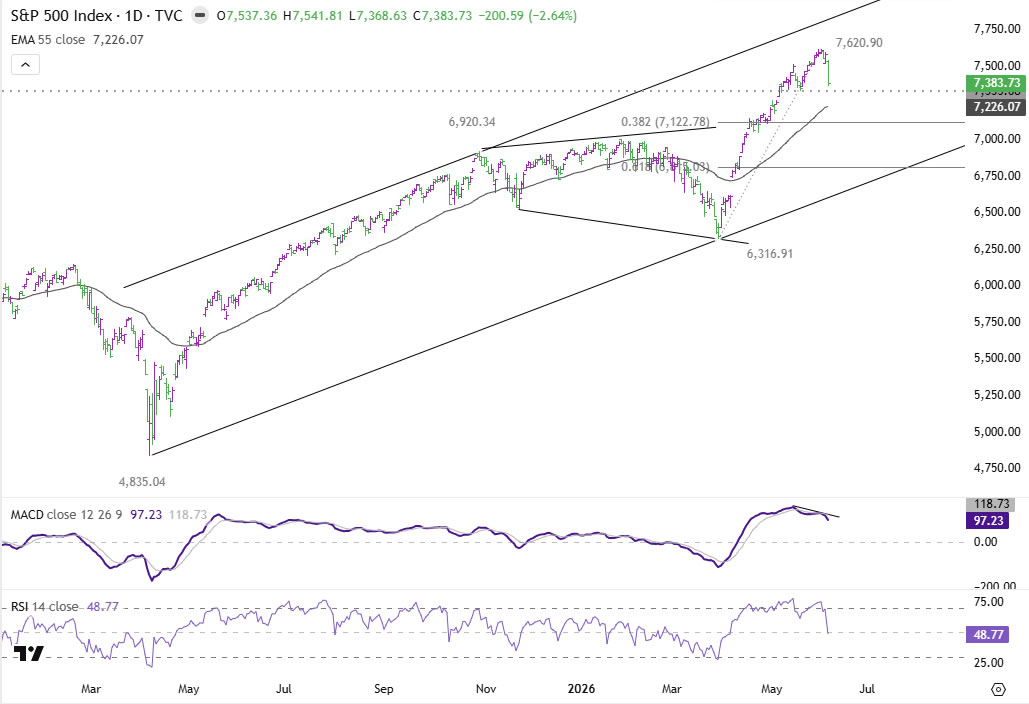
S&P 500 is showing a similar technical structure. Immediate attention is now on support at 7,383.73. Sustained break below that level would suggest that the rally from 6,316.91 has completed at 7,620.90 and that a broader correction phase is underway.
In that scenario, the index would target 38.2% retracement of 6,316.91 to 7,620.90 at 7,122.78. Like NASDAQ, strong support is expected there initially. However, a decisive break would expose the deeper 61.8% retracement at 6,815.03. For now, near-term risks remain tilted to the downside as long as 7,620.90 resistance caps any recovery attempts.
Treasury Yields Rebound as Fed Patience Gets Reinforced
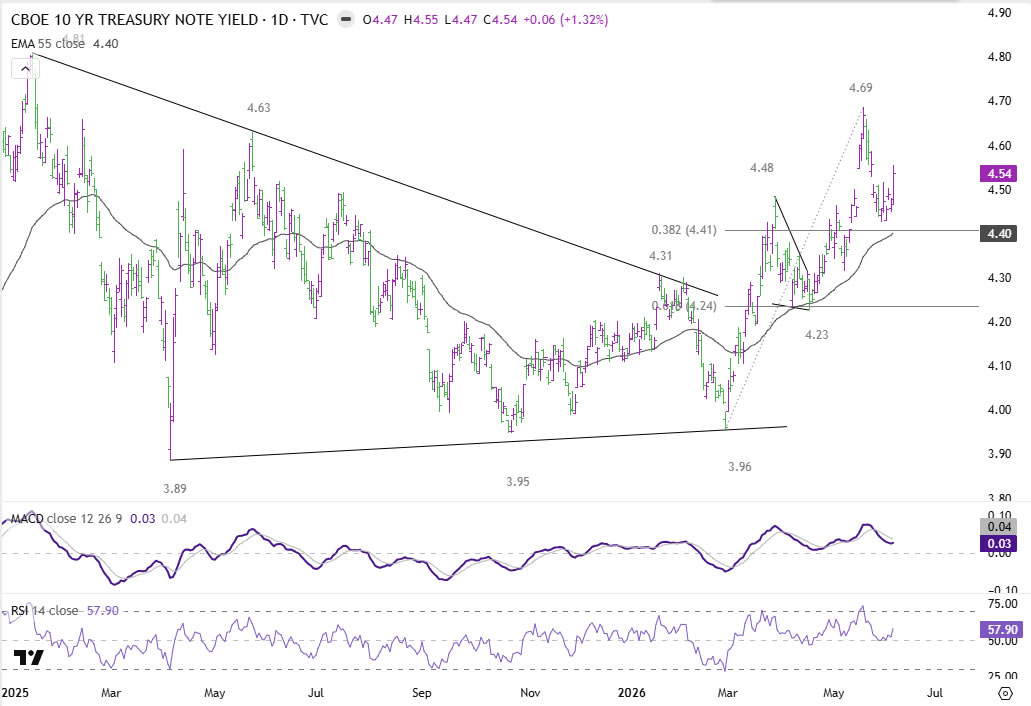
US Treasury yields ended the week with renewed upward momentum after the stronger-than-expected payrolls report reinforced confidence in the resilience of the economy. The 10-year yield surged back above the 4.5% threshold, extending a rebound that had already begun earlier in the week as investors reassessed the likelihood of higher-for-longer interest rates.
Technically, last week's rebound is significant because it confirmed strong support around the 4.40-4.41 area. The 38.2% retracement of 3.96 to 4.69 at 4.41 held firmly, while the rising 55 D EMA, now near 4.40, also provided support. The successful defense of this zone suggests that the pullback from 4.69 was corrective rather than the start of a downtrend.
For now, the preferred view remains that price action from 4.69 high is forming a consolidation pattern within the upward move that began at 3.96. An immediate breakout above 4.69 is not the base case. Instead, some further range trading between roughly 4.40 and 4.70 appears likely as markets digest incoming inflation data, Fed commentary, and developments in the Middle East. Nevertheless, as long as support around 4.40 continues to hold, the broader bias remains tilted toward higher yields rather than lower ones.
Dollar Index Reclaims 100 as Technical Outlook Turns More Constructive
Dollar's resurgence gathered momentum last week as stronger US economic data, rising Treasury yields, and deteriorating risk sentiment combined to support the greenback. Dollar Index surged through the psychologically important 100 level and closed the week firmly above it, reinforcing the impression that the correction from April's lows may have already run its course. While the rally was initially driven by stronger-than-expected payrolls data, broader market developments have increasingly begun to work in Dollar's favor.
Technically, the most important development was the strong defense of 55 D EMA (now at 98.89). The rebound from 97.62 was sharp and decisive, suggesting that the decline from 100.64 was merely corrective. Under this interpretation, the advance from 95.55 remains intact, with Dollar now positioned to retest the 100.64 high in the near term.
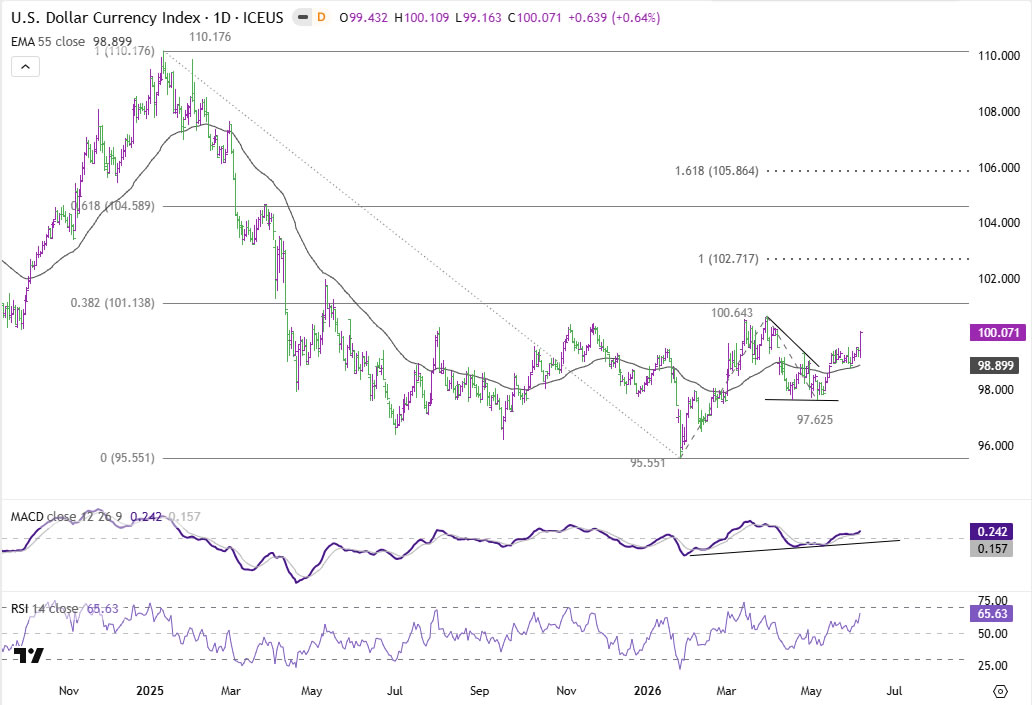
Stable Treasury yields and a moderate risk-off environment alone could be sufficient to lift Dollar Index back toward 100.64. However, the more interesting scenario is one in which equity weakness accelerates and geopolitical risks intensify. In that case, the combination of safe-haven demand and higher yields could generate a much stronger move in the greenback.
Decisive break above 100.64 would significantly strengthen the bullish case. It would target the 100% projection of 95.55 to 100.64 from 97.62 at 102.71 and, more importantly, bring the key 38.2% retracement of the decline from the 2025 high at 110.17 to 95.55 at 101.38 into play.
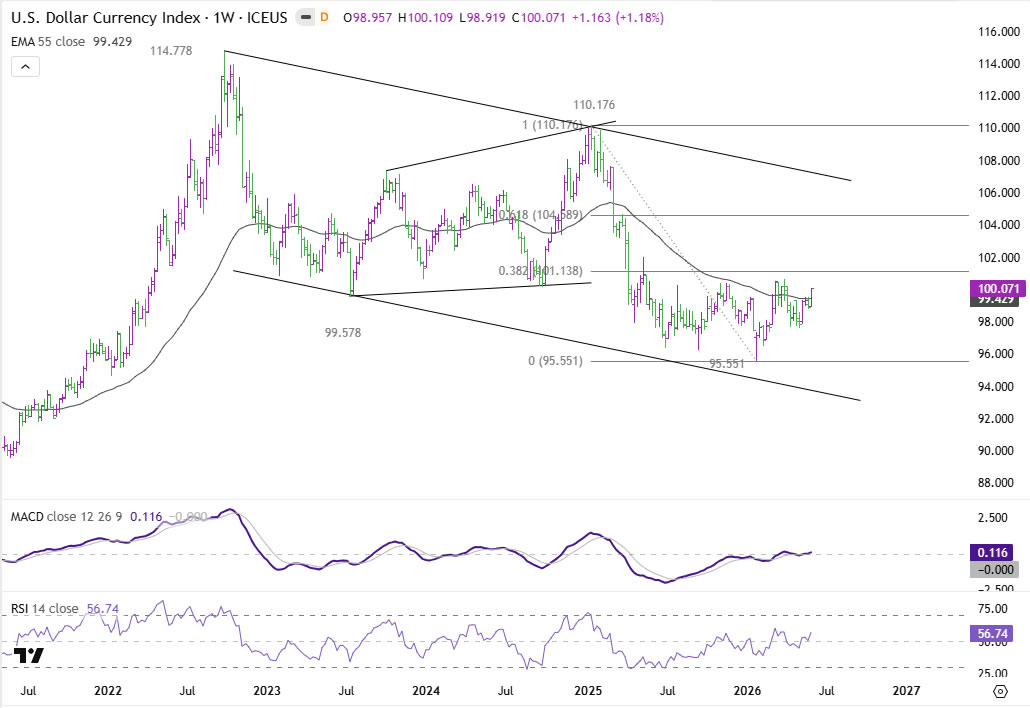
If Dollar Index can establish itself above 101.38, the implications would extend beyond the near-term outlook. Such a move would strongly suggest that the downtrend from 110.17 (2025 high) has already completed and that a medium-term rally is underway. Under that scenario, the next major target would become 61.8% retracement at 104.58.
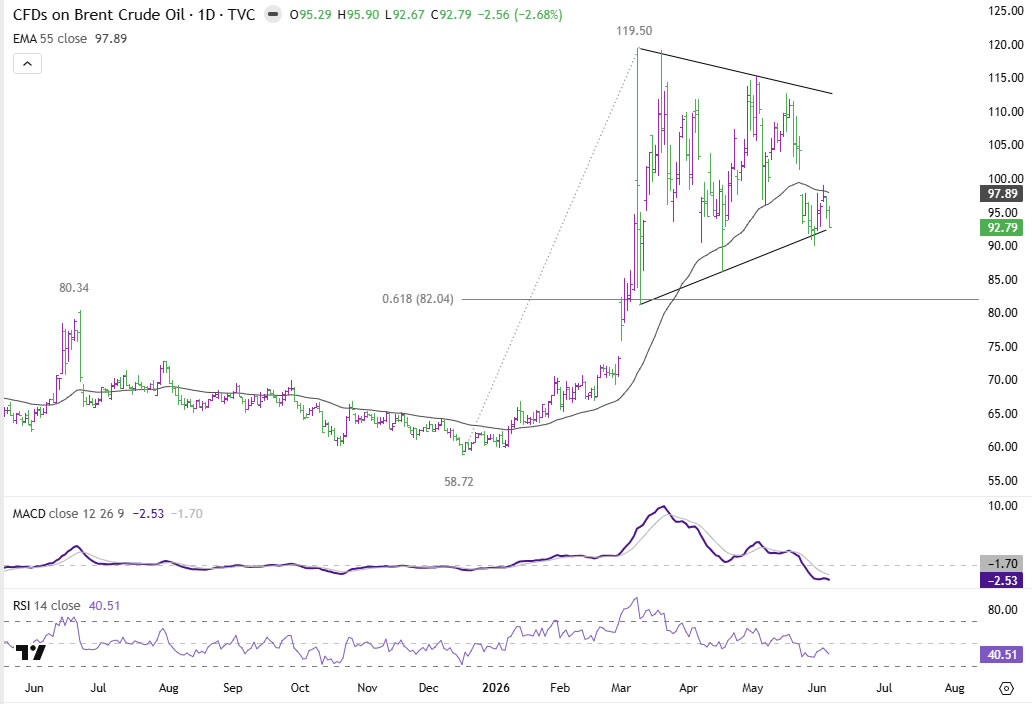
Brent Oil Holds Key to Next Risk-Off Wave
One of the most important developments to watch in the coming days is the reaction of oil markets to the renewed military escalation in the Middle East. For much of the past two weeks, Brent crude drifted lower as investors increasingly priced in the possibility of a US-Iran agreement or at least a ceasefire extension. That optimism has now been challenged by fresh military strikes and renewed attacks around the Strait of Hormuz, putting the geopolitical risk premium back into focus.
Technically, Brent remains below the key 96.29 resistance level, leaving the near-term bias tilted modestly to the downside. As long as that resistance holds, the fall from 98.88 can continue and markets may retain some hope that diplomacy eventually regains traction.
However, firm break above 96.29 would argue that the decline from 98.88 has already completed as a three-wave corrective move. That would signal resumption of the rebound from 89.93 and shift attention toward much more important resistance levels above. The first major target would be the 38.2% retracement of 115.30 to 89.93 at 99.62.
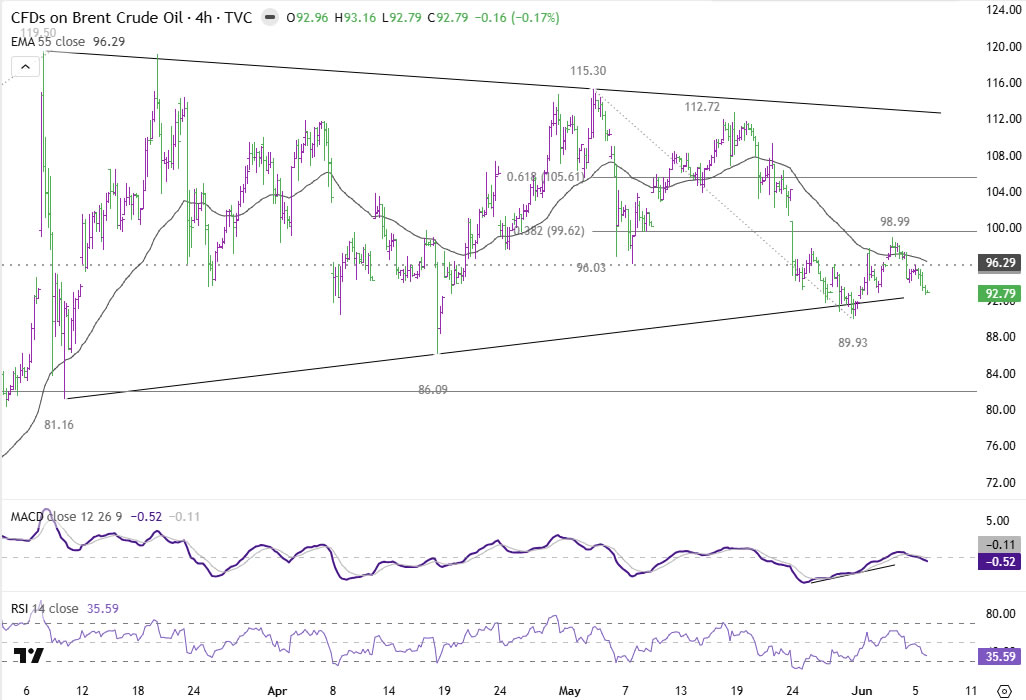
Decisive break above 99.62 would strongly suggest that oil markets are beginning to price in a more persistent disruption risk again. Such a move would likely reinforce concerns about second-round inflation effects, complicate the outlook for major central banks, and place renewed pressure on equities and bond markets.
Should Brent break through 99.62, attention would quickly turn toward 61.8% retracement level at 105.61. That scenario would represent a major headwind for global risk sentiment.
AUD/USD Weekly Report
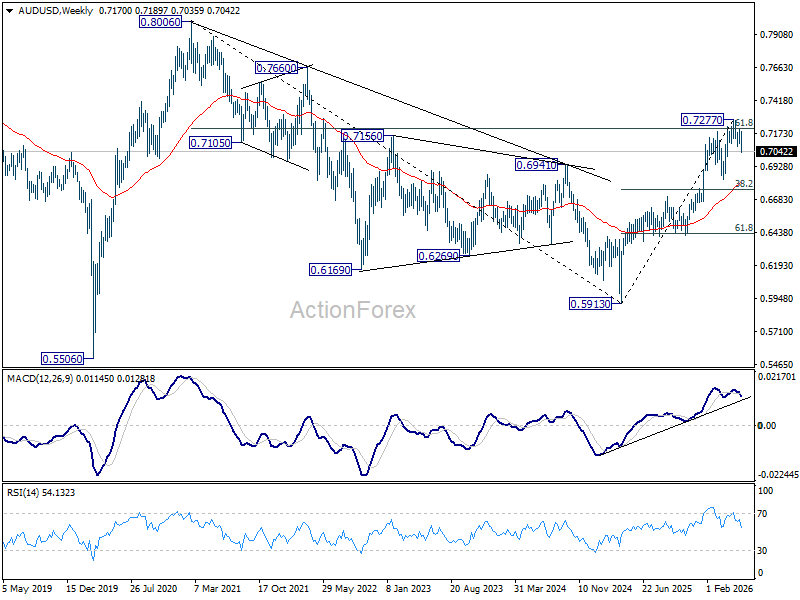
AUD/USD's fall from 0.7277 resumed by breaking through 0.7076 last week. Initial bias is now on the downside this week for 100% projection of 0.7277 to 0.7076 from 0.7200 at 0.6999. Firm break there will target 161.8% projection at 0.6875. Near term risk will stay on the downside as long as 0.7200 resistance holds, in case of recovery.
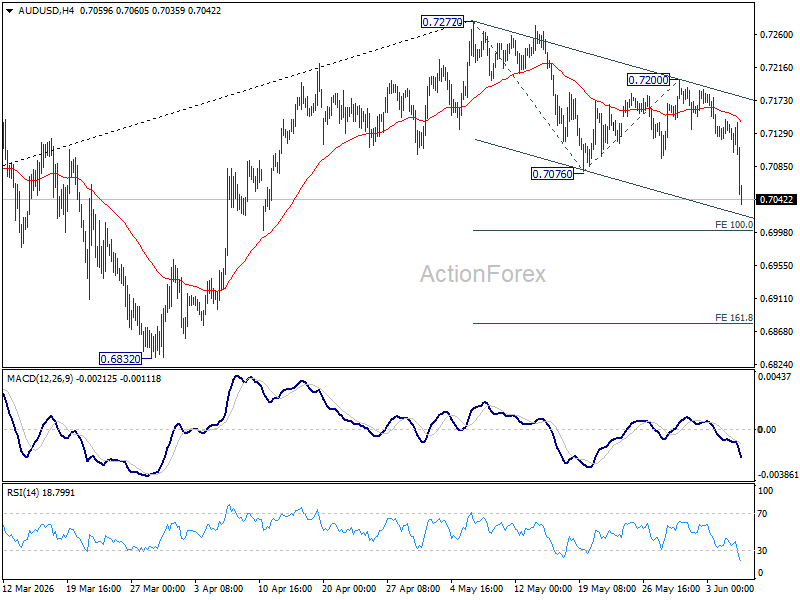
In the bigger picture, considering bearish divergence condition in D MACD, a medium term top could be formed at 0.7277 after failing to sustain above 61.8% retracement o f0.8006 (2021 high) to 0.5913 (2024 low) at 0.7206). Deeper fall could be seen to 38.2% retracement of 5913 to 0.7277 at 0.6756 as a correction. But strong support should be seen there to bring rebound. Consolidations would continue below 0.7277 for a while.
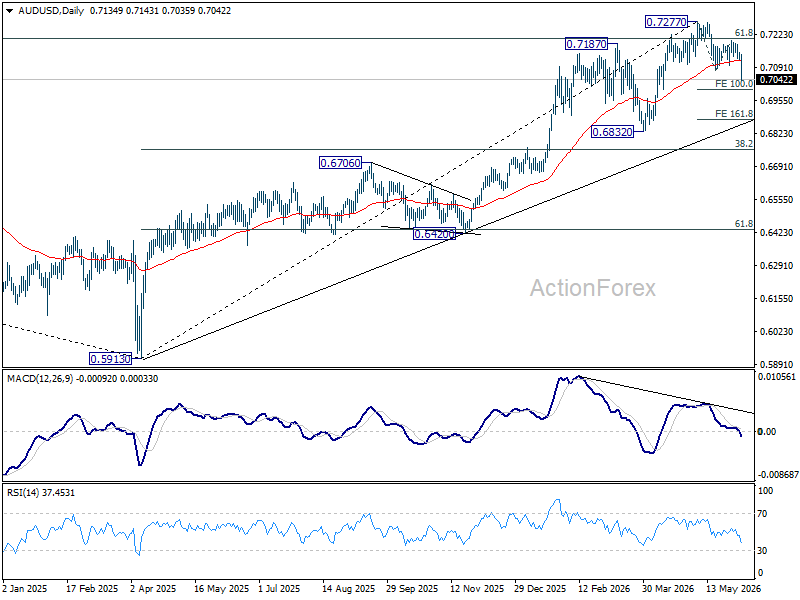
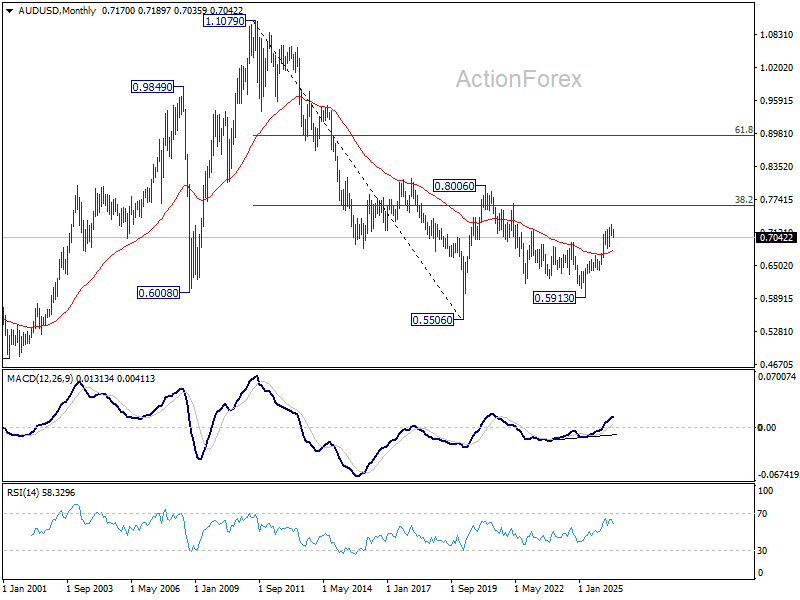
In the long term picture, rise from 0.5913 is seen as the third leg of the whole pattern from 0.5506 (2020 low). It's still early to judge if this is an impulsive or corrective pattern. But in either case, further rise should be seen back to 0.8006 and possibly above. This will remain the favored case as long as 55 W EMA (now at 0.6804) holds.
EUR/USD Weekly Outlook
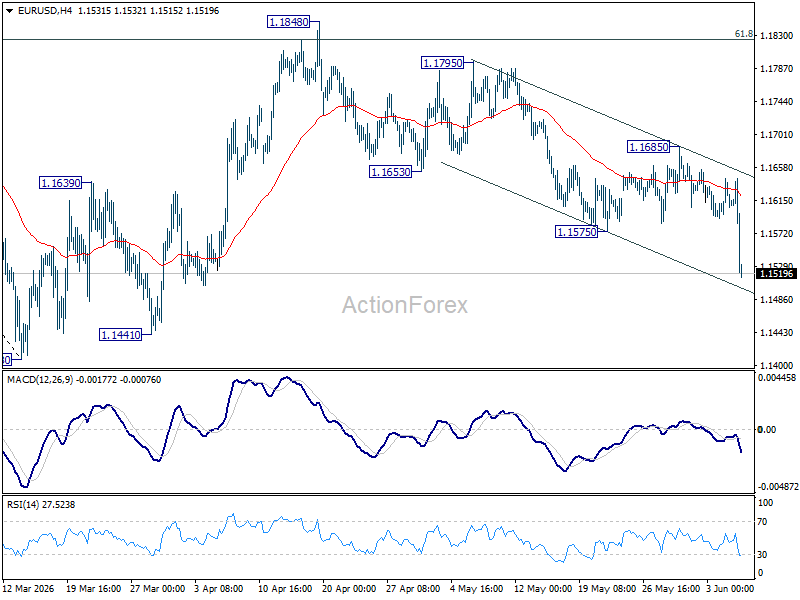
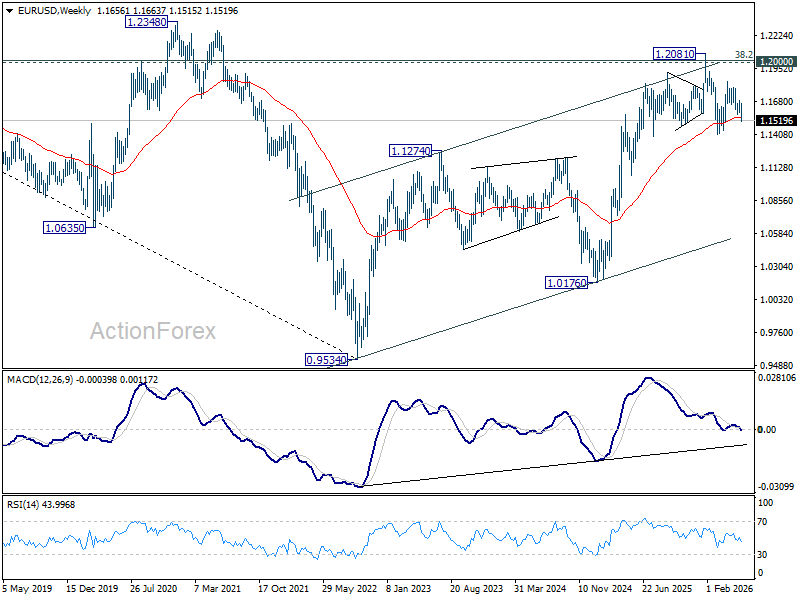
EUR/USD's fall from 1.1848 resumed by breaking through 1.1575 last week. Initial bias is back on the downside this week for retesting 1.1408 first. For now, risk will stay on the downside as long as 1.1685 resistance holds, in case of recovery.
In the bigger picture, the strong support from 38.2% retracement of 1.0176 to 1.2081 at 1.1353 suggests that the pullback from 1.2081 is more likely a corrective move. Strong support was also found in 55 W EMA (now at 1.1542). Focus is back on 1.2 key cluster resistance level. Decisive break there will carry long term bullish implications. Nevertheless, break of 1.1408 support will revive the case of medium term bearish trend reversal.
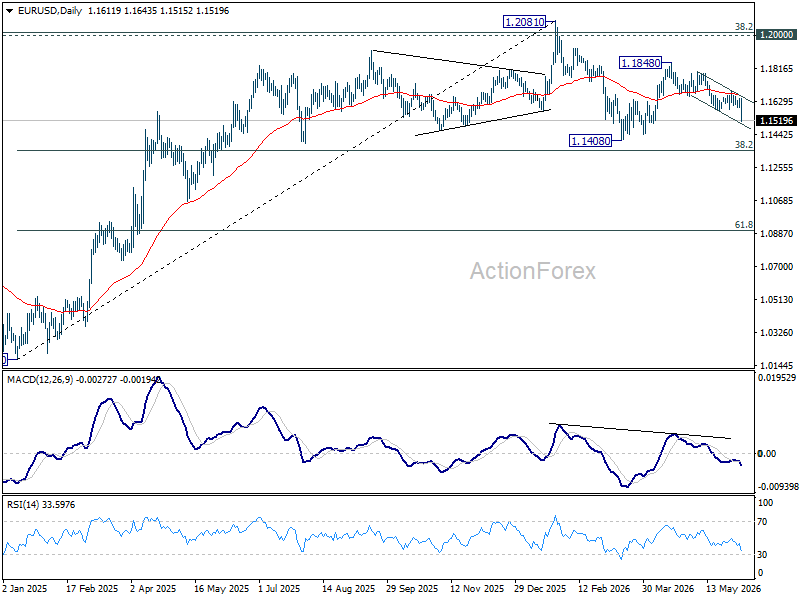
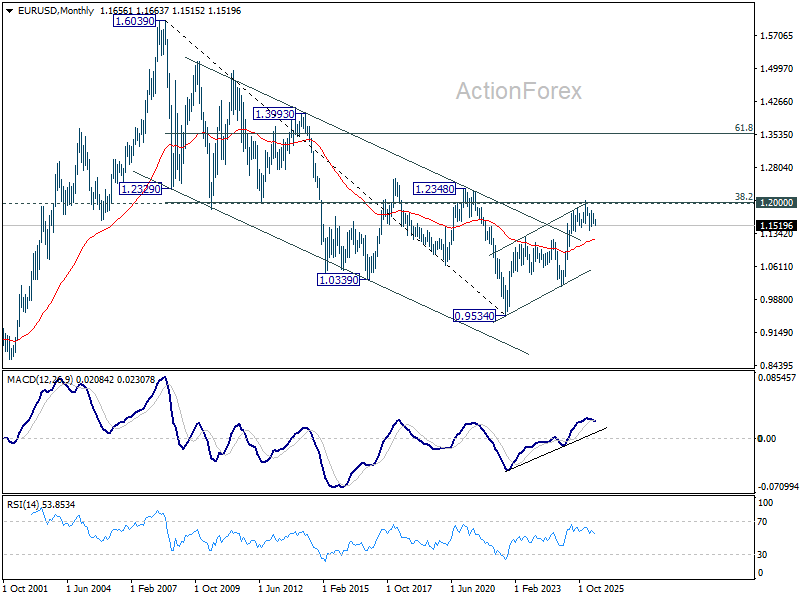
In the long term picture, 38.2% retracement of 1.6039 to 0.9534 at 1.2019, which is close to 1.2000 psychological level is the key for the outlook. Rejection by this level will keep the multi decade down trend from 1.6039 (2008 high) intact, and keep outlook neutral at best. However, decisive break of 1.2000/19, will suggest long term bullish trend reversal, and target 61.8% retracement at 1.3554.
USD/JPY Weekly Outlook
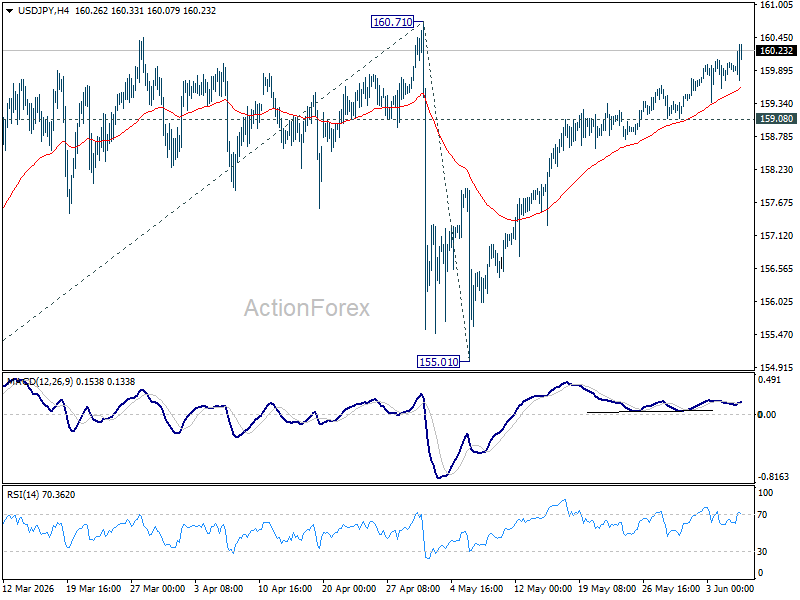
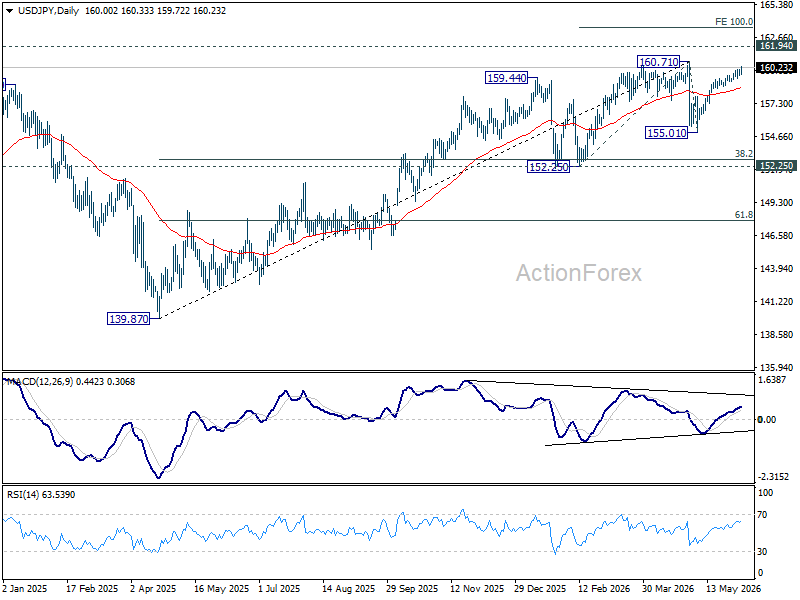
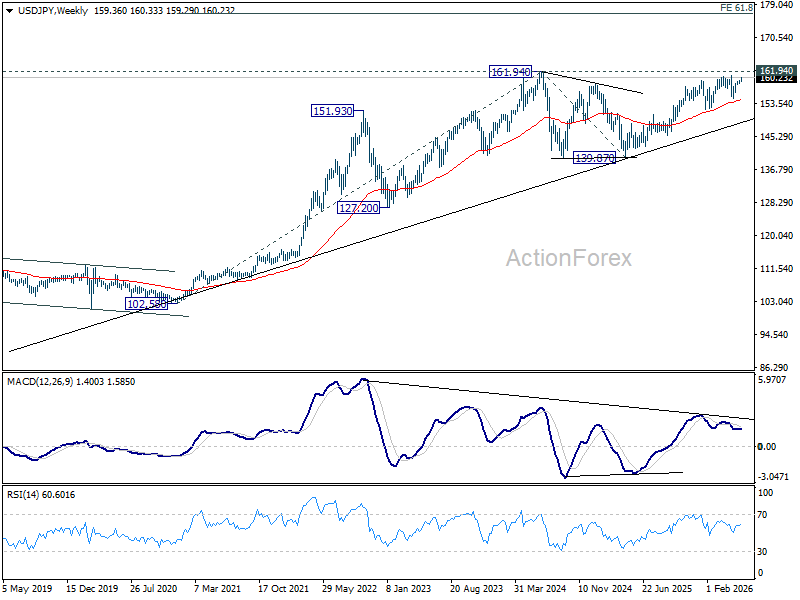
USD/JPY's rise from 155.01 extended higher last week and there is not sign of topping yet. Initial bias remains on the upside for 160.71. Strong resistance is still expected from there to limit upside. Break of 159.08 will turn bias back to the downside the extend the corrective pattern from 160.71 with the third leg. However, decisive break of 160.71 will confirm up trend resumption. That should push USD/JPY through 161.94 to 100% projection of 152.25 to 160.71 from 155.01 at 163.47 next.
In the bigger picture, for now, corrective pattern from 161.94 (2024 high) is still seen as completed at 139.87. Rise from there is seen as resuming the long term up trend. So, break of 161.94 is expected at a later stage to resume the long term up trend. However, sustained break of 55 W EMA (now at 154.75) will dampen this view and bring deeper fall back towards 139.87 to extend the pattern from 161.94.
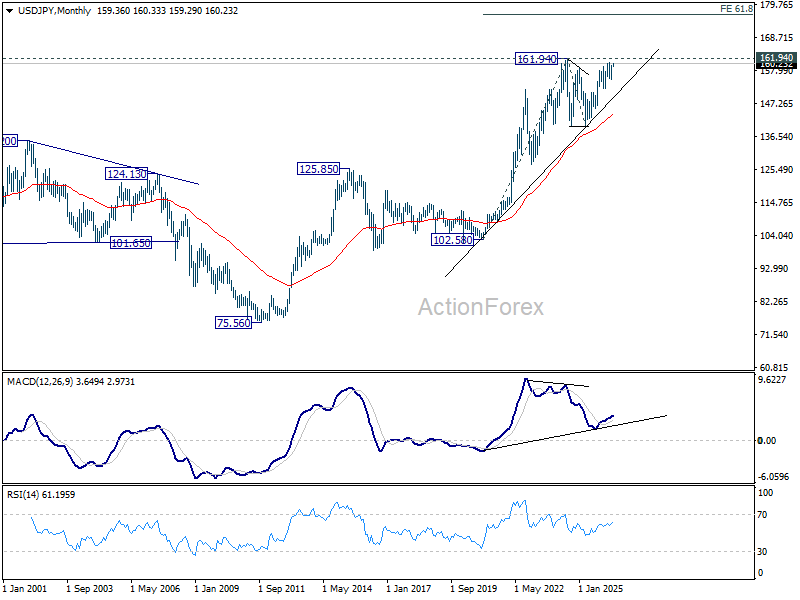
In the long term picture, up trend from 75.56 (2011 low) is still in progress and might be ready to resume. Firm break of 161.94 will target 61.8% projection of 102.58 (2020 low) to 161.94 (2024 high) from 139.87 at 176.55 in the medium term. Long term outlook will stay bullish as long as 139.87 support holds, even in case of deep pullback.
GBP/USD Weekly Outlook
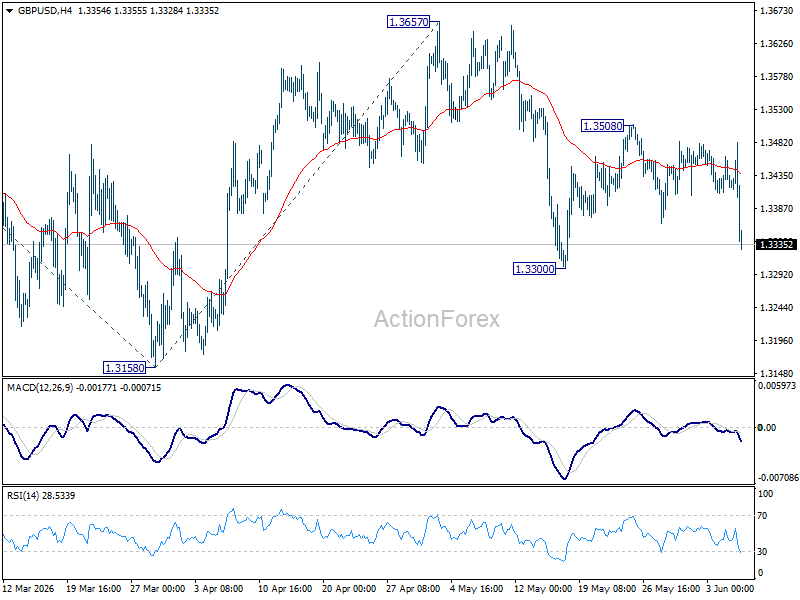
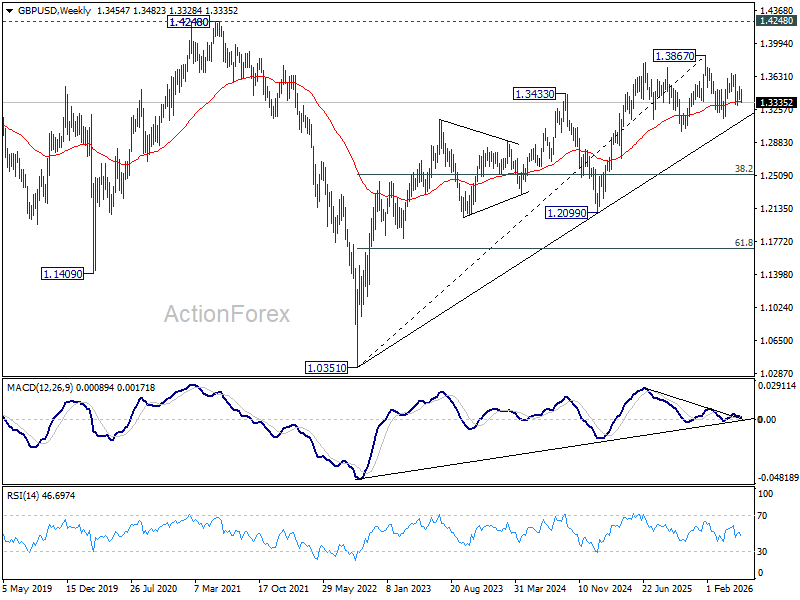
GBP/USD's late decline last week suggests rejection by 55 D EMA (now at 1.3453), which is a bearish signal. But downside is contained above 1.3300 support. Initial bias stays neutral this week first. Break of 1.3300 will target a retest on 1.3158. Firm break there will extend the whole fall from 1.3867 to 100% projection of 1.3867 to 1.3158 from 1.3657 at 1.2948. For now, risk is mildly on the downside as long as 1.3508 resistance holds, in case of recovery.
In the bigger picture, price actions from 1.3867 are a corrective pattern within the broader up trend from 1.0351 (2022 low). With 1.3008 support intact, medium term bullishness is maintained and break of 1.3867 is in favor for a later stage, towards 1.4248 key resistance (2021 high). However, firm break of 1.3008 will at least bring deeper fall to 38.2% retracement of 1.0351 to 1.3867 at 1.2524, with increased risk of bearish reversal.
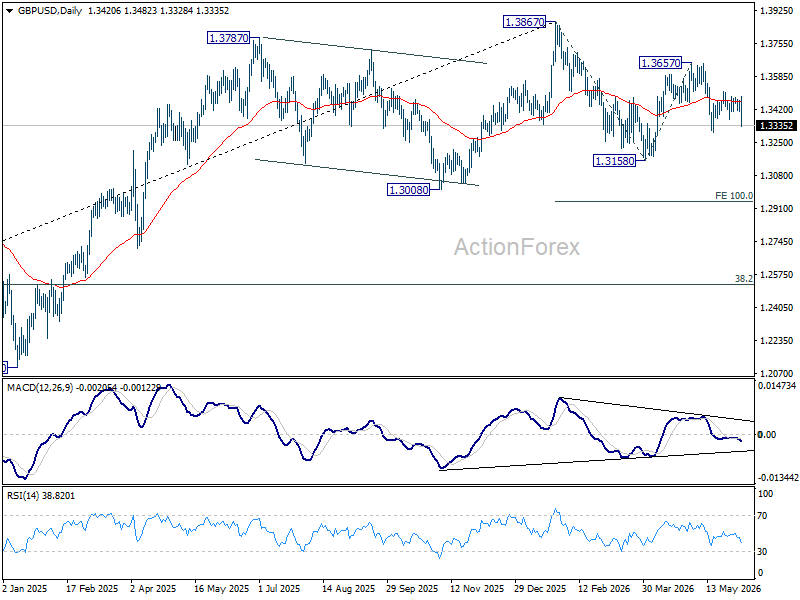
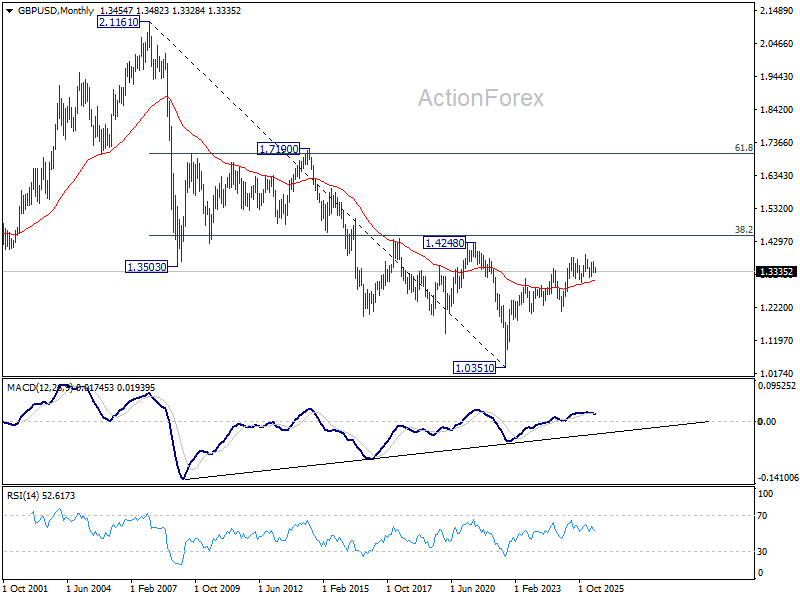
In the long term picture, as long as 1.4248/4480 resistance zone holds (38.2% retracement of 2.1161 to 1.0351 at 1.4480), the long term outlook will remain bearish. That is, price actions from 1.0351 are seen as a corrective pattern to down trend from 2.1161 (2007 high) only. Nevertheless, decisive break of 1.4248/4480 will be a strong sign of long term bullish reversal.
USD/CHF Weekly Outlook
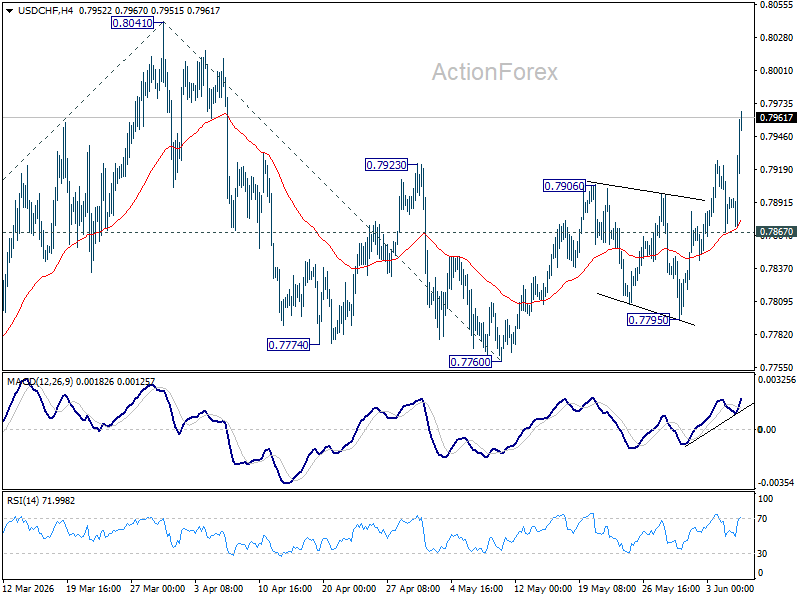
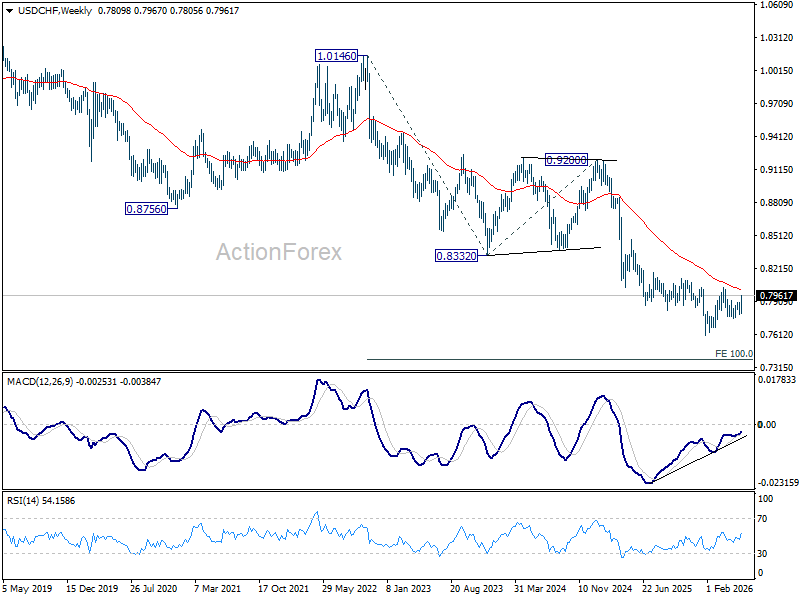
USD/CHF's rebound from 0.7760 resumed last week and accelerated through 0.7906 resistance. The development suggests that fall from 0.8041 has completed as a correction to 0.7760. Initial bias stays on the upside this week for retesting 0.8041 first. For now, risk will stay on the upside as long as 0.7867 minor support holds, in case of retreat.
In the bigger picture, while a medium term bottom was formed at 0.7603, it's still early to call for bullish trend reversal. As long as 38.2% retracement of 0.9200 (2025 high) to 0.7603 at 0.8213 holds, the larger down trend could still continue through 0.7603 at a later stage. However, firm break of 0.7603 will argue that the trend has reversed and turn focus to 0.8332 support turned resistance (2023 low) for confirmation.
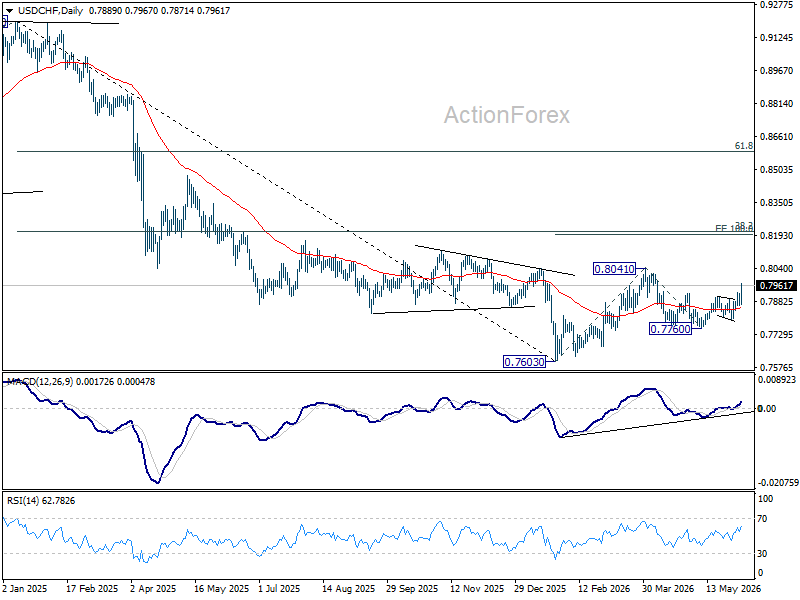
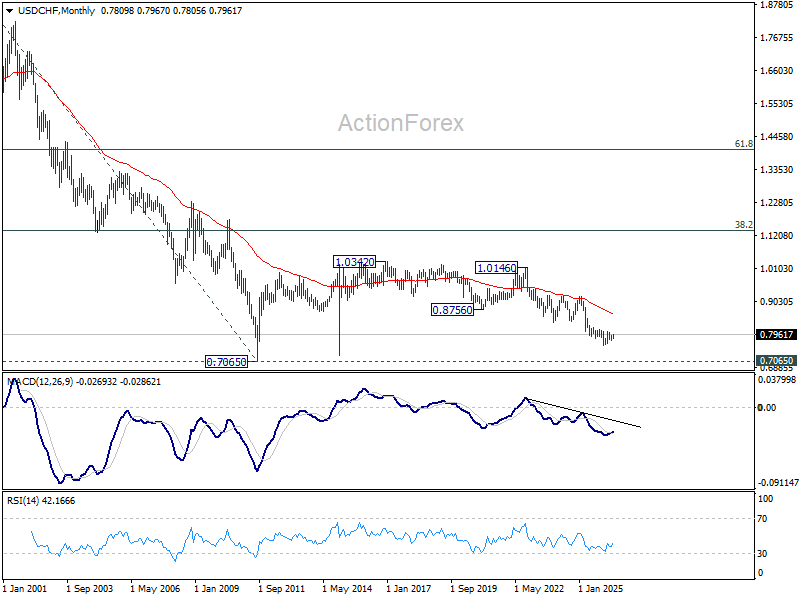
In the long term picture, price action from 0.7065 (2011 low) are seen as a corrective pattern to the multi-decade down trend from 1.8305 (2000 high). It's uncertain if the fall from 1.0342 is the second leg of the pattern, or resumption of the downtrend. But in either case, outlook will stay bearish as long as 0.8756 support turned resistance holds (2021 low). Retest of 0.7065 should be seen next.
AUD/USD Weekly Report
AUD/USD's fall from 0.7277 resumed by breaking through 0.7076 last week. Initial bias is now on the downside this week for 100% projection of 0.7277 to 0.7076 from 0.7200 at 0.6999. Firm break there will target 161.8% projection at 0.6875. Near term risk will stay on the downside as long as 0.7200 resistance holds, in case of recovery.
In the bigger picture, considering bearish divergence condition in D MACD, a medium term top could be formed at 0.7277 after failing to sustain above 61.8% retracement o f0.8006 (2021 high) to 0.5913 (2024 low) at 0.7206). Deeper fall could be seen to 38.2% retracement of 5913 to 0.7277 at 0.6756 as a correction. But strong support should be seen there to bring rebound. Consolidations would continue below 0.7277 for a while.
In the long term picture, rise from 0.5913 is seen as the third leg of the whole pattern from 0.5506 (2020 low). It's still early to judge if this is an impulsive or corrective pattern. But in either case, further rise should be seen back to 0.8006 and possibly above. This will remain the favored case as long as 55 W EMA (now at 0.6804) holds.
USD/CAD Weekly Outlook
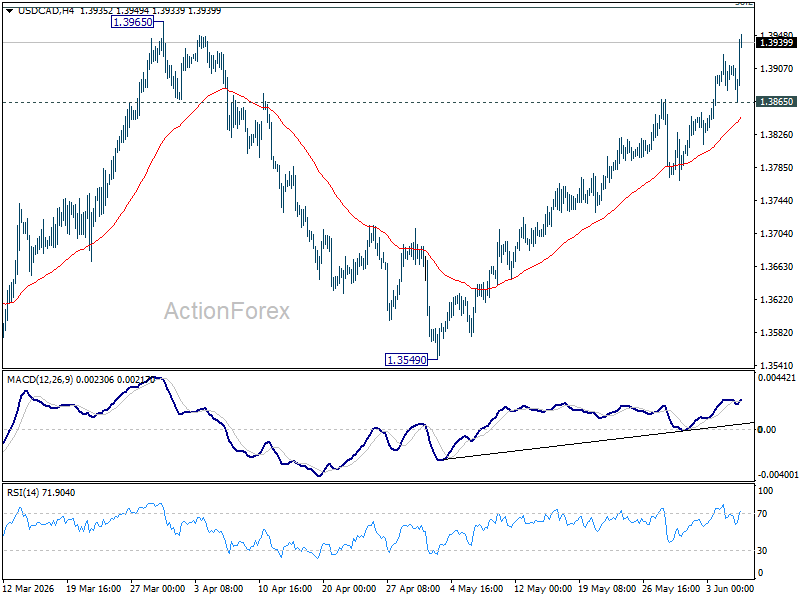
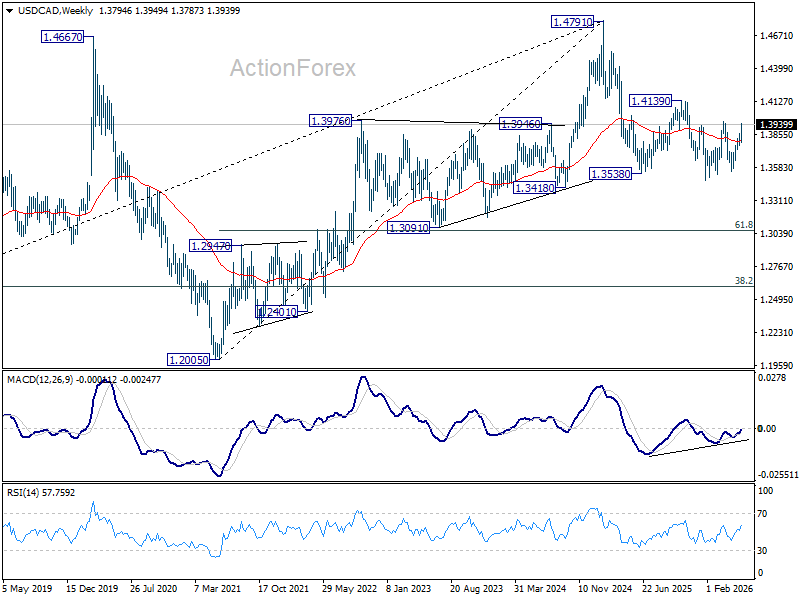
USD/CAD's rally from 1.3549 accelerated higher last week and there is no sign of topping yet. Initial bias stays on the upside this week for 38.2% retracement of 1.4791 to 1.3480 at 1.3981. Decisive break there will carry larger bullish implications and target 61.8% retracement at 1.4290 next. On the downside, below 1.3865 minor support will turn intraday bias neutral first.
In the bigger picture, price actions from 1.4791 are seen as a corrective pattern to the whole up trend from 1.2005 (2021 low). Rejection by 38.2% retracement of 1.4791 to 1.3480 at 1.3981 will keep the decline intact, and bring another fall through 1.3480 at a later stage. However, firm break of 1.3981 will argue that the decline has completed, and set up further rise back to retest 1.4791 instead.
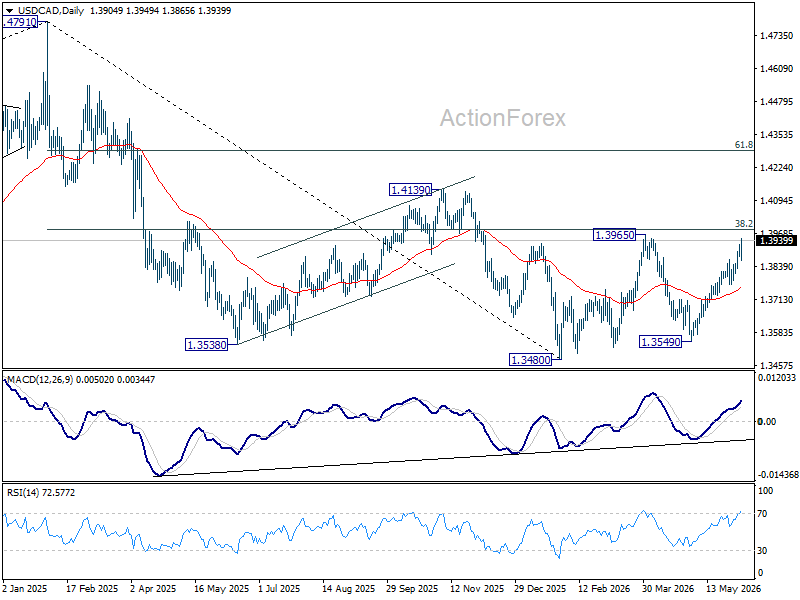
In the long term picture, rising 55 M EMA (now at 1.3588) remains intact. Thus, up trend from 0.9056 (2007 low) could still be in progress. However, considering bearish divergence condition M MACD, sustained trading below 55 M EMA will argue that the up trend has completed with five waves up to 1.4791, and turn medium term outlook bearish for correction to 38.2% retracement of 0.9056 to 1.4791 at 1.2600.
GBP/JPY Weekly Outlook
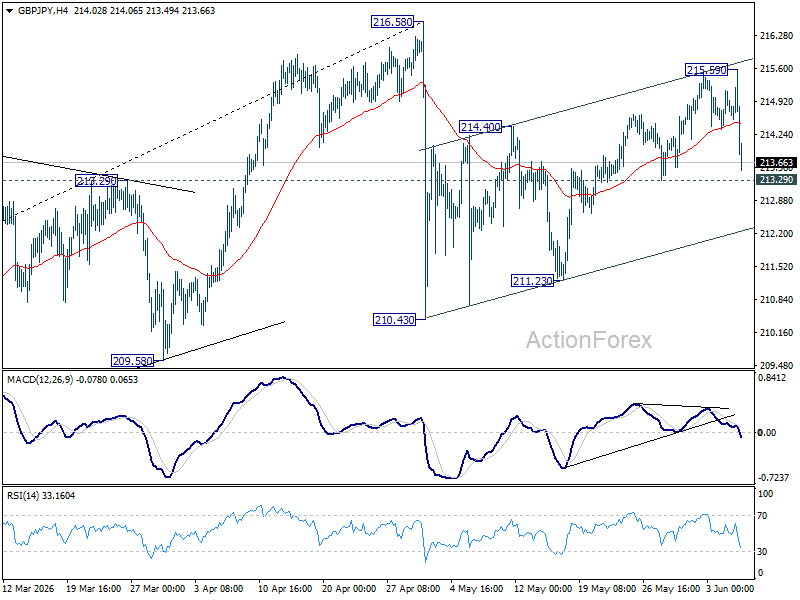
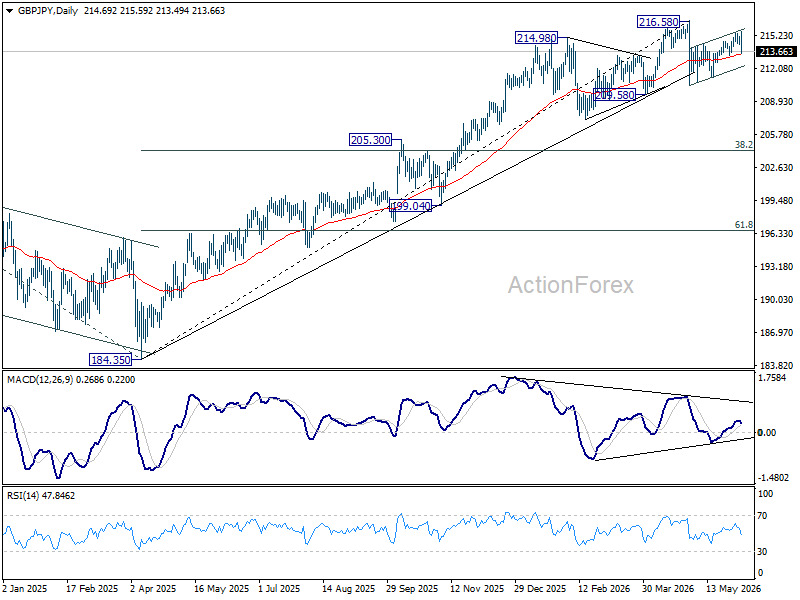
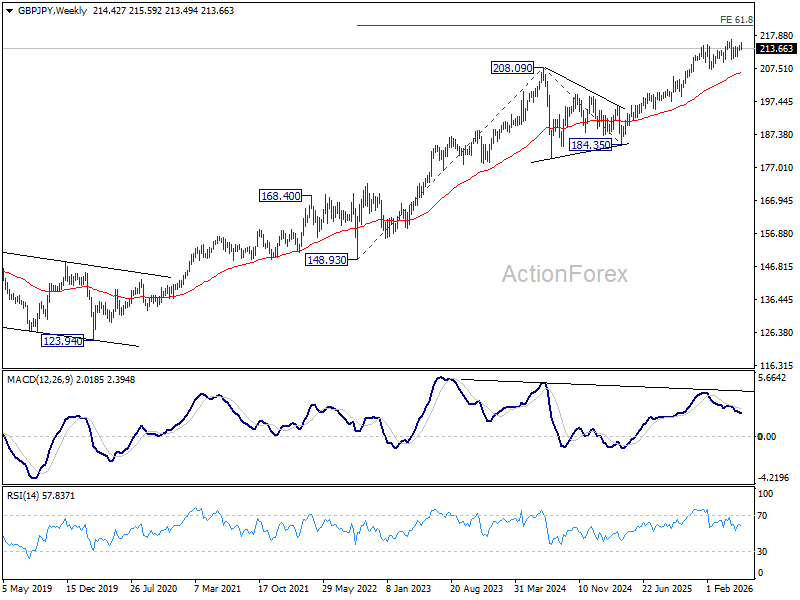
GBP/JPY edged higher to 215.59 last week but retreated sharply since then. Initial bias remains neutral this week first. Rebound from 210.43 is seen as the second leg of the corrective pattern from 216.58, and could have completed at 215.59 already. Break of 213.29 will suggest that the third leg has started and target 210.43 support. For now, risk will be mildly on the downside as long as 215.59 holds, in case of recovery.
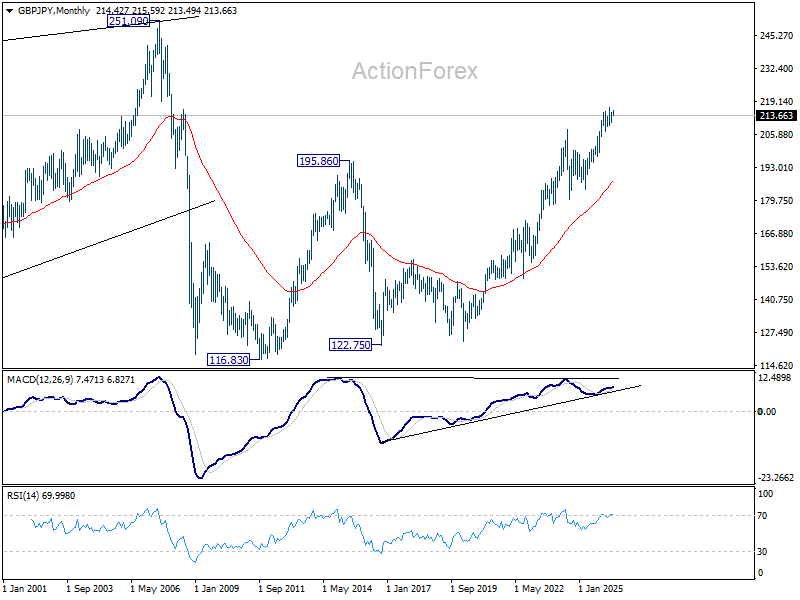
In the bigger picture, there is no clear sign of trend reversal yet. The long term up trend could still extend to 61.8% projection of 148.93 (2022 low) to 208.09 (2024 high) from 184.35 at 220.90 on resumption. However, sustained break of 55 W EMA (now at 206.53) will argue that it's already in medium term down trend for 184.35 support.
In the long term picture, up trend from 116.83 (2011 low) is in progress. Next target is 251.09 (2007 high). This will remain the favored case as long as 55 M EMA (now at 186.82) holds.
EUR/JPY Weekly Outlook
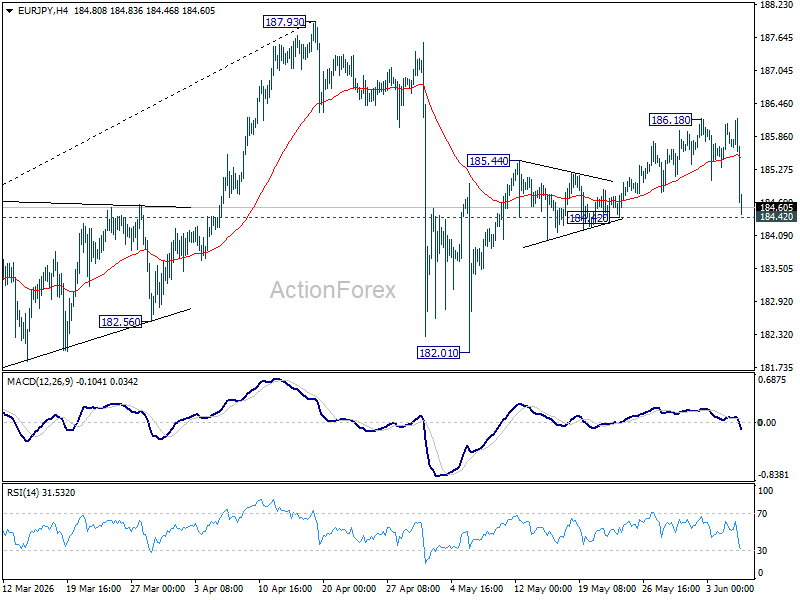
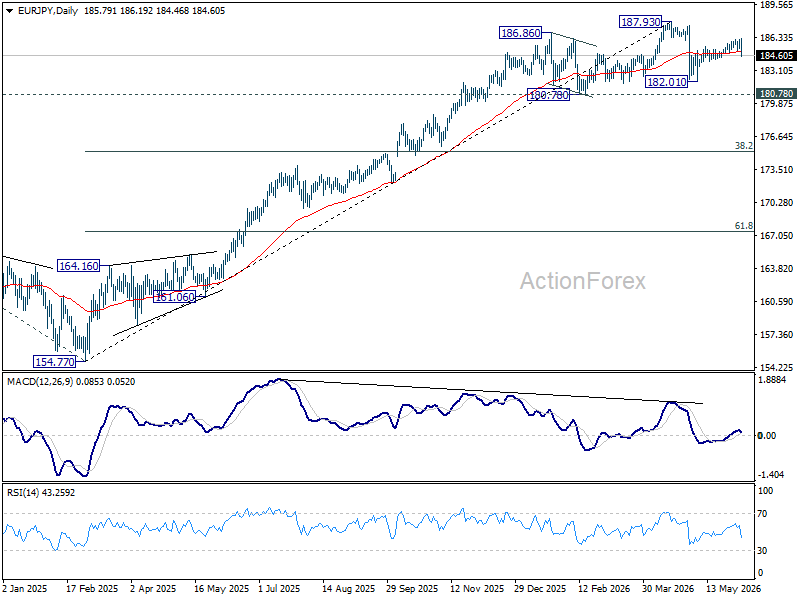
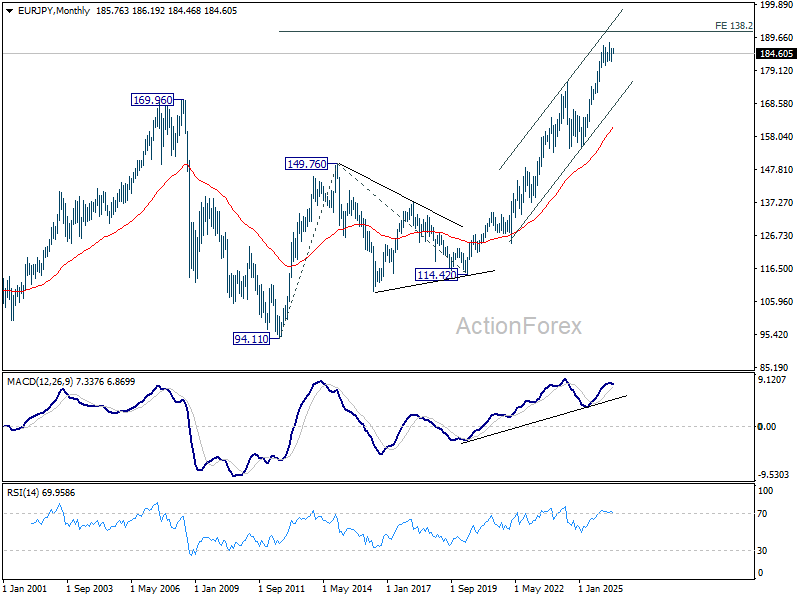
EUR/JPY edged higher to 186.18 but retreated sharply since then. Downside is still supported above 184.42 and initial bias remains neutral this week first. Rebound from 182.01 is seen as the second leg of the corrective pattern from 187.93, and could have completed at 186.18 already. Firm break of 184.42 will argue that the third leg has already started. Intraday bias will be back on the downside for 182.01 support and below. Risk will now stay mildly on the downside as long as 186.18 holds, in case of recovery.
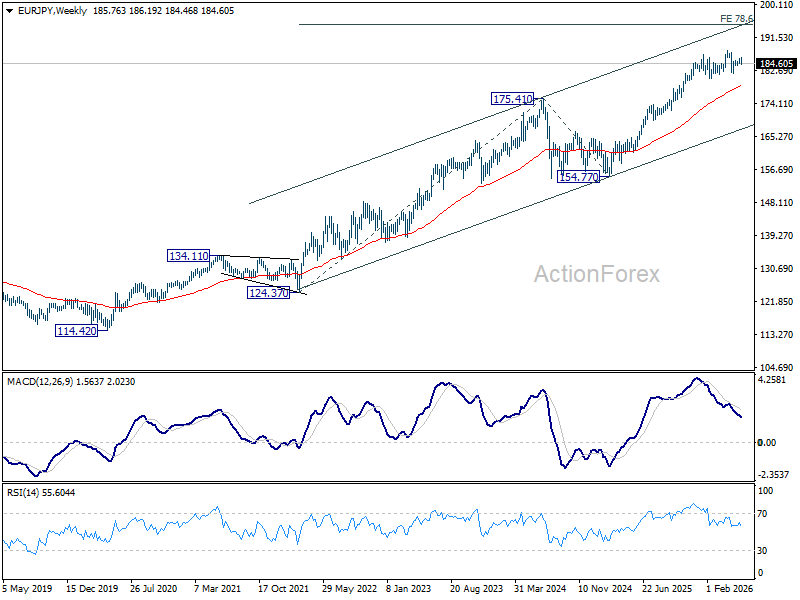
In the bigger picture, there is no sign of reversal yet. Uptrend from 114.42 (2020 low) is still expected to resume at a later stage to 78.6% projection of 124.37 (2022 low) to 175.41 (2025 high) from 154.77 at 194.88. However, sustained break of 55 W EMA (now at 178.53) will argue that it's already in a medium term down trend to 175.41 resistance turned support and below.
In the long term picture, up trend from 94.11 (2021 low) is in progress. Next target is 138.2% projection of 94.11 to 149.76 (2014 high) from 114.42 (2020 low) at 191.32. This will remain the favored case as long 55 W EMA (now at 178.53) holds.
EUR/GBP Daily Outlook
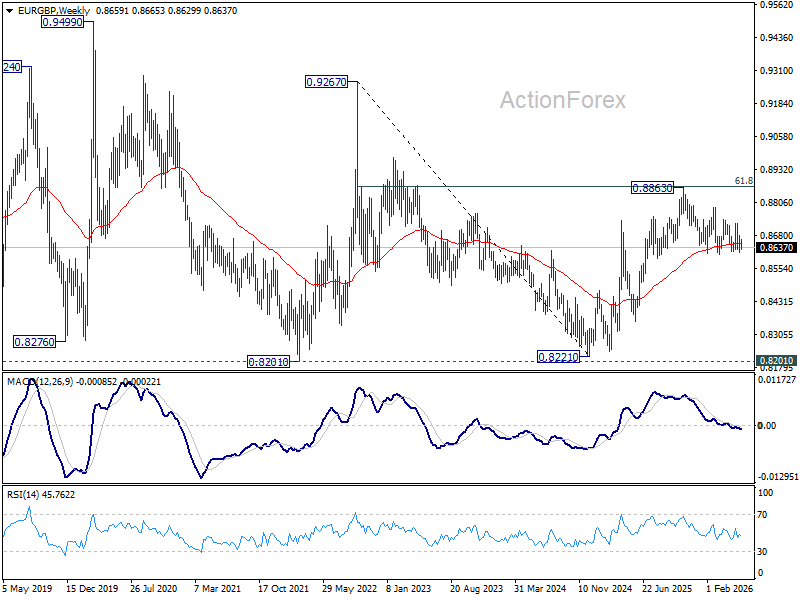
Sideway trading continues in EUR/GBP and outlook is unchanged. Initial bias stays neutral this week. On the downside, decisive break of 0.8610 support will revive the case of bearish trend reversal. On the upside, break of 0.8728 resistance will bring stronger rally back towards 0.8740 resistance.
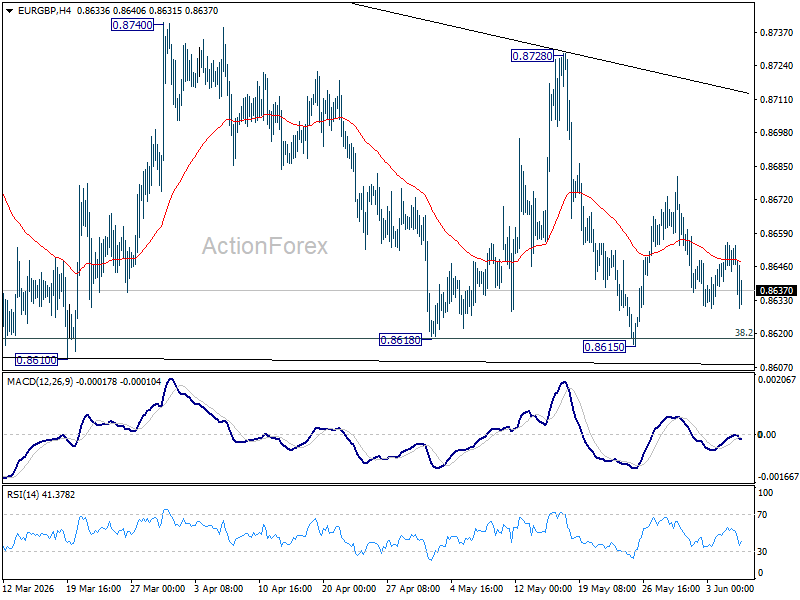
In the bigger picture, focus is staying on 38.2% retracement of 0.8821 to 0.8863 at 0.8618. Strong rebound from there will retain medium term bullishness. Rise from 0.8221 should resume through 0.8863 at a later stage. Nevertheless, sustained break of 0.8618 will confirm that whole rise from 0.8221 has completed at 0.8863. Deeper decline should then be seen to 61.8% retracement at 0.8466 at least.
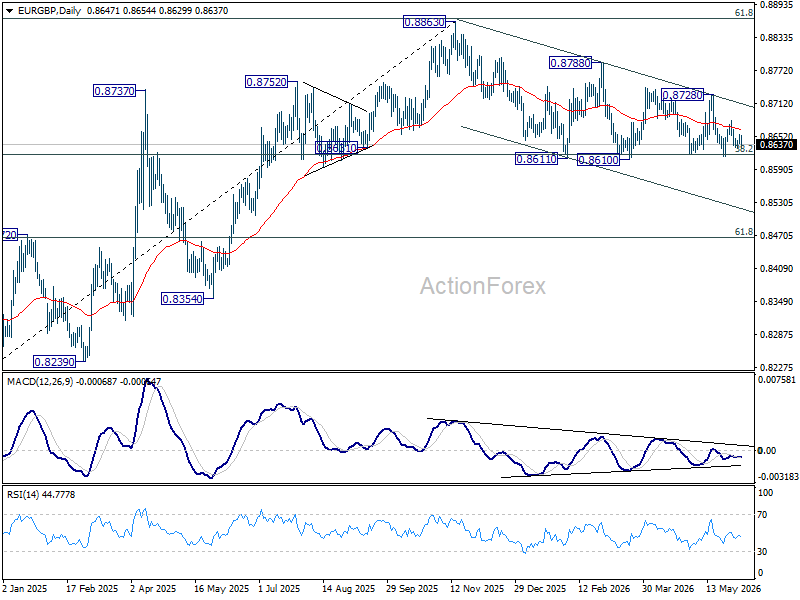
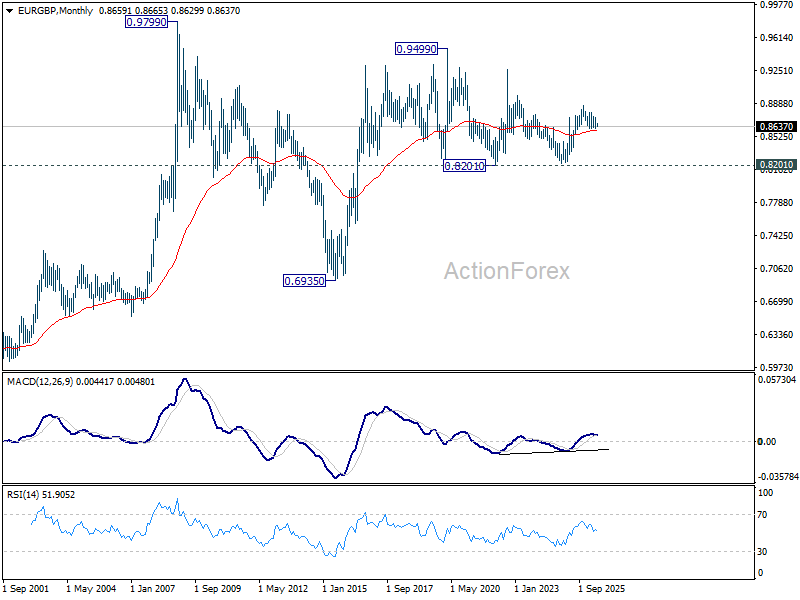
In the long term picture, price action from 0.9499 (2020 high) is seen as part of the long term range pattern from 0.9799 (2008 high). Range trading should continue between 0.8201 and 0.9499, until there is clear signal of imminent breakout.