
Sample Category Title
Gold: The Edge of the Precipice Is Drawing Ever Closer
- An unfavourable background is weighing on gold prices.
- The Fed has not ruled out a July rate hike.
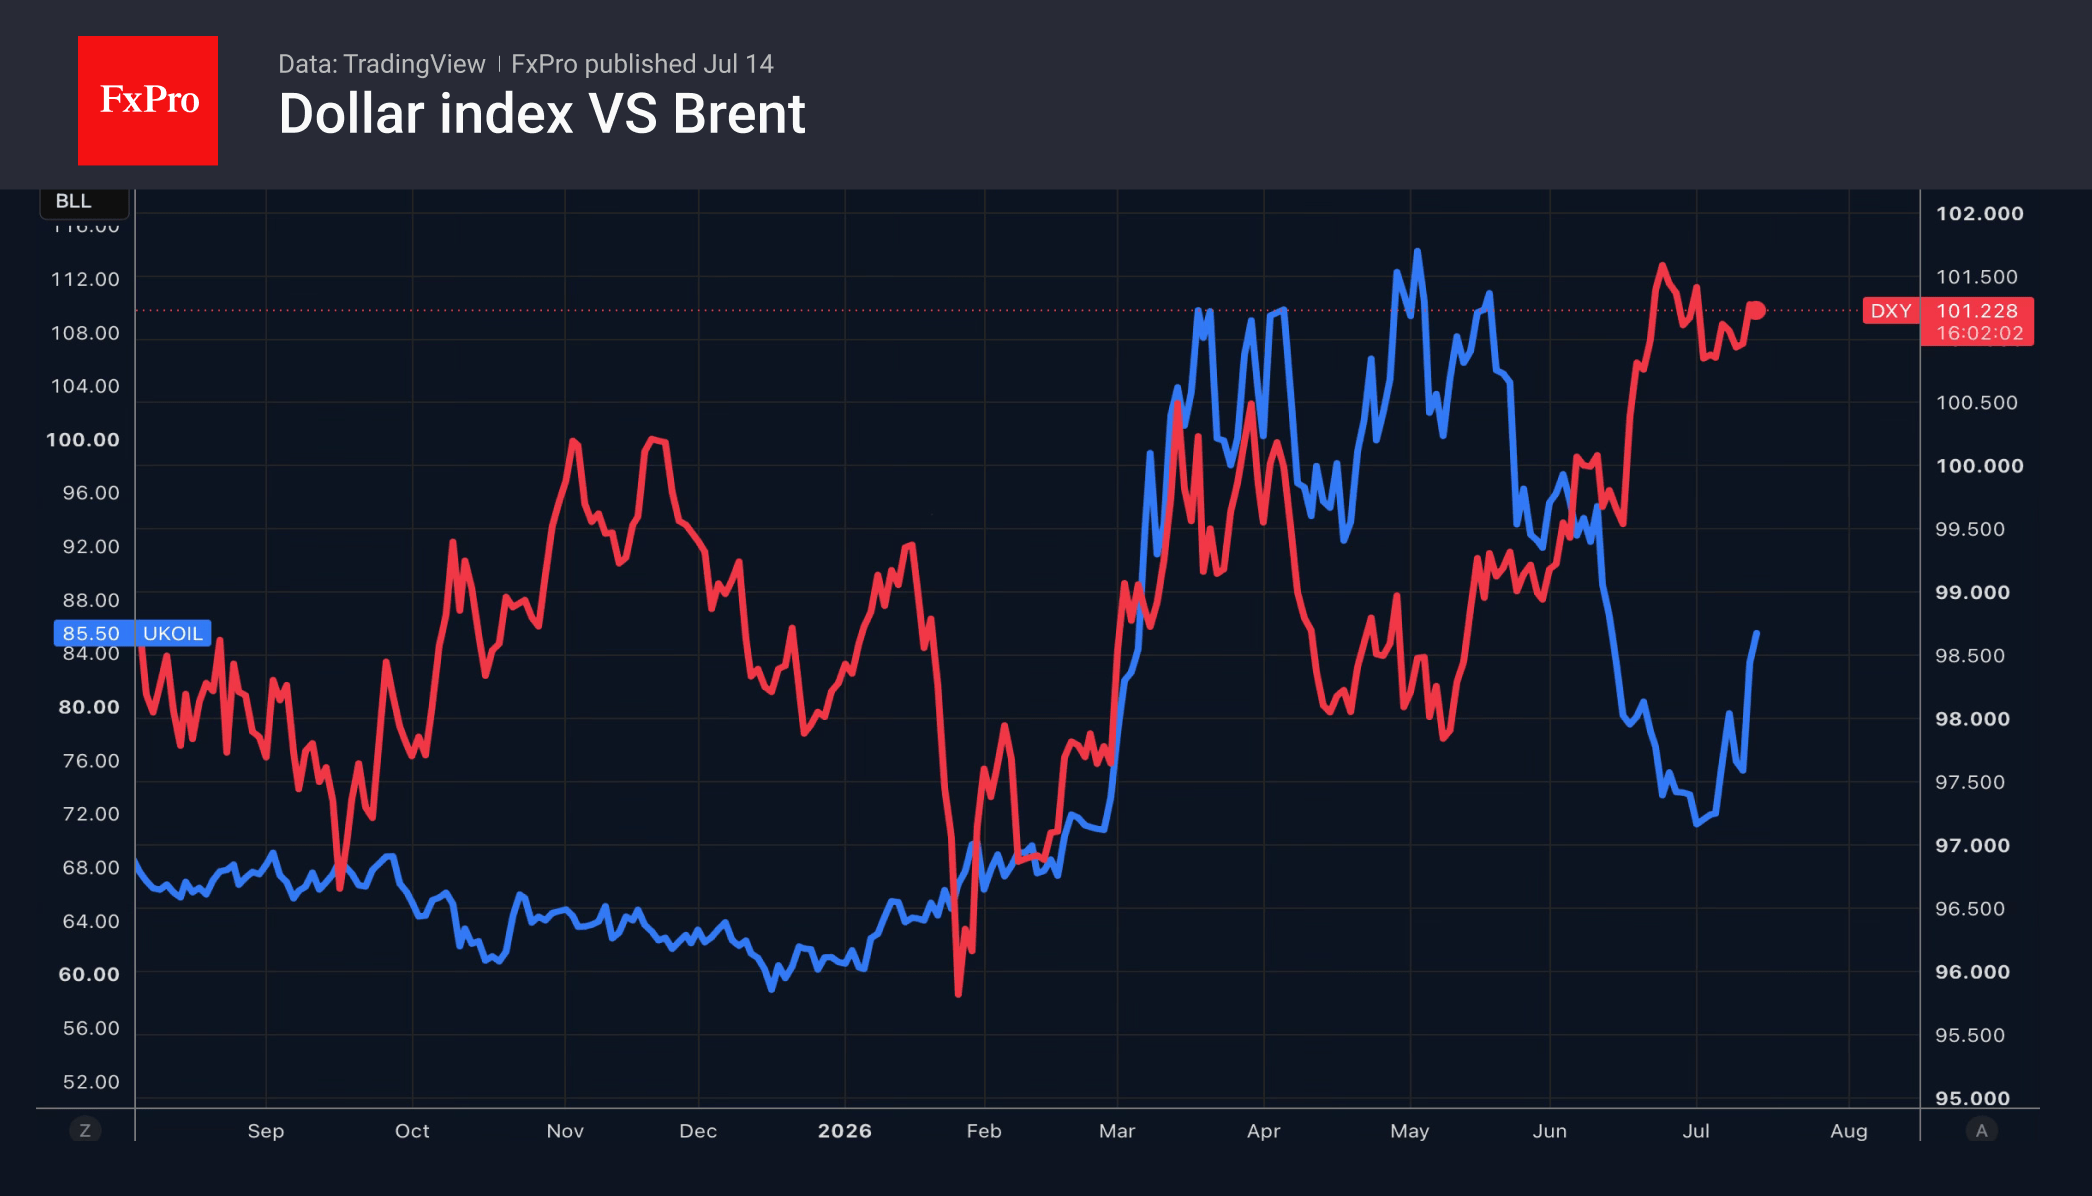
The US dollar posted its best day in three weeks on rumours of a US military blockade of the Strait of Hormuz. The escalation of the conflict in the Middle East enabled Brent to post its best daily percentage growth since 2020. This provided support for the greenback as a safe-haven asset and the currency of a net exporter of energy commodities. All the more so as the Fed may raise rates as early as its next meeting.
Christopher Waller spoke on this matter. The official expressed concerns about an acceleration in core inflation. If this is evident from the June consumer price report, the Fed should tighten monetary policy in July. The hawkish speech has raised the probability of two rate hikes in 2026 to 58% and the odds of a rate rise later this month to 43%. As a result, the US dollar has strengthened, and Treasury bond yields have risen.
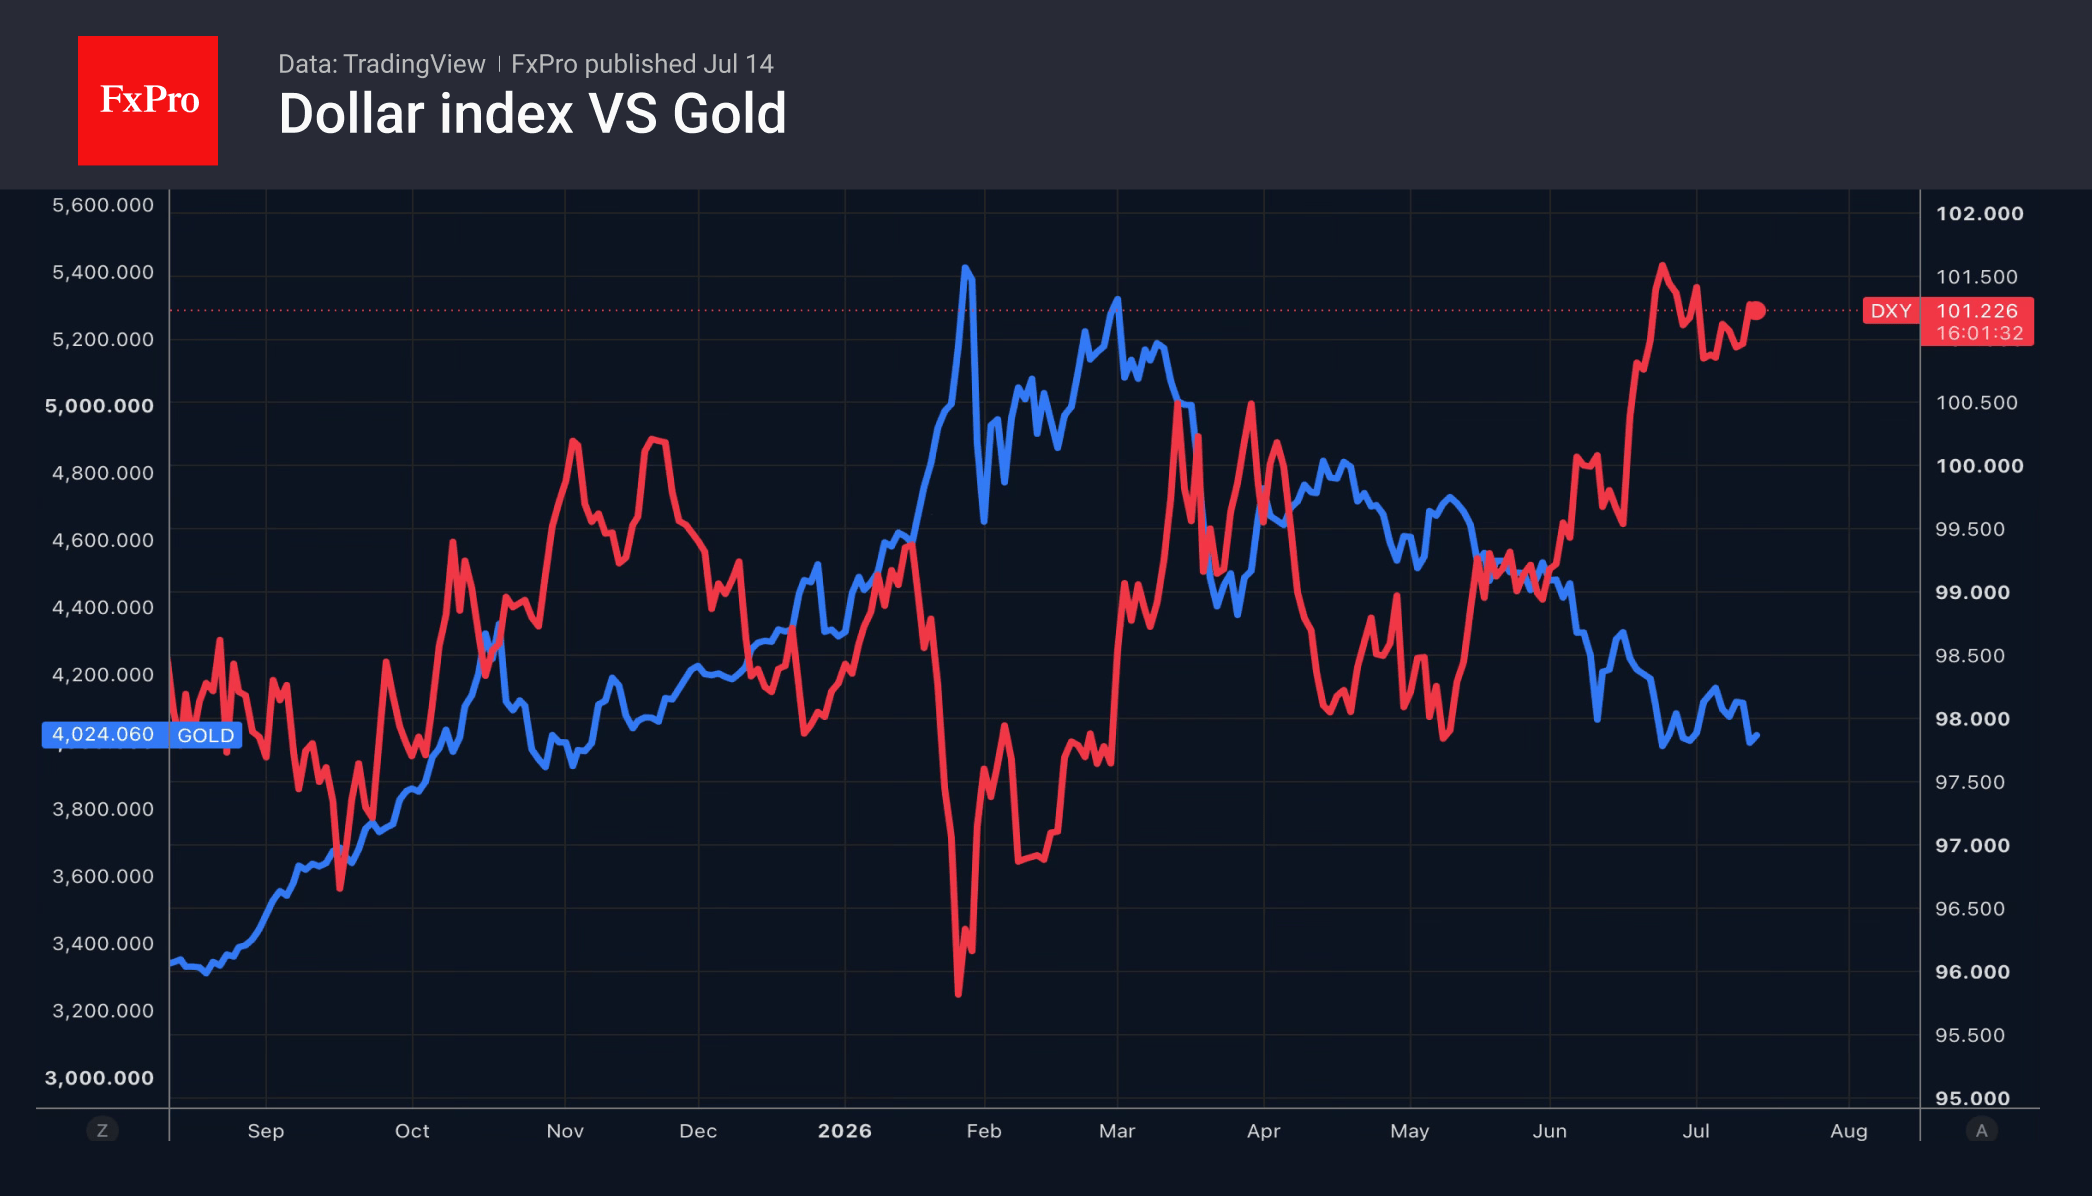
This backdrop is unfavourable for gold. It does not pay interest and is therefore unable to compete with assets that do so in a rising-interest-rate environment. At the same time, the opportunity cost of holding the precious metal in ETFs is rising, and capital outflows from specialised funds are contributing to the peak in gold prices.
Gold recorded its second-worst daily fall of 2026 on Monday. Its losses since the start of the year have exceeded 7%. Optimists, including State Street Investment Management, believe that Asian demand for the physical asset remains stable. That said, a price drop to $3,900 per ounce would trigger a rally, allowing the precious metal to find its bottom.
In reality, the fate of Gold lies in the hands of geopolitics and the US consumer price index report. Signs of accelerating core inflation in June would give the Fed grounds to raise interest rates as early as July, further strengthening the US dollar and pushing up yields on US Treasury bonds.
Keep an eye on Kevin Warsh’s testimony before Congress, as the new Fed Chair has already sent shockwaves through the financial markets twice since taking office. His hawkish rhetoric at the press conference following the June FOMC meeting and his vague comments at the ECB symposium in Sintra sent gold on a roller coaster ride.
The FxPro Analyst Team
EUR/GBP: Trendline Support or Breakdown to New Lows?
EUR/GBP has slid to its weakest level in a year, as the two currencies continue to follow increasingly divergent paths. The ECB's June hike—its first since 2023—was meant to signal renewed hawkishness, but the very next inflation print undercut that narrative: price growth cooled from 3.2% to 2.8%, enough for markets to now assign an 88% probability that policymakers will simply hold steady at their July 23 meeting. In other words, the euro's tightening story may already be running out of road.
The pound, by contrast, is benefiting from a rare double tailwind. Domestically, much of the political uncertainty that had weighed on sterling appears to be fading as investors look past recent leadership turmoil, while falling mortgage rates and a sharp drop in diesel prices are easing cost-of-living pressure at home. On the policy side, traders are increasingly convinced the Bank of England still has room to hike before year-end, with odds now sitting near 76%—a stark contrast to the ECB's apparent pause.
Put simply, the euro's hawkish window looks to be closing, while the pound is gaining traction on two fronts at once. That divergence is exactly what's driving EUR/GBP toward these lows—and it's worth asking how much further it can run.
EUR/GBP Technical Analysis
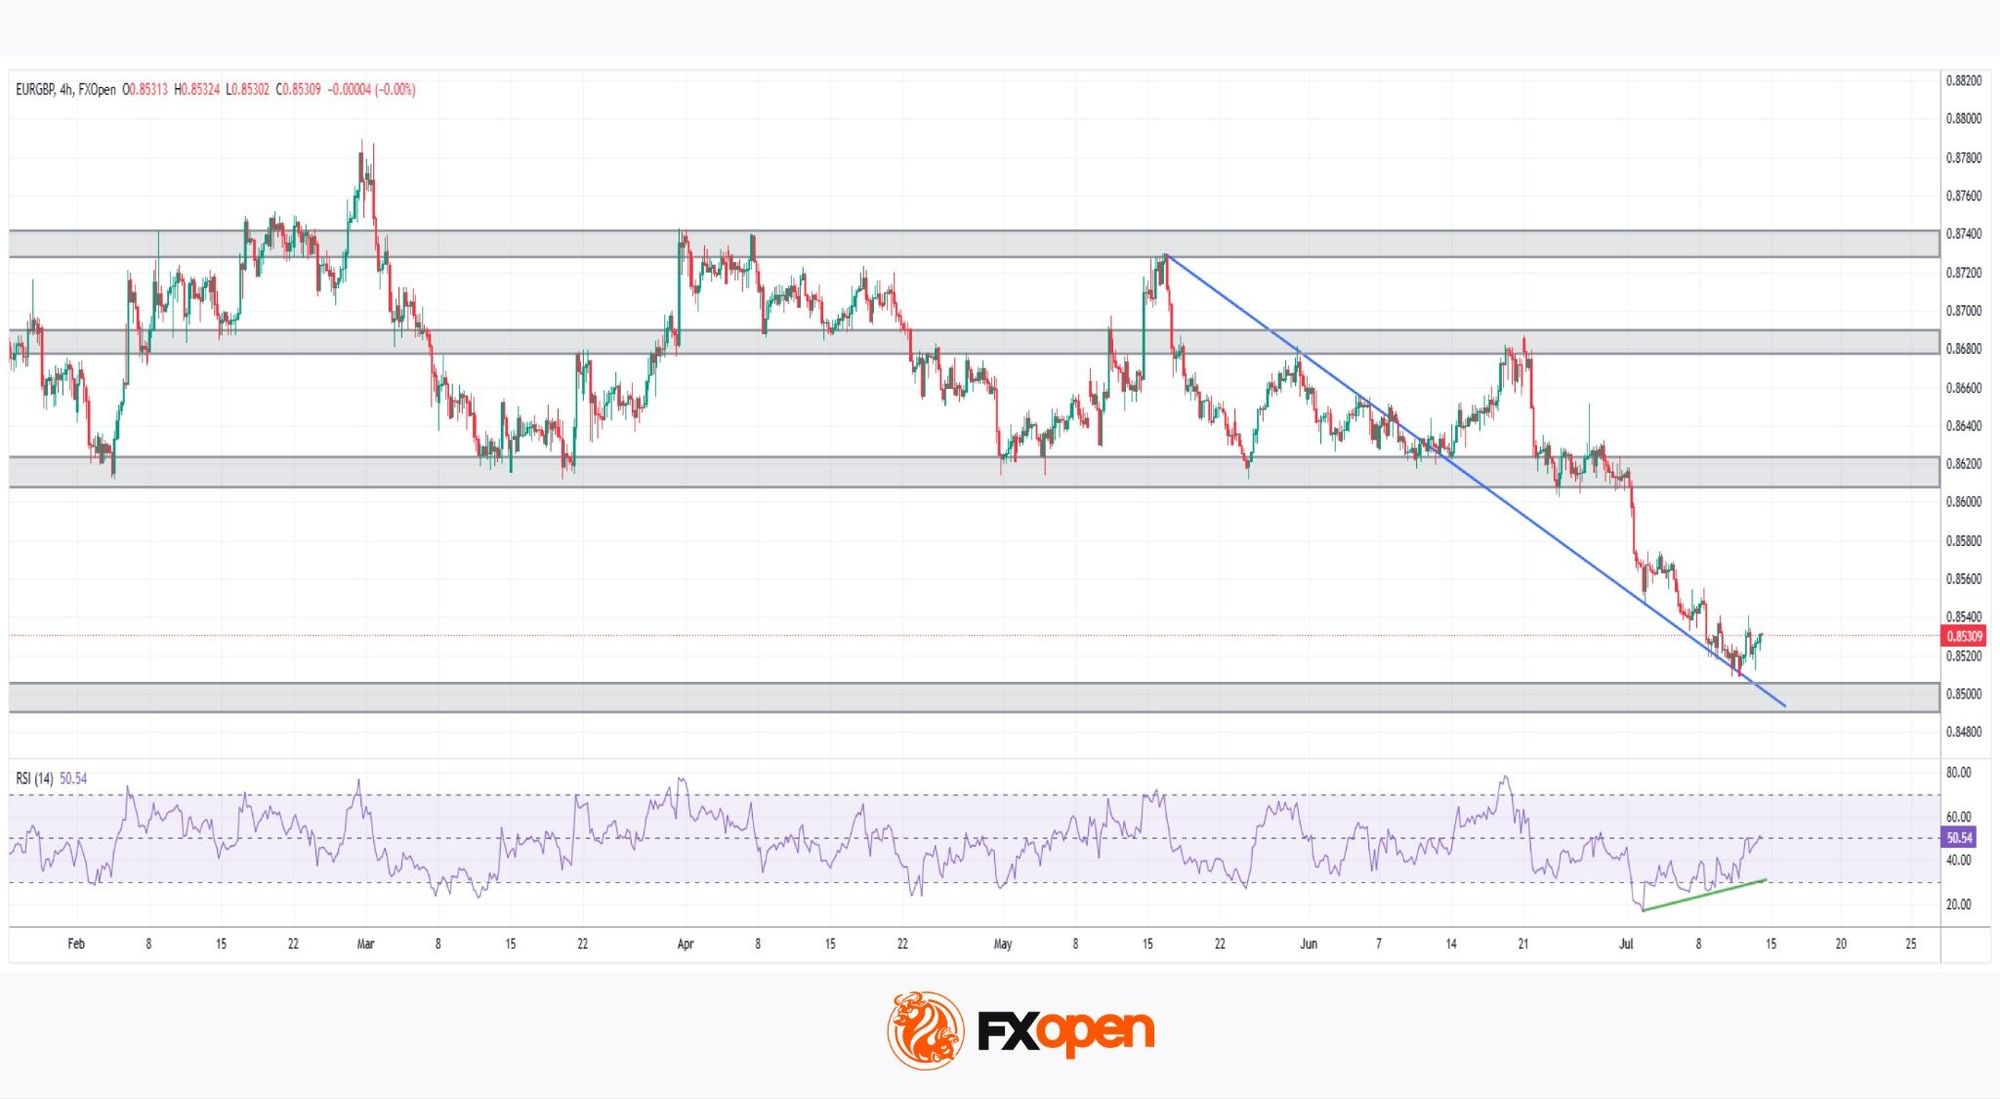
As the H4 chart shows, prices spent months trading lower from the April highs. In mid-June, the pair broke above the descending trendline. Since then, that same trendline has flipped into support, and price now appears to be testing it again from above.
Bullish Scenario
Adding weight to this reading is a bullish RSI divergence: while price printed a fresh low in early July, the RSI itself formed a higher low, hinting at fading downside momentum beneath the surface. If buyers step in and defend the reclaimed trendline along with the 0.8500 psychological zone, this divergence could gain real technical credibility. It would open the door for a corrective bounce with scope to extend meaningfully higher towards the former support, now resistance, near the 0.8600 zone. There, price could face an important test. A break above this level could open the way towards the 0.8680–0.8700 zone, a historic equilibrium area for the pair.
Bearish Scenario
However, if sellers manage to push back through this trendline, decisively flipping it back into resistance, the bullish divergence would quickly lose much of its relevance and credibility. In that case, the focus would shift immediately to the psychological 0.8500 support. A confirmed break below it could signal that the broader downtrend remains firmly intact, likely triggering a fresh leg lower and exposing the pair to new multi-month lows last seen over a year ago.
With price balanced right on this reclaimed trendline, and momentum quietly diverging from price, EUR/GBP's next move could prove decisive either way.
Trade over 50 forex markets 24 hours a day with FXOpen. Take advantage of low commissions, deep liquidity, and spreads from 0.0 pips (additional fees may apply). Open your FXOpen account now or learn more about trading forex with FXOpen.
This article represents the opinion of the Companies operating under the FXOpen brand only. It is not to be construed as an offer, solicitation, or recommendation with respect to products and services provided by the Companies operating under the FXOpen brand, nor is it to be considered financial advice.
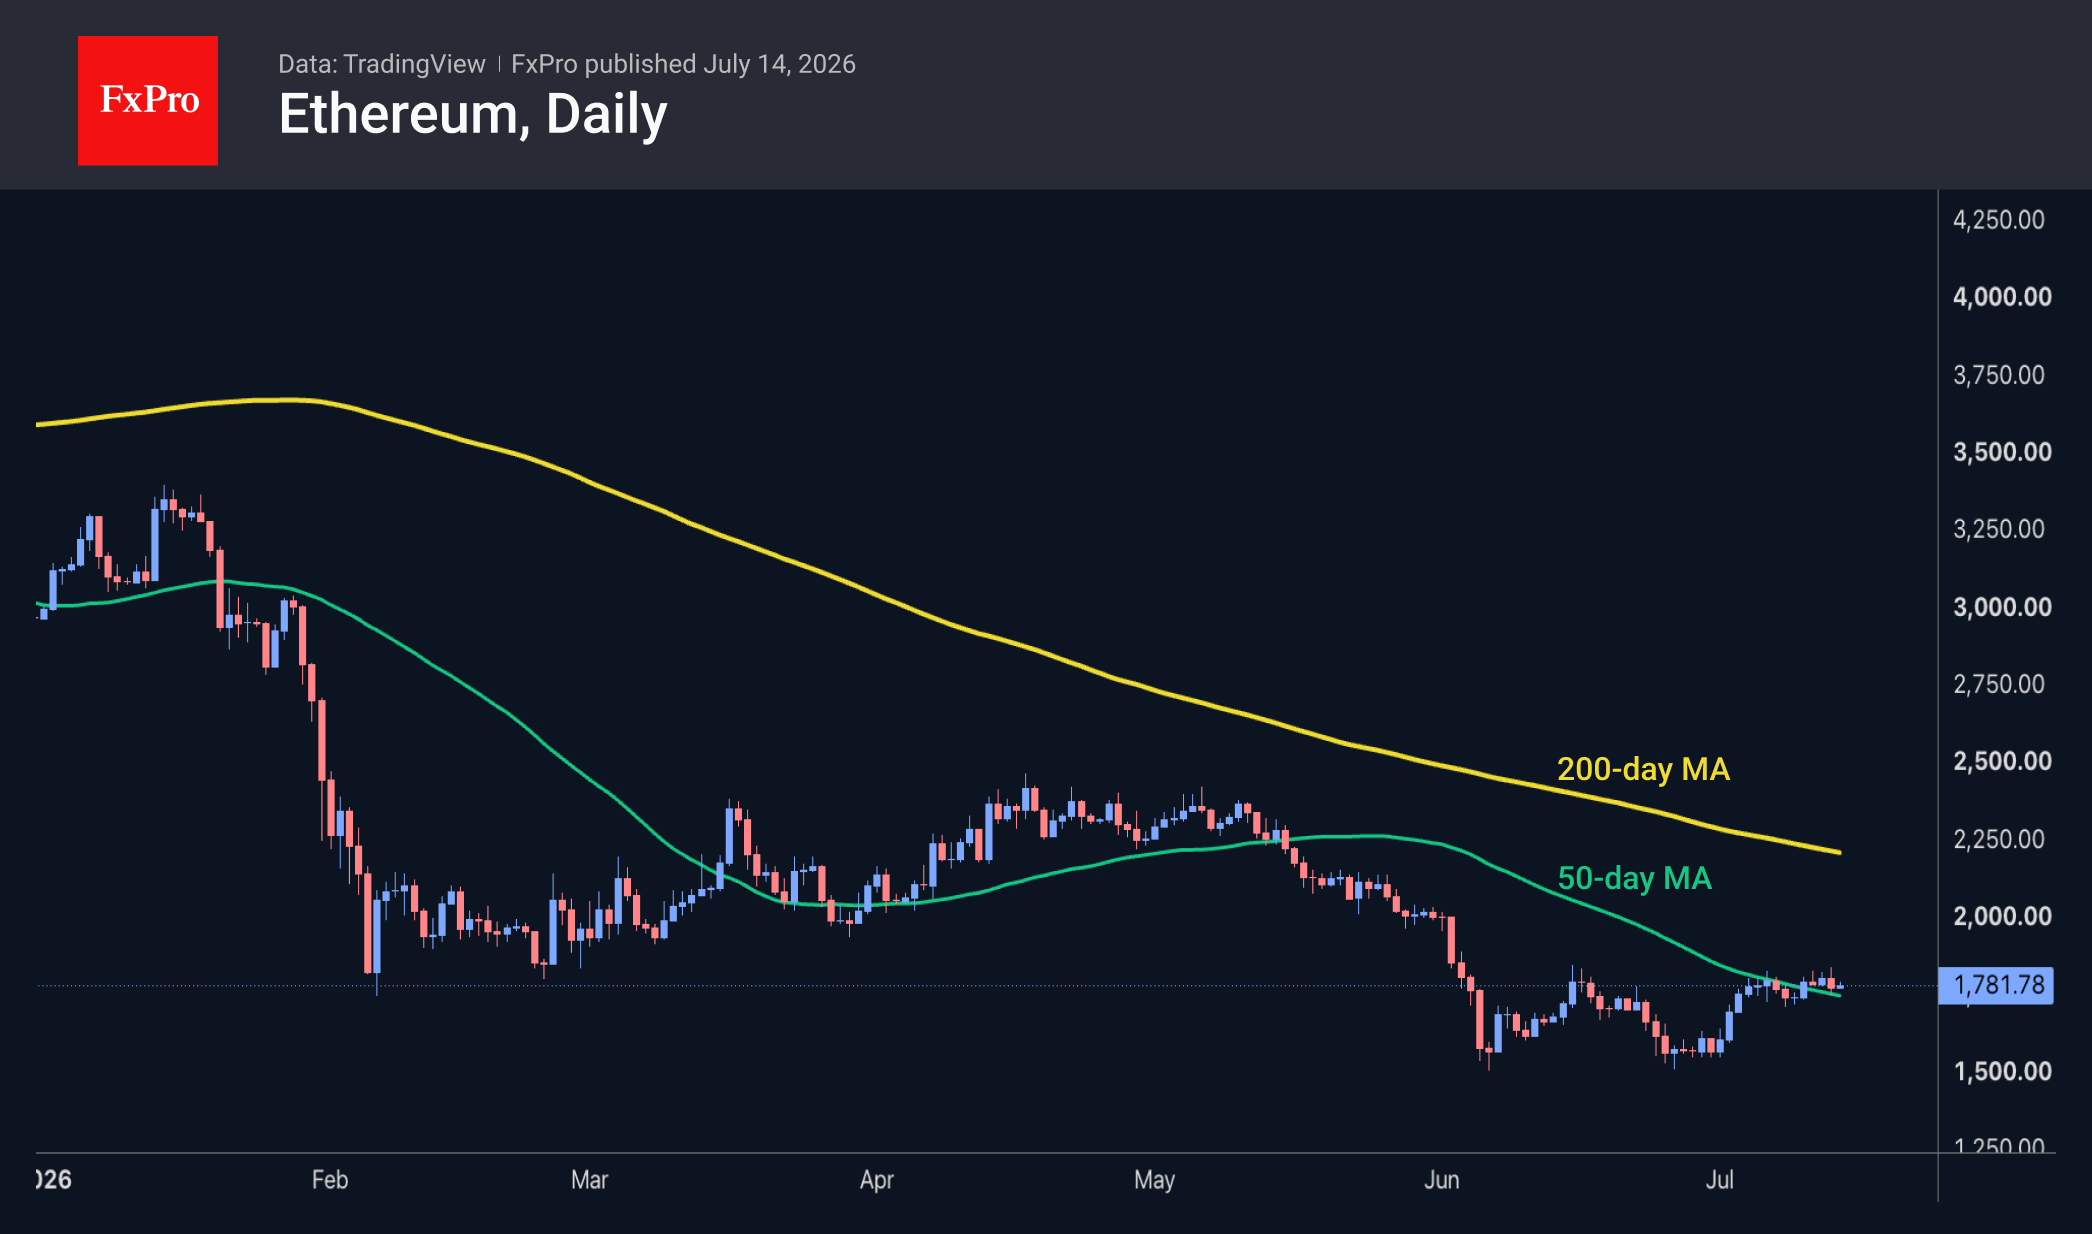
Ethereum Is Showing Resilience, but a Key Test at $1,850 Lies Ahead
Market Overview
The crypto market capitalisation has remained close to the $2.16T level, having recovered from a dip to $2.13T at its lows during US trading on Monday and at the start of the Asian session on Tuesday. Pressure on the market came from the escalation of the conflict between the US and Iran, which triggered a risk-off reaction and a strengthening of the dollar. That said, the market dynamics are not straightforward, with no shortage of altcoins rising over the past 24 hours. Among the most popular coins, the top performers were NEAR Protocol (+5.3%), Uniswap (+2.5%) and SushiSwap (+1.8%), while Dash (-3.3%), Basic Attention Token (-2.6%) and IOTA (-2.5%) lagged.
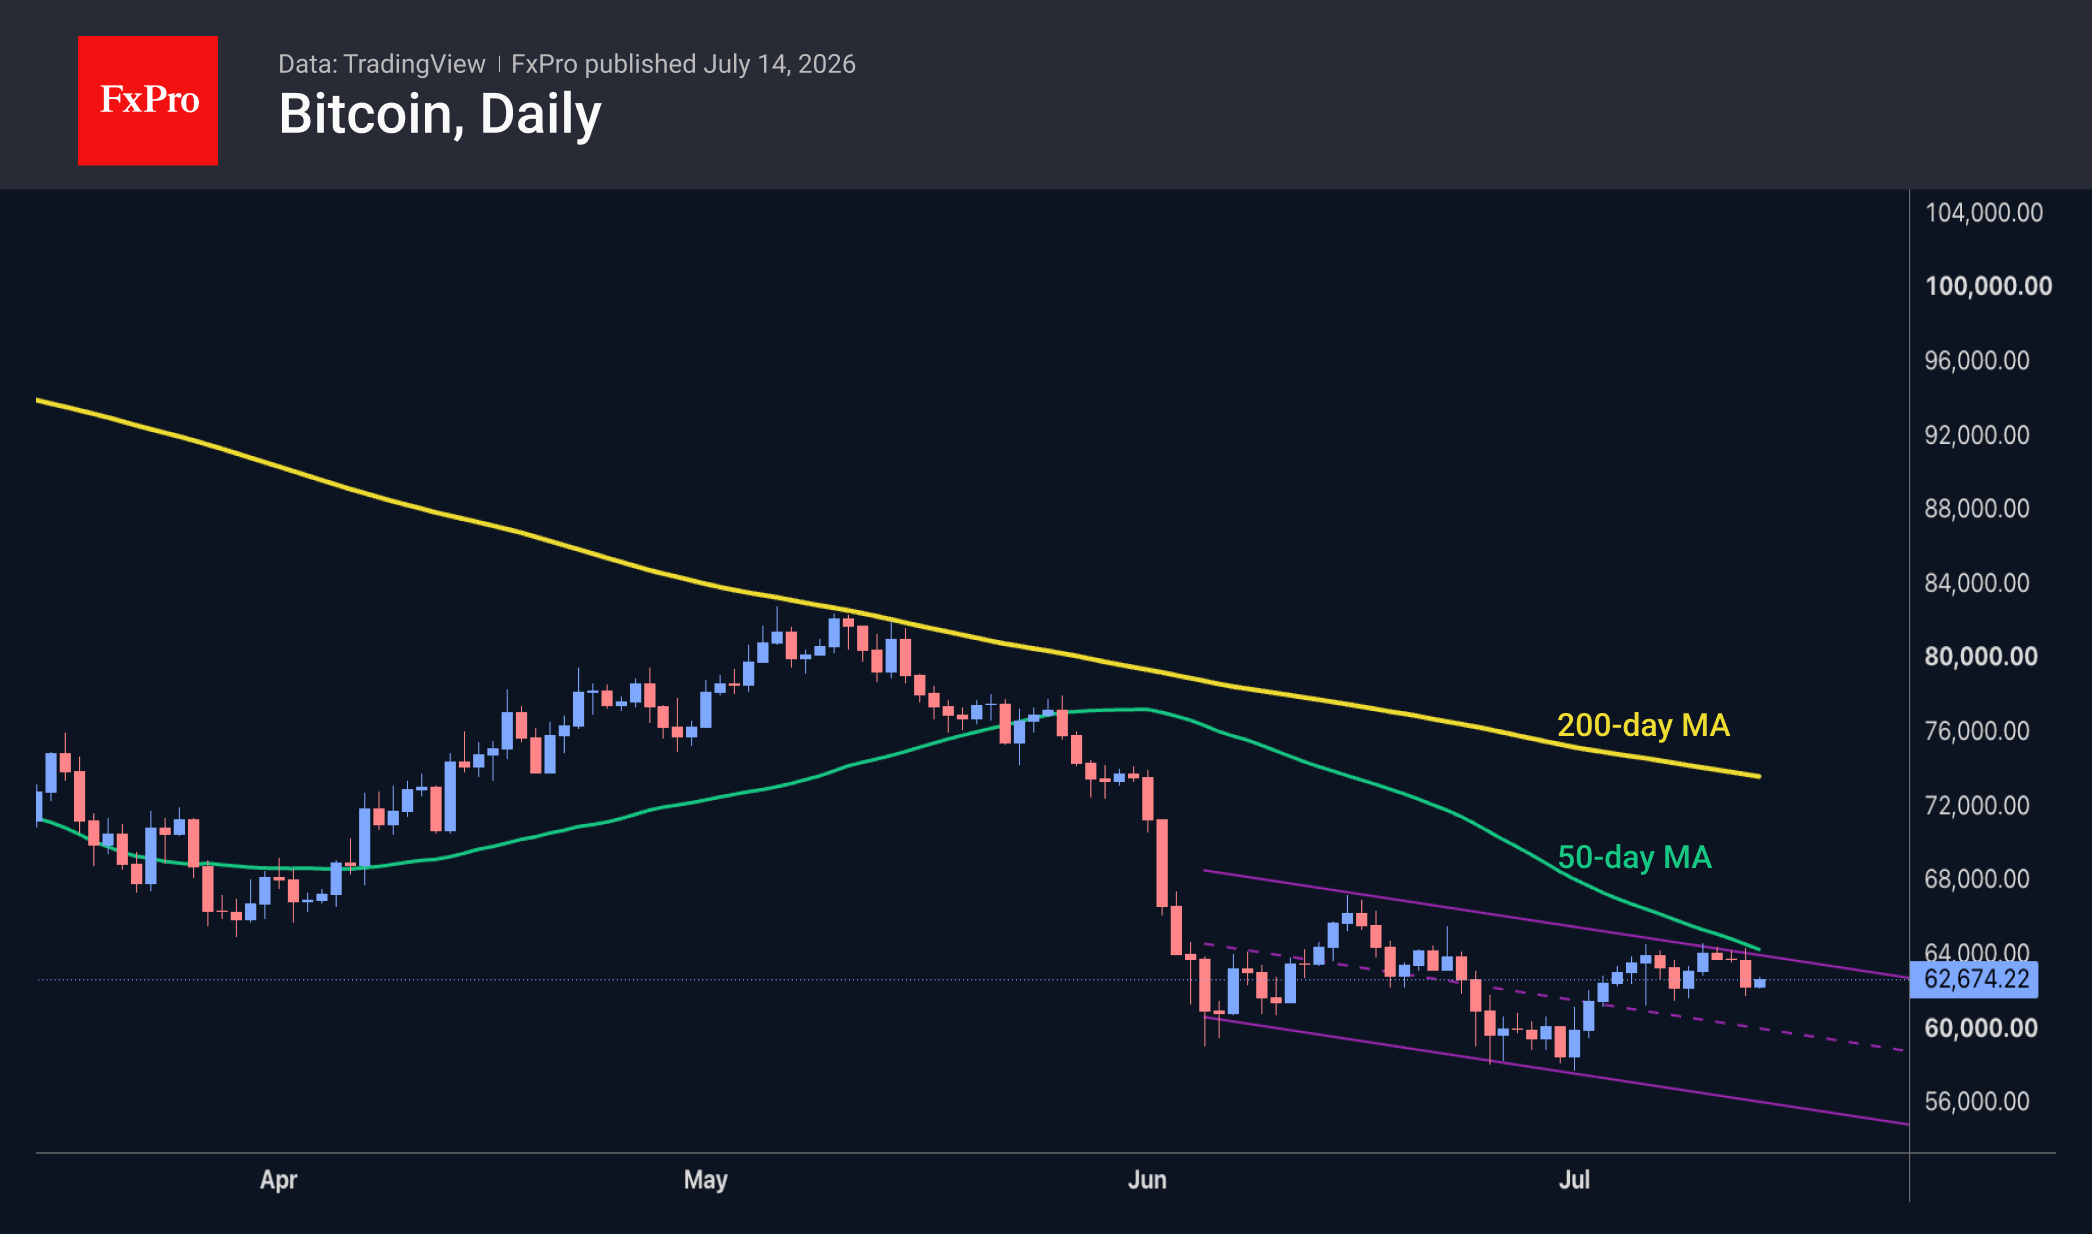
Bitcoin dipped below $62K but soon rebounded, trading near $62.6K at the start of active European trading. Technically, the leading cryptocurrency remains in bearish territory, facing increased selling pressure as it approaches its 50-day moving average from below, while the previous area of local highs lies approximately $3K above the current price. However, the bears also have something to prove, and they will need to push the price below $58K to confirm the downtrend’s continuation.
The picture for Ethereum is slightly more optimistic, as the second-largest cryptocurrency has been trading above its 50-day MA for the fourth consecutive day, trading within the range of recent weeks’ highs. This coin has previously signalled market reversals several times, which is why we are now paying close attention to it. Confidence in a shift in sentiment will strengthen if the price consolidates above the former low around 1,850, which now acts as local resistance. If this does not happen in the near future, a very dangerous decline can be expected.
News Background
Over the past week, Bitmine purchased an additional 30,567 ETH for $36 million, bringing the total amount of Ethereum in its reserves to 5.77 million ETH. Bitmine’s reserves now exceed 4.8% of the total Ethereum supply. Bitmine’s Chairman, Tom Lee, is optimistic about Ethereum’s long-term prospects, despite the crypto winter. In his view, ETH will support the tokenisation of traditional financial assets and the growing demand for blockchain from companies developing artificial intelligence-based applications.
Strategy neither bought nor sold any Bitcoin last week. The company sold shares worth $466.7 million, increasing its dollar reserves to $3 billion. Its Bitcoin position remained unchanged at 843,775 BTC, with an average purchase price of $75.5K.
Trump’s profits from cryptocurrencies are being invested in shares and bonds, according to a report submitted by the president to the US Office of Government Ethics. The US President does not invest in Bitcoin or shares in cryptocurrency companies.
The market crash will begin with a slump in the US bond market, warns Peter Schiff, head of Euro Pacific Capital and a crypto-sceptic. Rising US Treasury yields will inevitably lead to more expensive borrowing, a stock market crash and a fall in the value of cryptocurrencies.
The FxPro Analyst Team
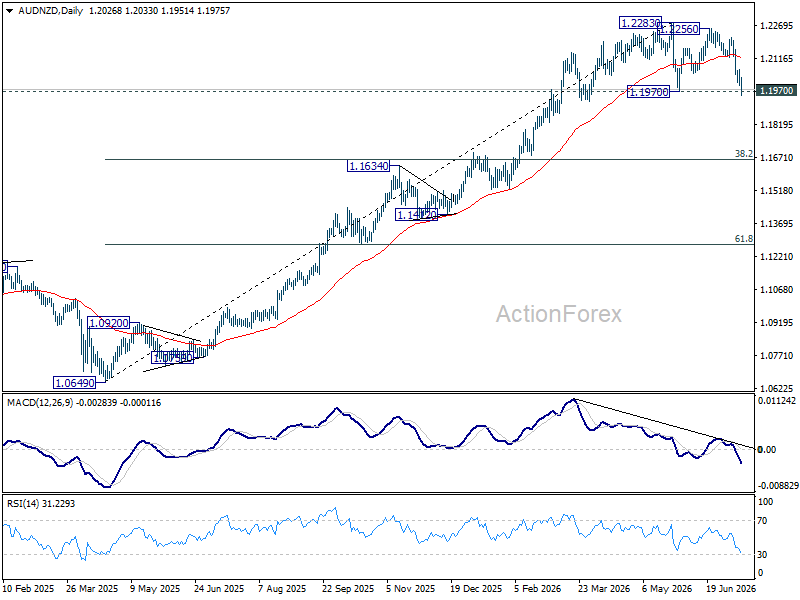
AUD/NZD Tests Double Top Breakdown as RBNZ’s Conway Revives Faster Tightening Bets
Only a week after the Reserve Bank of New Zealand suggested lower oil prices would help ease inflation, one of its most senior policymakers is already questioning that assumption. Chief Economist Paul Conway's latest remarks have given the New Zealand Dollar another boost, as investors conclude that the recent rebound in energy prices could require the RBNZ to tighten policy further than markets anticipated just days ago. That shift is now pushing AUD/NZD toward the neckline of an important double top, with the cross reflecting diverging monetary policy paths on either side of the Tasman.
Conway's speech, "Finding Signal in the Inflation Noise", acknowledged that falling oil prices had initially eased near-term inflation pressures. However, he argued the recent resurgence in Middle East tensions has delivered "another significant inflation shock" and warned that inflation may not slow as quickly as the RBNZ's own forecasts suggest.
More importantly, he pointed to structural changes in New Zealand's pricing behavior. New research from the central bank indicates businesses are passing higher costs through to consumers more readily than in the past while proving less willing to reverse those increases when costs decline. If that behavior alters inflation expectations, Conway said, "monetary policy may need to respond more firmly to re-anchor inflation expectations," while cautioning that well-anchored expectations "cannot be taken for granted."
Markets responded by bringing forward expectations for further tightening. Overnight index swaps now imply the Official Cash Rate rising from current 2.50% to around 3.0% by December, with another increase expected early next year. That marks a notable shift from the narrative surrounding last week's policy decision, when lower fuel prices had encouraged expectations that the RBNZ could move only gradually after delivering its first rate hike in three years. The rebound in oil prices has quickly forced investors to reassess that outlook.
The implications are particularly clear in AUD/NZD. While the Reserve Bank of Australia has already delivered three rate hikes this year and is widely expected to adopt a slower, more measured pace, the RBNZ is viewed as having more ground to make up. That narrowing policy gap provides a strong fundamental backdrop for continued New Zealand Dollar outperformance.
The technical picture is beginning to reinforce that macro story. AUD/NZD has already shown signs that the five-wave rally from 1.0649 has run its course, with bearish divergence emerging on D MACD. Focus is now squarely on the 1.1970 neckline. A decisive break would confirm a double top at 1.2283 and 1.2256, opening the way toward 38.2% retracement of 1.0649 to 1.2283 at 1.1659.
USD/JPY Holds at Highs: Pressure Lingers on Yen
USD/JPY ended Tuesday at 162.27, with the Japanese yen remaining near 40-year lows. Pressure on the currency persists, as Japanese authorities have yet to carry out fresh interventions to support the exchange rate.
The yen fell sharply on Monday following reports from Reuters that Japanese authorities do not plan to change the asset structure of the state pension fund in the near future, reducing expectations of additional support for the domestic financial market.
Later, Finance Minister Satsuki Katayama stated that the country's largest pension fund could adjust its investment structure if necessary. She also proposed including government bonds in a tax-free investment programme for private investors to boost interest in domestic assets.
Additional pressure on the yen came from a strengthening US dollar and a fresh surge in oil prices. The catalyst was US President Donald Trump's decision to restore the blockade of Iranian ships passing through the Strait of Hormuz, along with his call for countries that benefit from the security of this strategic route to compensate Washington for its protection costs.
Technical Analysis
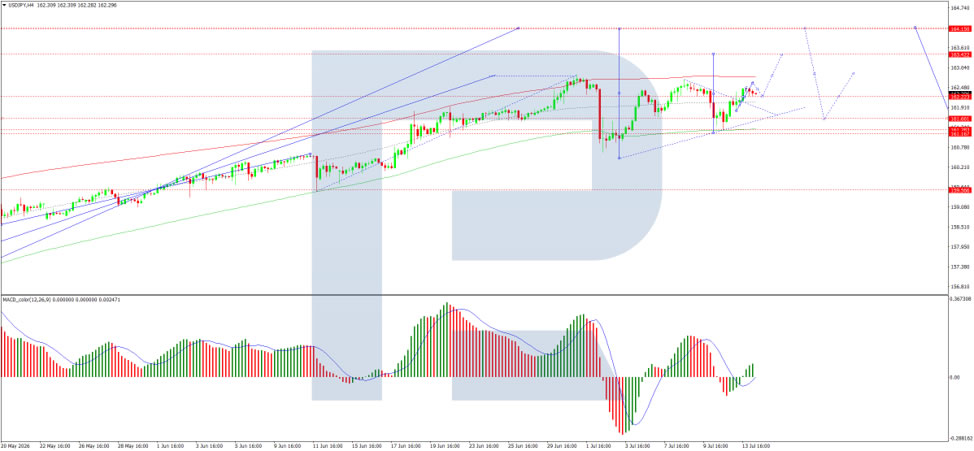
On the H4 USD/JPY chart, the market is forming a consolidation range around the 162.22 level, currently extending up to 162.46. A decline leg to the 162.22 level (testing from above) is expected today, followed by further growth to 163.30, with the prospect of the trend continuing to 164.15. Technically, this scenario is confirmed by the MACD indicator, whose signal line is above the zero level and pointing strictly upwards.
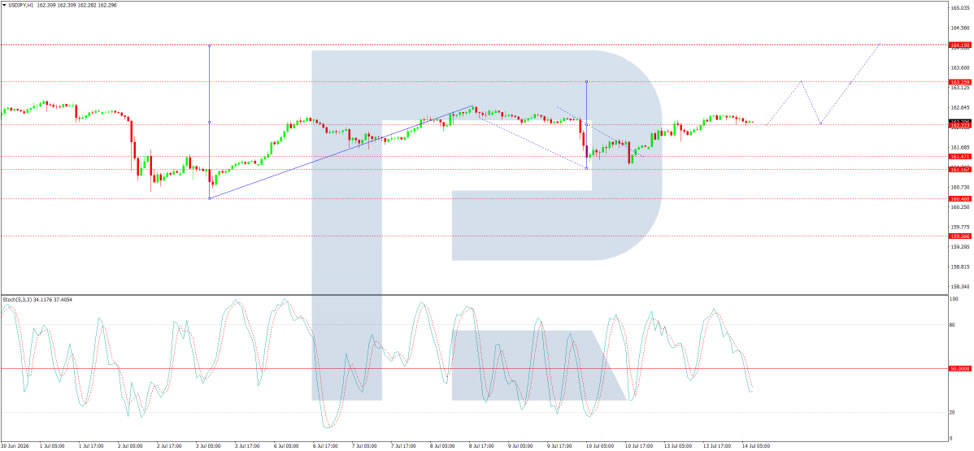
On the H1 chart, USD/JPY has completed a downward wave pattern to the 162.22 level. A wave extension to 162.00 cannot be ruled out. Thereafter, the start of a growth wave to at least 163.30 is expected. A breakout above this level would open potential for a continuation of the growth wave to 164.15. Technically, this scenario is confirmed by the Stochastic oscillator, whose signal line is below the 50 level and pointing strictly downwards to 20, indicating short-term downward pressure before a potential reversal.
Conclusion
USD/JPY remains elevated, with the yen stuck near 40-year lows as markets await concrete action from Japanese authorities. The currency weakened further following reports that the state pension fund will not change its asset structure imminently, although Finance Minister Katayama later left the door open for adjustments. Meanwhile, renewed US naval blockades in the Strait of Hormuz and Trump's demand for compensation from allies have pushed oil prices higher, adding to dollar strength. Technical indicators suggest the pair may see a modest pullback before resuming its upward trajectory towards 163.30 and possibly 164.15, with intervention risks remaining the key wildcard for yen bulls.
Sunrise Market Commentary
Markets
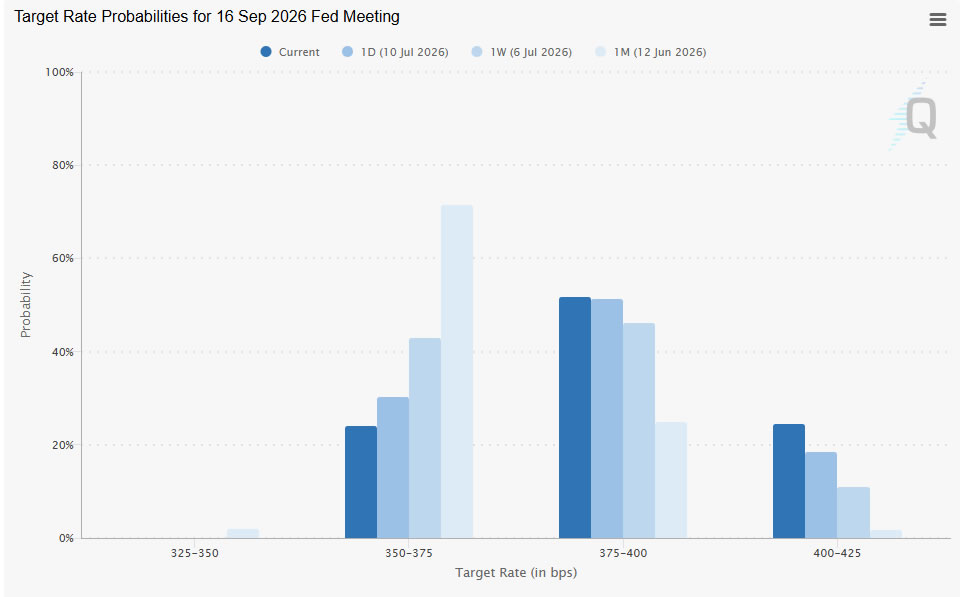
US President Trump nicknamed the USA "THE GUARDIAN OF THE HORMUZ STRAIGHT". As US military campaigns against Iran intensify, president Trump reinstated the Iranian blockade aimed at stopping Iran's ships or customers from entering or leaving. A new feature for other vessels is that they'll have to pay the GUARDIAN a rate of 20% on all cargo as a matter of FAIRNESS in return for providing safety and security in this very volatile section of the World. In less than a month, the US shifts from statements like "no country is allowed to charge tolls or fees on an international waterway" to charging tolls themselves. All animals are equal, but some animals are more equal than other animals. Energy and supply chain disruptions are here to stay and markets adjust. Brent crude oil prices moved past $85/b this morning compared with last week's close around $75/b and the early July corrective bottom just above $70/b. The European reference gas contract (Dutch TTF) tested the highest level since March at €53.55/MWh. Core bonds sold off with curves bear steepening as money markets rapidly shift back to central bank tightening bets. Daily changes on the US yield curve ranged between +4.5 bps (30-yr) and +7.6 bps (2-yr; highest level since February 2025). Hawkish comments by Fed governor Waller added to the momentum that lifted the probability of a July rate hike to 50%: "If we get another hot reading on core inflation this week, then the FOMC will need to consider tightening monetary policy in the near term". June CPI inflation numbers are due this afternoon. Consensus expects headline inflation to be 0.1% lower M/M thanks to gas prices, which would pull headline CPI from 4.2% Y/Y to 3.8% Y/Y. Core CPI is forecast at 0.2% M/M and 2.9% Y/Y (unchanged). Especially a slightly stronger (monthly) core CPI pace would be unnerving after the Waller comments and with minutes of the June FOMC meeting already showing "a few" in favour of a rate hike. Our KBC Nowcast model also suggests (minor) upside risks with headline CPI seen at 3.92% Y/Y and core at 2.85% Y/Y. After inflation numbers, Fed Chair Warsh will give his first semiannual testimony before US Congress. He held his cards close to his chest for now, in line with his overall goal to reduce Fed communication and forward guidance. It's unclear whether he'll be more open in front of Congress, but markets will take any clues especially on the assessment of inflation (risks). As the Fed blackout period approaches (July 18), today's developments are highly likely to decide on the outcome of July 23 FOMC meeting. Erring on the side of caution (higher oil, weaker bonds/stocks and stronger USD) with hawkish repositioning remains the way to go.
News & Views
The central bank of New Zealand's chief economist warned, citing research, that companies today are more prepared than in the past to pass on costs to consumers. Paul Conway said it's the result of repeated global fuel price shocks. After years of above-target inflation, such shocks hold increased risks to trigger persistent rather than temporary inflation. Conway's comments come after oil prices recently surged higher again amid renewed escalations in the Middle East conflict. It raises chances for the central bank to tighten policy further after last week's rate increase to 2.5%. The market implied probability for a follow-up move in September rose to 90%. For the remainder of 2026 more than two hikes are priced in. The kiwi dollar extends a recent rebound on the RBNZ's hawkish shift with NZD/USD appreciating towards 0.58, the highest in a month.
"European countries face rising spending pressures and higher interest costs that could sharply increase debt and threaten growth if left unaddressed. […] maintaining fiscal sustainability requires a coordinated strategy combining structural reforms and fiscal consolidation, and in some cases deeper changes to the role of government, as incremental approaches are no longer sufficient." A new IMF paper titled "Europe's Fiscal Squeeze: Tackling Rising Spending pressures" is once again an inconvenient truth. Researchers warn that increasingly pressing challenges such as population aging, the energy transition and rearmament mean a "piecemeal" approach to fixing public finances falls way short and instead risks triggering reform fatigue. The authors estimate that spending will climb to an average of 5% of GDP by 2040, putting the public debt ratio on an unsustainable path towards 130% (vs about half of that today). Fiscal adjustments will be needed in most countries while some (mostly highly indebted) governments need to rethink their role and reassess the scope of public services. For Belgium (and France & Norway), the IMF sees particular room for improvement in targeting social spending.
Elliott Wave Outlook: EURUSD 5‑Swing Structure from July 2 High Signals More Weakness
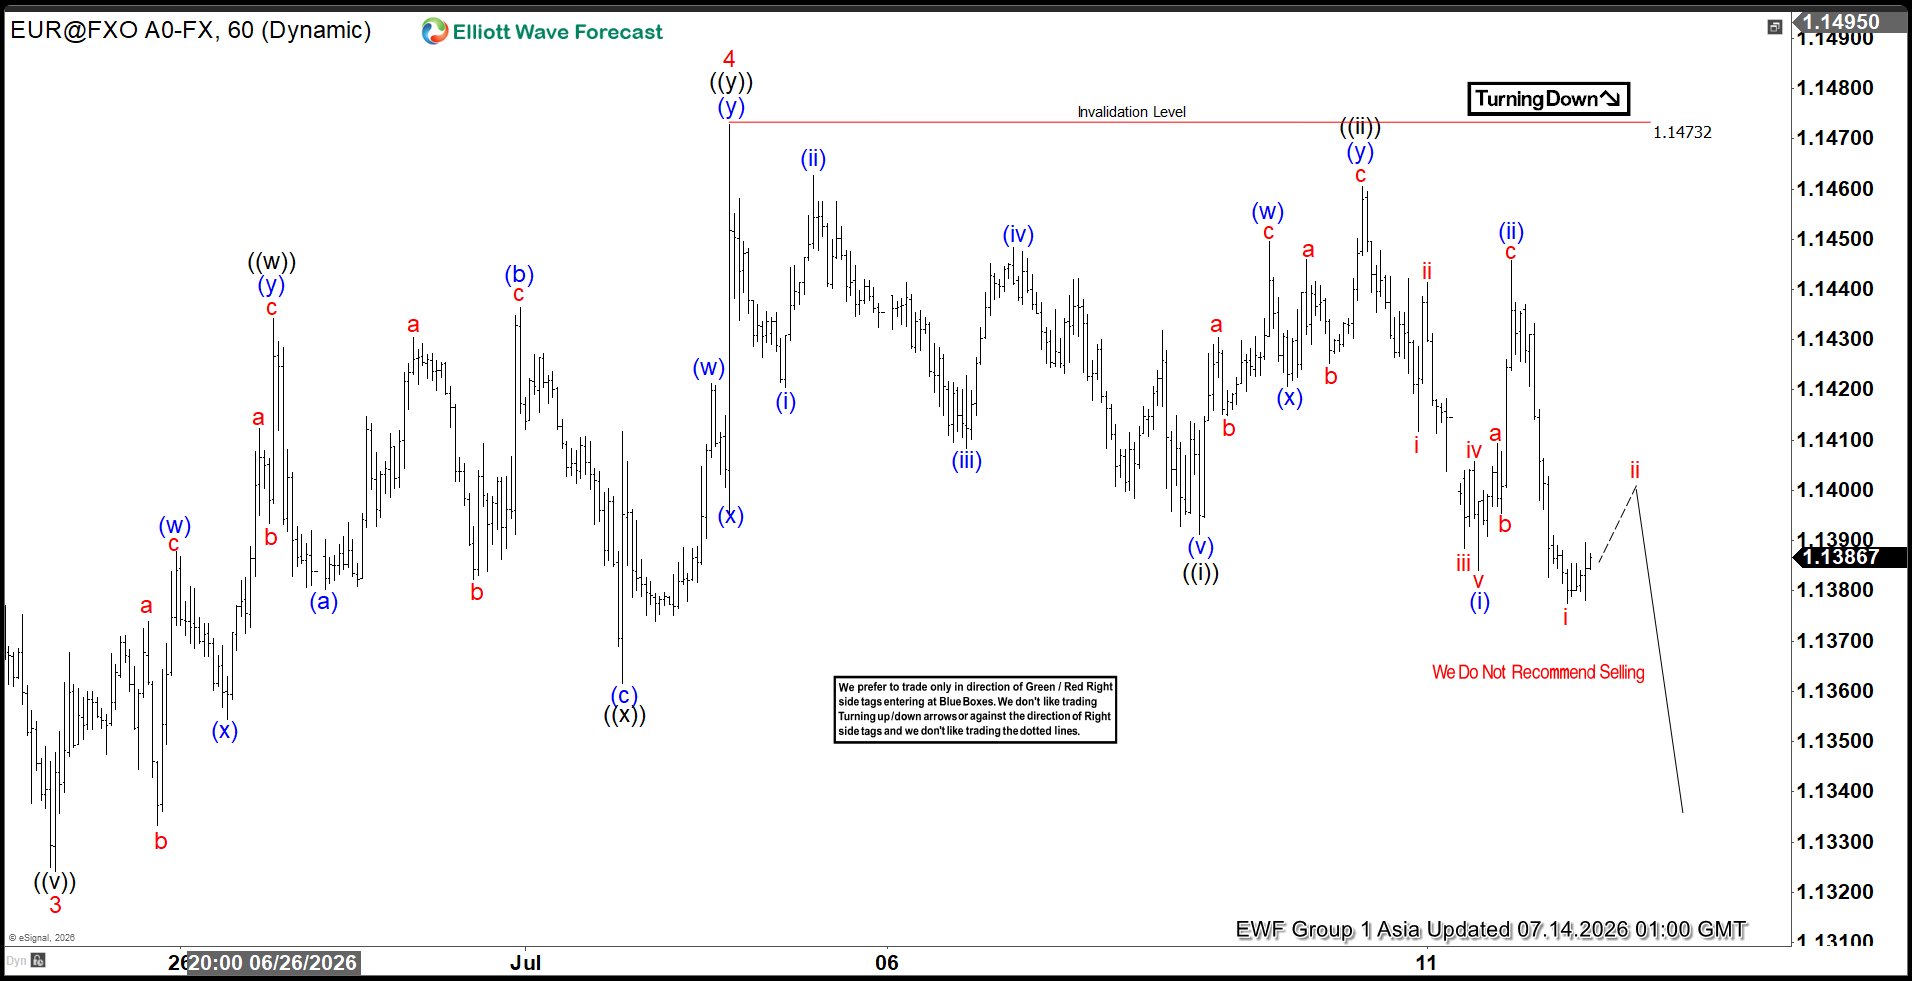
EURUSD maintains an incomplete bearish sequence from the January 27, 2026 peak, leaving room for further downside. The projected target zone is defined by the 100% to 161.8% Fibonacci extension from the January 27 high, which falls between 1.076 and 1.117. This extension range provides a precise technical framework for anticipating the next leg lower. In the near term, the cycle from the July 2, 2026 high has unfolded into a five‑swing decline, reinforcing the bearish bias and signaling additional weakness.
From the July 2 high, wave ((i)) concluded at 1.139 as a diagonal structure. A corrective rally in wave ((ii)) terminated at 1.146, after which the pair resumed its downward trajectory in wave ((iii)). The internal subdivision of wave ((iii)) is unfolding as another five‑wave impulse. Within this structure, wave (i) ended at 1.138, while wave (ii) retraced to 1.145. These developments confirm that the decline remains active and incomplete. As long as the pivot at 1.147 holds, rally should fail in 3 or 7 swing and EURUSD is expected to continue pressing lower. A decisive break below the June 24 low at 1.1324 is required to eliminate the possibility of a double correction.
EURUSD 60-Minute Elliott Wave Chart
EURUSD Elliott Wave Video:
https://www.youtube.com/watch?v=6FoDd-hTQvg
Gold Slides as Oil Surges and Fed Hike Bets Build, Leaving $4,000 Increasingly Vulnerable
Gold is finding itself squeezed by two markets moving in the same direction. Oil is rebuilding inflation fears, while the Federal Reserve is becoming more willing to tighten policy again if price pressures refuse to ease. Together, those forces have left the metal on the defensive, with the psychologically important $4,000 level looking increasingly fragile as investors await another pivotal US inflation report.
The latest catalyst came from both geopolitics and monetary policy. Brent crude briefly climbed above $85 after US President Donald Trump announced plans to impose shipping fees on cargo transiting the Strait of Hormuz and restore a blockade of Iranian ports, raising the prospect of higher energy costs and renewed supply disruptions. For Gold, the significance lies less in the conflict itself than in its impact on inflation expectations. Rising oil prices increase the risk that inflation remains elevated, making it harder for the Fed to justify keeping policy unchanged.
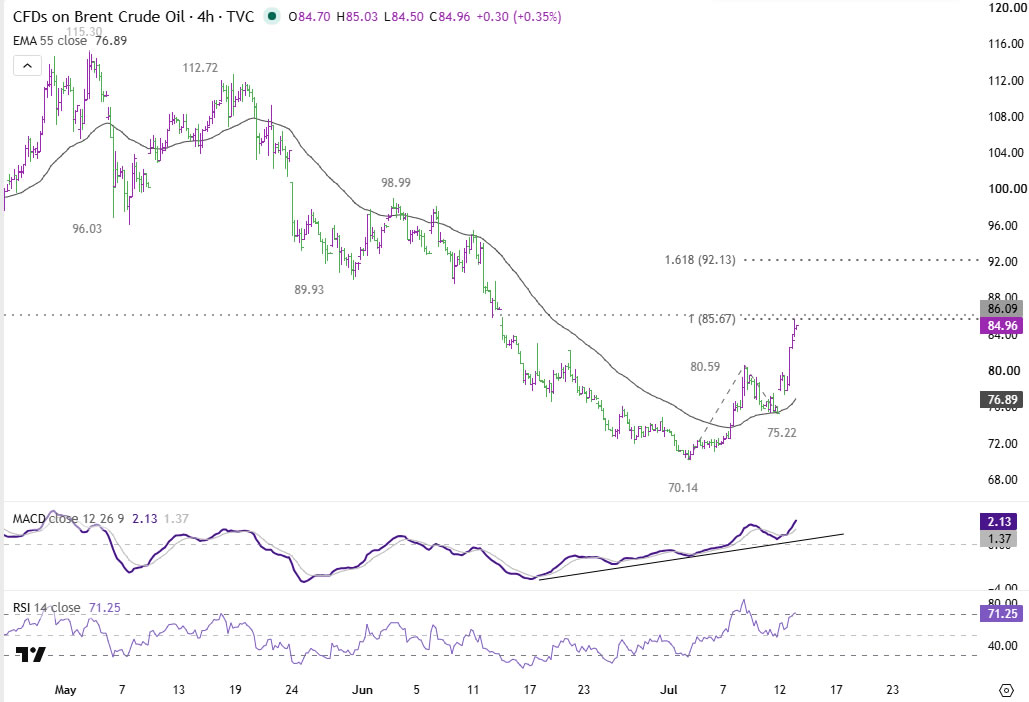
That concern was reinforced by Federal Reserve Governor Christopher Waller, whose comments represented a notable shift from one of the Committee's more dovish voices. Waller said that "if we get another hot reading on core inflation this week, then the FOMC will need to consider tightening monetary policy in the near term," adding that another strong inflation reading would be "signal, not noise." His remarks accelerated the repricing already underway in interest-rate markets. Fed funds futures now imply better than a 40% chance of a July rate hike, compared with roughly one-in-four a week ago, while the probability of a September increase has climbed to about 76%, up from 57%.
Even with those headwinds, Gold sellers have stopped short of forcing a decisive breakdown before today's key events. Markets remain focused on the June CPI report and Fed Chair Kevin Warsh's first congressional testimony, which together could either validate or challenge the increasingly hawkish policy outlook. If inflation again surprises on the upside, the combination of stronger oil prices and a more hawkish Fed would present an even more difficult backdrop for precious metals.
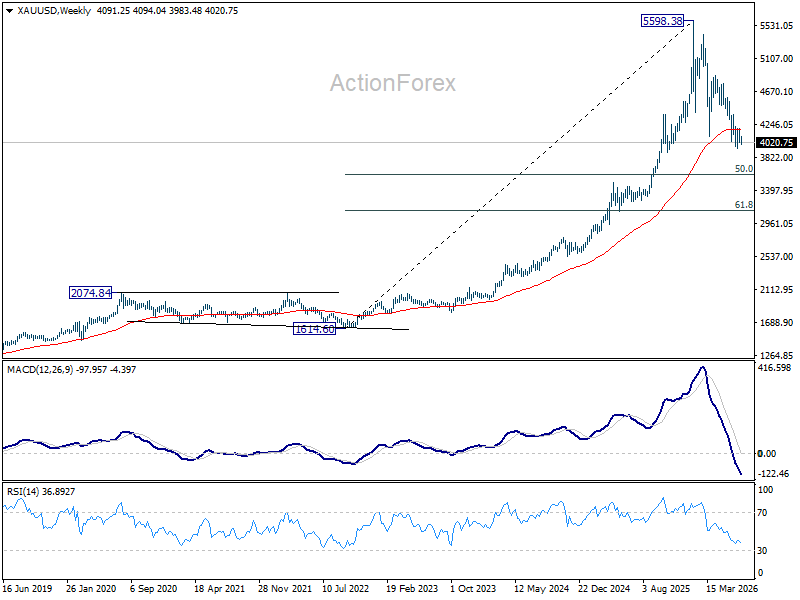
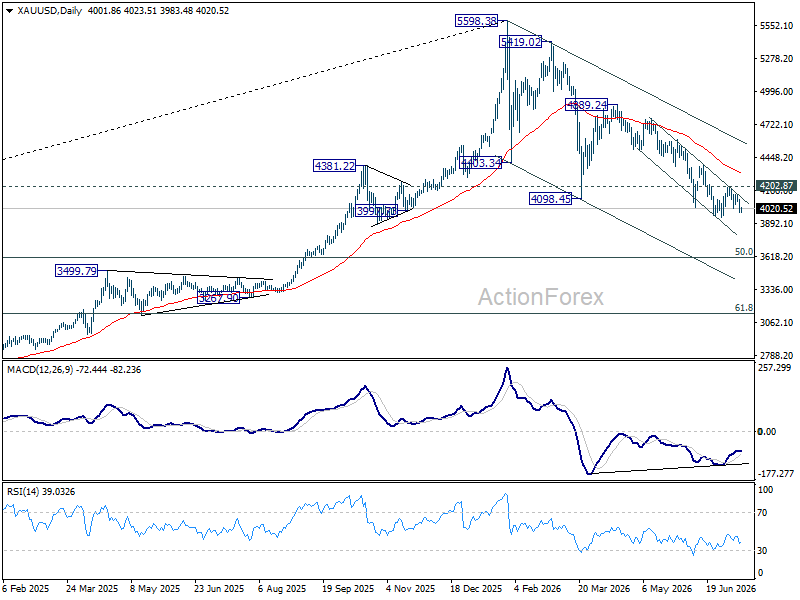
The technical picture reflects that growing pressure. Gold continues to trade comfortably within a well-defined near term falling channel, leaving the decline from the record high of 5,598.38 firmly intact. The 4,000 psychological level has become the market's immediate battleground.
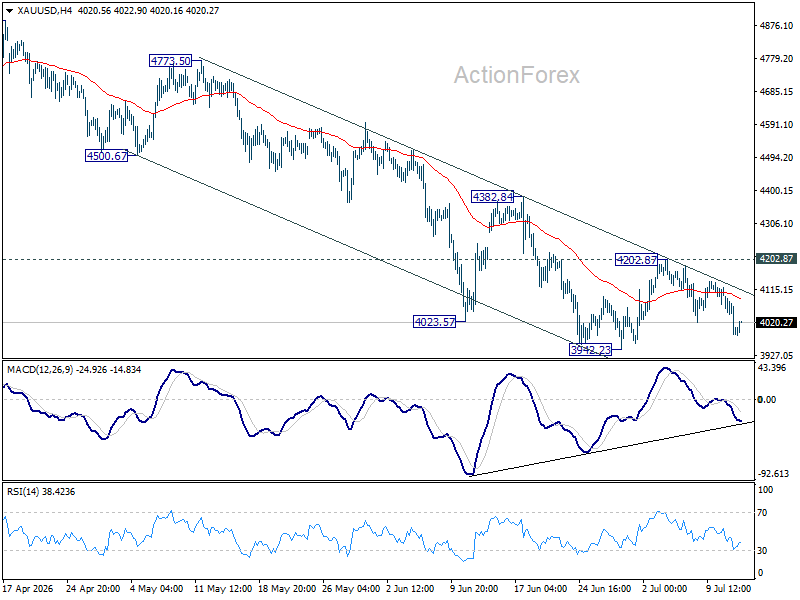
Firm break of 3,942.23 low would resume the whole down trend from 5,598.38 record high. Next target will be 50% retracement of 1,614.60 (2022 low) to 5,598.38 at 3,606.49. Any recovery, meanwhile, is likely to be viewed as corrective while prices remain below 4,202.87.
China Trade Data Crushes Forecasts as Exports and Imports Accelerate in June
China's trade growth accelerated sharply in June, with exports rising 27.0% year-on-year in US dollar terms, up from 19.4% in May and well above expectations of 18.2%. Imports also strengthened markedly, climbing 36.0% from 27.4% previously and beating forecasts of 24.0%. The stronger-than-expected performance lifted the trade surplus to USD 125.6B from USD 105.4B, underscoring resilient external demand despite an increasingly uncertain global environment.
The improvement was broad-based across major trading partners. Exports to the US rose around 14%, suggesting bilateral trade has remained resilient despite tariff headwinds. Shipments to Southeast Asia surged about 35%, reinforcing the region's importance as China's largest export destination, while exports to the European Union increased 18.5%. Technology was a standout driver, with exports of integrated circuits more than doubling from a year earlier to USD 38B, highlighting continued strength in global demand for semiconductors and AI-related supply chains.
One notable exception was energy. Crude oil imports fell -41% from a year earlier to 29.3 million tonnes, likely reflecting lower purchasing following the temporary easing in Middle East tensions during much of the survey period, as well as inventory management after earlier buying.
Economic Data
| Indicator | Actual | Expected | Previous |
|---|---|---|---|
| Exports (YoY) | 27.0% | 18.2% | 19.4% |
| Imports (YoY) | 36.0% | 24.0% | 27.4% |
| Trade Balance (USD) | 125.6B | USD 119.5B | 105.4B |
Market Takeaways
- Both exports and imports significantly exceeded expectations, pointing to stronger-than-expected trade momentum.
- Export growth accelerated to its fastest pace since October 2021, supported by broad-based demand across major trading partners.
- Technology remained a key driver, with integrated circuit exports more than doubling to USD 38B, highlighting continued AI and semiconductor demand.
- Trade with the US, ASEAN and the EU all strengthened, suggesting resilient external demand despite geopolitical and trade uncertainties.
- Crude oil imports fell sharply by 41%, contrasting with broader import strength and reflecting lower energy purchases during much of June.
- The strong trade report provides a positive contribution to China's near-term growth outlook, although renewed Middle East tensions and higher oil prices could alter the trade dynamics in coming months.
Bitcoin Looks Vulnerable as Downside Risks Continue to Mount
Key Highlights
- Bitcoin failed to surpass $65,000 and trimmed some gains.
- BTC/USD traded below a contracting triangle with support at $62,500 on the 4-hour chart.
- Ethereum also struggled above $1,800 and dipped from resistance.
- The US CPI could increase by 3.8% in June 2026 (YoY).
Bitcoin Price Technical Analysis
Bitcoin price attempted to gain pace for a move above $64,500 against the US Dollar but failed. BTC trimmed some gains and signaled a downside break.
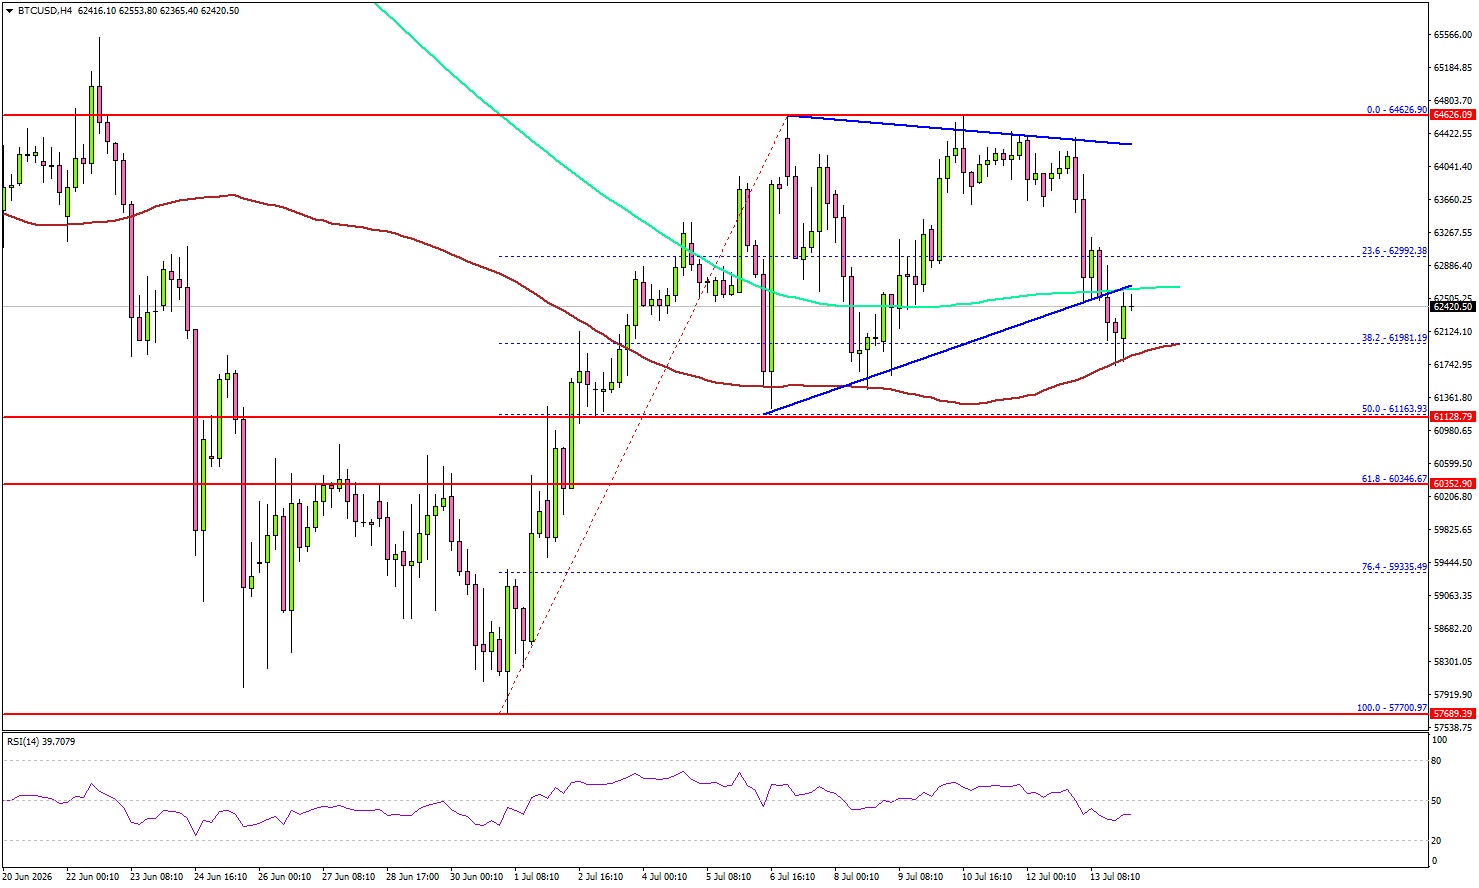
Looking at the 4-hour chart, the price formed a high near $64,626 and started a downside correction. There was a move below $63,500 and $63,200. The price traded below the 23.6% Fib retracement level of the upward move from the $57,700 swing low to the $64,626 high.
More importantly, BTC traded below a contracting triangle with support at $62,500 and the 200 simple moving average (green, 4-hour). If the bears remain in action, the price might find bids near the 50% Fib retracement level at $61,150.
A downside break and close below $61,150 could trigger a sharp decline. In the stated scenario, the price could test $60,350 or even $58,800.
On the upside, an immediate resistance could be $63,800. The first major resistance might be $64,500. The main resistance might be $65,000. A close above $65,000 could send the price toward $66,800. Any more gain might call for a test of $68,000.
Looking at Ethereum, the price seems to be facing a tough hurdle near $1,825 and might start a fresh decline in the near term.
Today’s Key Economic Releases
- US Consumer Price Index for June 2026 (MoM) – Forecast -0.1%, versus +0.5% previous.
- US Consumer Price Index for June 2026 (YoY) – Forecast +3.8%, versus +4.2% previous.
- US Consumer Price Index Ex Food & Energy for June 2026 (YoY) – Forecast +2.9%, versus +2.9% previous.
- Fed Chair Warsh testifies.
- Fed's Barr speech.
- Fed's Goolsbee speech.
- Fed's Cook speech.