Sample Category Title
Dollar Index – Geopolitical Uncertainty and Inflation Concerns to Continue to Provide Support
The US dollar jumped on opening on Monday and quickly reversed gains but remained within approx. $50 range for the day.
Fresh escalation in the Middle East added to inflation concerns and expectations that the Fed would keep its hawkish stance for some time, with news that large pension funds are returning to dollar, after last year’s migration, added to supportive factors.
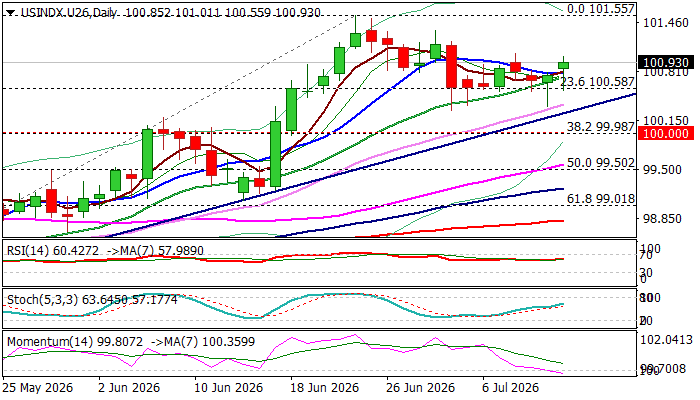
Larger picture shows the index trending higher off 2026 low (95.35) within a bull-channel, though, daily chart shows the action in a narrow-range sideways mode, capped by previously broken Fibo barrier at 100.94 (38.2% retracement of 110.00/95.35 descend) and supported by daily Kijun-sen (100.32).
Daily studies remain predominantly bullish, though 14-d momentum slipped into negative territory that may keep near-term action in directionless mode and keep the downside vulnerable.
However, bullish structure is expected to remain intact while the price holds above trendline support (100.29) and keep focus at 101.55 (new 2026 peak, the highest since early Nov 2025), break of which to signal continuation of an uptrend from 95.35 and expose targets at 101.80 (12 May 2025 peak) and 102.67 (50% retracement of 110.00/95.35).
Caution on break below 100 level (psychological / Fibo 38.2% of 97.44/101.55 upleg) that may sideline bulls for potential deeper pullback.
Res: 101.04; 101.55; 101.80; 102.67
Sup: 100.55; 100.29; 100.00; 99.50
Eco Data 7/14/26
| GMT | Ccy | Events | Act | Cons | Prev | Rev |
|---|---|---|---|---|---|---|
| 22:00 | NZD | NZIER Business Confidence Q2 | 8 | -4 | ||
| 23:01 | GBP | BRC Like-For-Like Retail Sales Y/Y Jun | 1.70% | 3.40% | ||
| 00:30 | AUD | Westpac Consumer Confidence Jul | 4.10% | -2.90% | ||
| 01:30 | AUD | NAB Business Confidence Jun | -5 | -14 | ||
| 01:30 | AUD | NAB Business Conditions Jun | 3 | 3 | ||
| 03:00 | CNY | Trade Balance (USD) Jun | 125.6B | 119.5B | 105.4B | |
| 04:30 | JPY | Industrial Production M/M May F | 0.10% | 0.50% | 0.50% | |
| 06:30 | CHF | Producer and Import Prices M/M Jun | -0.30% | -0.50% | -0.40% | |
| 06:30 | CHF | Producer and Import Prices Y/Y Jun | -2.10% | -1.80% | ||
| 10:00 | USD | NFIB Business Optimism Index Jun | 97.4 | 95.6 | 95.3 | |
| 12:30 | USD | CPI M/M Jun | -0.40% | -0.10% | 0.50% | |
| 12:30 | USD | CPI Y/Y Jun | 3.50% | 3.80% | 4.20% | |
| 12:30 | USD | CPI Core M/M Jun | 0.00% | 0.20% | 0.20% | |
| 12:30 | USD | CPI Core Y/Y Jun | 2.60% | 2.80% | 2.90% |
| 22:00 | NZD |
| NZIER Business Confidence Q2 | |
| Actual | 8 |
| Consensus | |
| Previous | -4 |
| 23:01 | GBP |
| BRC Like-For-Like Retail Sales Y/Y Jun | |
| Actual | 1.70% |
| Consensus | |
| Previous | 3.40% |
| 00:30 | AUD |
| Westpac Consumer Confidence Jul | |
| Actual | 4.10% |
| Consensus | |
| Previous | -2.90% |
| 01:30 | AUD |
| NAB Business Confidence Jun | |
| Actual | -5 |
| Consensus | |
| Previous | -14 |
| 01:30 | AUD |
| NAB Business Conditions Jun | |
| Actual | 3 |
| Consensus | |
| Previous | 3 |
| 03:00 | CNY |
| Trade Balance (USD) Jun | |
| Actual | 125.6B |
| Consensus | 119.5B |
| Previous | 105.4B |
| 04:30 | JPY |
| Industrial Production M/M May F | |
| Actual | 0.10% |
| Consensus | 0.50% |
| Previous | 0.50% |
| 06:30 | CHF |
| Producer and Import Prices M/M Jun | |
| Actual | -0.30% |
| Consensus | -0.50% |
| Previous | -0.40% |
| 06:30 | CHF |
| Producer and Import Prices Y/Y Jun | |
| Actual | -2.10% |
| Consensus | |
| Previous | -1.80% |
| 10:00 | USD |
| NFIB Business Optimism Index Jun | |
| Actual | 97.4 |
| Consensus | 95.6 |
| Previous | 95.3 |
| 12:30 | USD |
| CPI M/M Jun | |
| Actual | -0.40% |
| Consensus | -0.10% |
| Previous | 0.50% |
| 12:30 | USD |
| CPI Y/Y Jun | |
| Actual | 3.50% |
| Consensus | 3.80% |
| Previous | 4.20% |
| 12:30 | USD |
| CPI Core M/M Jun | |
| Actual | 0.00% |
| Consensus | 0.20% |
| Previous | 0.20% |
| 12:30 | USD |
| CPI Core Y/Y Jun | |
| Actual | 2.60% |
| Consensus | 2.80% |
| Previous | 2.90% |
Will AI Earnings for Q2 Disprove ‘Bubble’ Fears?
- Q2 earnings come at sensitive time geopolitically and for the tech sector.
- AI and chip stocks to face scrutiny as Wall Street wobbles.
- Is the AI outlook still optimistic or are fears of a bubble well-founded?
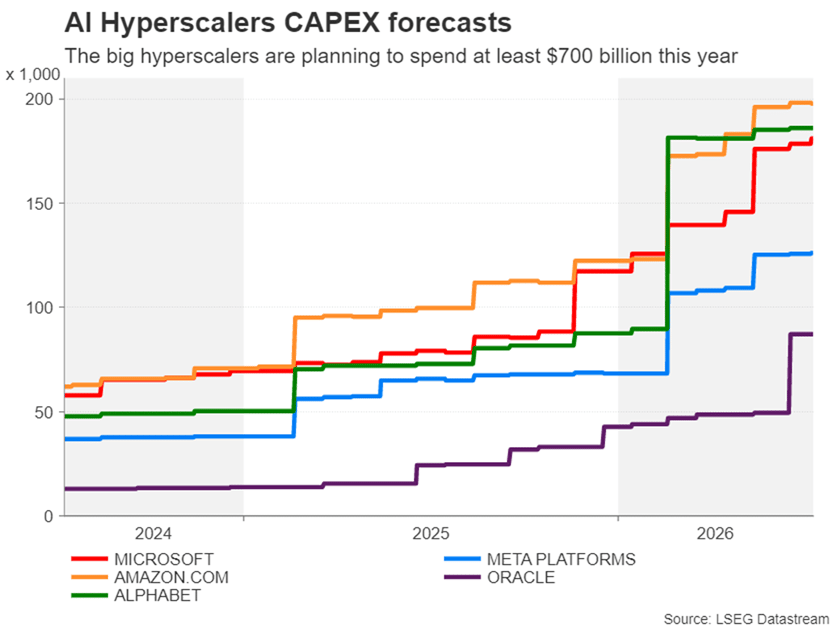
Hyperscalers vs enablers
The Q2 earnings season is here, with Tesla and Alphabet kicking things off for the technology sector on July 22. Artificial intelligence (AI) stocks look set to dominate the season once again. But this time round, the focus is as much on AI enablers, if not more, as it is on the hyperscalers. Specifically, semiconductors were the big winners of the second quarter, as their stocks skyrocketed to new all-time highs.
Soaring demand for AI datacentre infrastructure is proving to be a boon for chipmakers as well as other datacentre equipment manufacturers. These so-called AI enablers are benefiting directly from all the spending on AI by hyperscalers such as Microsoft, Alphabet, Amazon, Meta and Oracle.
Whereas there's a big question mark about whether all the AI investment will pay off for Wall Street's big guys, the earnings prospects for the recipients of this spending are much more of a sure bet. Hence, investors have been piling into chipmakers these past few months, while losing enthusiasm for the usual favourites like the Magnificent Seven (M7).
The semiconductor boom
The Philadelphia Semiconductor sector index, which measures the 30 largest US-traded companies that design and manufacture semiconductors, surged almost 88% in Q2. In comparison, the wider tech index – Nasdaq 100 – was up 27.5%, while the benchmark S&P 500 index gained nearly 15%.
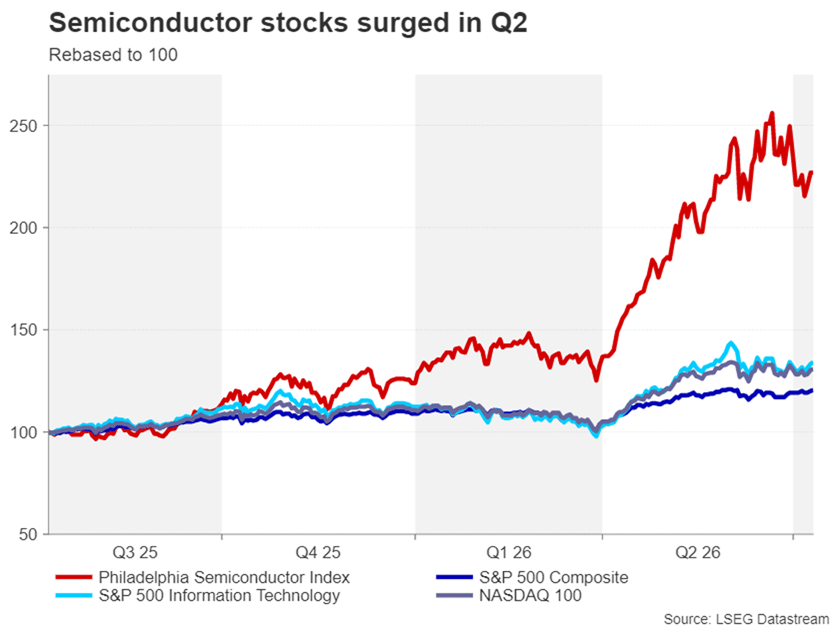
The chip rally has created new trillion-dollar companies, notably Micron Technology and SK Hynix. Interestingly, current AI and chip giant Nvidia's stock performance was more in line with those of the broader indices than the semiconductor gauge, as the company got caught in the AI frenzy much earlier on than its smaller rivals and its rally has started to cool off lately.
Heading into the Q2 earnings season, excitement is running high for the major chip stocks following the bumper earnings reported in the first quarter. The challenge is whether they will be able to sustain similar revenue growth while maintaining the bullish outlook for the upcoming quarters.
Chip stocks lead the way
For traders, though, the risk is that the triple-digit growth of Q1 will be a tough act to follow and therefore the scope for additional gains may be limited. Among the winners, Sandisk, Micron Technology and South Korea's SK Hynix topped the leaderboard, while Meta, Oracle and Microsoft found themselves at the bottom of the table.
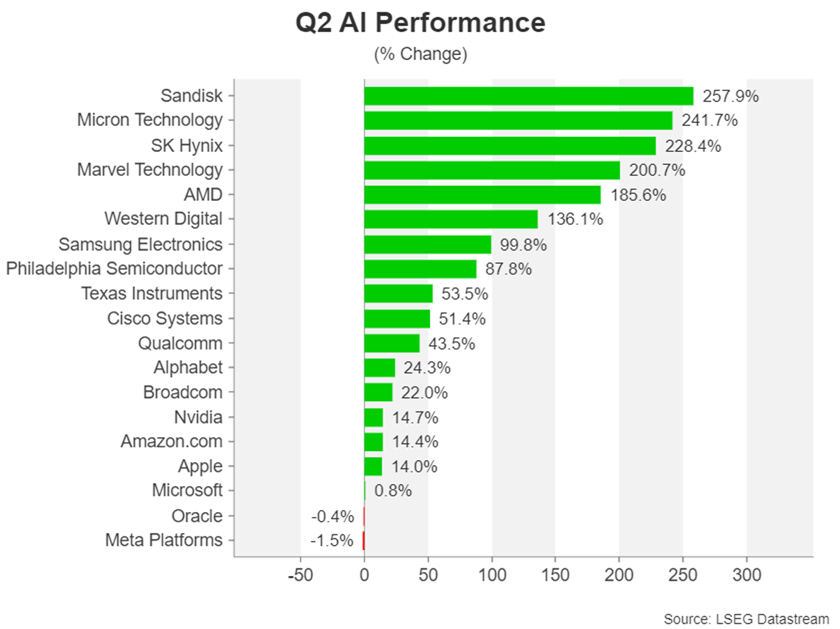
Although Oracle isn't considered part of the Big Tech, worries about its spending plans and balance sheet are casting a shadow on an otherwise healthy earnings growth, as well as on the prospects of other hyperscalers. For Meta and Microsoft, there are growing doubts about their AI ambitions and earnings potentials, which don't stack up as well when compared to their M7 peers like Alphabet and Amazon.
Going forward, the key questions for investors are: Is the strong demand holding up? How much optimism has already been priced into these stocks? And is the scarcity in memory and storage chips easing?
Rosy forecasts
The forecasts are certainly on the optimistic side. According to FactSet, Earnings growth for the S&P 500's Information Technology (IT) sector is estimated at 63.3% y/y for the second quarter, which is the second highest behind the Energy sector (122.9% y/y).
Within the IT sector, semiconductors are doing much of the heavy lifting as their projected earnings growth of 131% far eclipses that of the other sub-sectors.
Apart from the Energy and IT sectors, Materials is the only other sector that's expected to achieve faster earnings growth than the whole of the S&P 500, which is forecast at 23.6%.
Whilst the energy sector had a bumper quarter due to the jump in oil and gas prices from the US-Iran war, the AI boom has started to spread beyond IT, boosting the Materials sector. Specifically, companies engaged in the mining and production of raw materials such as metals are enjoying strong demand from the massive infrastructure spending on datacentres.
Non-tech sectors may struggle
The projections for the other sectors are not as upbeat, with only Utilities expected to achieve earnings growth of more than 10%. Nevertheless, the S&P 500 is headed for a second straight quarter of plus 20% earnings growth and the seventh with double digit growth.
This is an impressive run given the Trade War in 2025 and the Middle East conflict just in the last quarter. But will traders be impressed? Many valuations are already considered to be at extremely overstretched levels, prompting comparisons with the dot-com bubble of the late 1990s.
Elon Musk's Tesla and UK chipmaker ARM Holdings have forward price/earnings (P/E) ratios of 177 and 135, respectively, while Intel's P/E is a lofty 82.5, all of which are far above the S&P 500 trailing average of just over 22. However, some P/E ratios have come down, such as Nvidia's, and there are several chip stocks that still have below 20 P/Es, even after the recent rally.
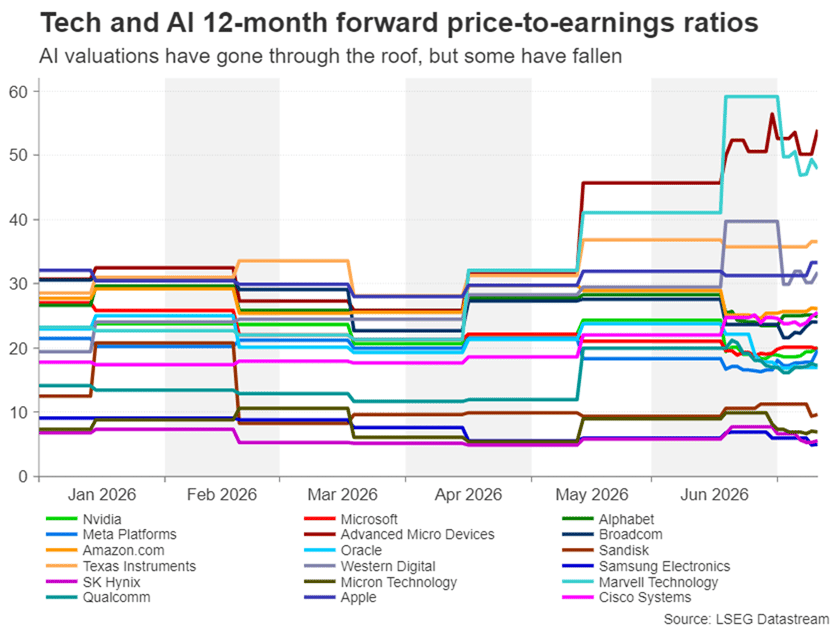
Room to grow?
This suggests that if actual earnings match the expected results over the coming quarters and the outlook remains positive, there's room for much more substantial gains for these stocks before becoming significantly overvalued.
Among them, Micron Technology, Qualcomm, SanDisk, Broadcom, Texas Instruments and Western Digital have all benefited from the explosion in new datacentres. The huge surge in demand has led to shortages in memory and storage chips, pushing up gross margins for the major producers. But others such as Advanced Micro Devices and Marvell Technology are looking somewhat overvalued with P/Es in the 50 region.
Nevertheless, with renewed jitters about the sustainability of the AI boom sparking a big selloff in chip stocks, the lower valuations may represent a buy-the-dip opportunity, even for some of the more expensive stocks. Yet, many traders will probably prefer to stay put until they've gotten a glimpse of what the new earnings season holds for the AI industry and the shifting dynamics within it.
Diverging valuations
Without a doubt, investors will be hoping to see continued double-digit growth in earnings in Q2 as well as upbeat guidance for the next few quarters. Any signs of a slowdown in revenue growth would likely spook markets. But it's important to highlight that the risks differ for the hyperscalers and enablers.
The key concern for the hyperscalers is that the record amount of capital expenditure being poured into AI is not delivering a satisfactory return on investment, particularly for those that are drying up their entire cash flows or resorting to new debt issuance to finance their AI ambitions.
The scarcity of memory chips and other AI components is also a problem for the hyperscalers, posing a two-way challenge, as it not only limits supply but also pushes up costs. Even the likes of Apple and Microsoft have been forced to hike the prices of some of their products, as margins have come under pressure. But for enablers, this is the windfall that's been fuelling their stocks higher.
Risks to the outlook
That's not to say that chip and AI equipment manufacturers are not susceptible to shortages themselves along the supply chain. Chipmakers additionally run the risk of overinvesting in their drive to expand production, potentially leading to a supply glut down the line.
The other danger for chipmakers is if the White House were to decide to loosen restrictions on Chinese memory chips – something Apple is lobbying the Trump administration for, easing the supply crunch and squeezing margins.
Beyond the AI-related developments, which are constantly evolving, there's the turbulent geopolitical landscape, amid the ongoing US-Iran tensions that are boosting inflationary pressures by putting a strain on energy flows from the Gulf, and a more uncertain period of Fed policy, with rate hikes back on the horizon. The aforementioned have increased the risk of economic slowdown both in the United States and globally. A sharp economic pain makes it more likely that the big AI spenders would tighten their purse strings at some point, hurting AI enablers the most.
One might be asking, would Nvidia also be impacted from a cutback in AI investment? After all, the company has an order backlog of $1 trillion. But this is surely already priced into its stock price, so the answer is probably yes.
AI industry: It's complicated
It's important to bear in mind, however, that not all chipmakers are the same. Each serves a specific purpose within the processor architecture and semiconductor supply chain and therefore will be impacted differently by the AI headlines. Add to the mix the Big Tech hyperscalers and their varied fundamentals and the picture gets even more complicated.
One positive outcome of this is that it allows investors to rotate within the wider tech sector as demand and industry trends change. This pattern went into full swing in the second quarter and although it makes it more difficult to predict which way AI stocks will go, it's a reminder that much of the AI industry is still in its infancy.
The Q2 earnings season will likely go only a small way in clearing all this up but will nonetheless be crucial in determining the short-to-medium term momentum in the AI trade. The one thing that has become more certain is that tech and AI stocks are more prone to large daily swings, warranting extra caution when trading them.
Sunset Market Commentary
Markets
At the start of the new trading week markets continued to 'mark-to-market' the recent flaring up of hostilities between the US and Iran. Aside multiple other sources of disagreement, the key point of the current re-escalation clearly concerns the management of (free?) traffic across the Strait of Hormuz. The US until now advocated a free transit, but even President Trump in an interview suggested that it could get paid for guarding the passage. Iran on the other hand wants to hold control over the traffic via permissions and passage only via (Iranian) approved corridors. Both parties for now avoid a return to an outright war as it occurred before signing the Memorandum of Understanding/cease-fire mid-June. From a market point of view, the oil price regained its status as guide for other markets. At $78/b Brent oil again trades well off the corrective lows touched early this month, but at the same time they show no outright panic yet. As a closely watched pointer especially for European energy costs, the reference Dutch natural gas contract (TTF) today returned north of €50/MWh (currently €51), the highest level in over a month. If sustained, these kind of levels might again erode the more benign inflation picture as it emerged from the June (EMU) inflation data. Developments can change quickly in both directions, but for now the by default momentum is for yields to grind higher. In a session devoid of any other market-relevant economic news, German yields currently add between 5 bps (2-y) and 2 bps (30-y). Money markets discount a 90% probability for a next 25 bps ECB step by September. UK Gilts even slightly underperform with yields rising between 9 bps (2-y) and 5.5 bps (30-y) as higher inflation expectations question the BoE's wait-and-see stance and as markets still try to get some insight in the budget intentions of the new Burnham government. US yields also trade with an upward bias, but in a more modest way than in the UK and Europe. US yields add between 1-3 bps across the curve. US June CPI figures (tomorrow) and Kevin Warsh's first Testimony for Congress (tomorrow and on Wednesday) are first 'autonomous' US topics to guide US interest rate markets. At least on (European) equity markets, the reaction to the new flaring up of Middle East tensions happens orderly. The Eurostoxx 50 trades little changed. US indices open mixed with the Nasdaq underperforming (-0.60%), capturing some of the nervousness in chip-stocks in Asia (in particular South Korea), this morning. In line with recent price action, geopolitical noise hardly leaves any traces on the major USD cross rates. DXY trades little changed near 100.9. EUR/USD even gains marginally in a technically irrelevant move (EUR/USD 1.1425). The yen reverses most of Friday's gains as markets understood that it is premature to expect a change in the strategy of the Government Pension Investment Fund to yield any positive flows to support Japanese government bonds and/or the yen. USD/JPY rebounded north of 162. Sterling slightly underperforms the euro, with EUR/GBP trading near 0.853 despite a rising interest rate advantage for the UK currency.
News & Views
Sources told Reuters that Japan's Government Pension Investment Fund, the world's largest, has no immediate plans to change its target asset allocations. Markets jumped to such a conclusion after finance minister Katayama last Friday said the government was pondering ways to encourage pension funds, including the GPIF, to make substantially greater investments in Japanese financial assets. It prompted sudden JPY, JGB and Japanese equity strength on expectations for potentially huge capital flows to be repatriated back into the local market. What the likes of GPIF could do, the sources said, is to work within existing allowable ranges compared to the benchmark portfolio. For domestic bonds, for example, the fund is allowed a 6 ppt deviation range around the 25% target allocation. Both the yen and JGBs today give back about half of Friday's gains.
Indian inflation accelerated more than expected to 4.38% in June from 3.93% in May. That brings it above the central bank's 4% (+/- 2 ppt deviation range) mid-point target for the first time in about one-and-a-half years. Food inflation, amongst others, quickened to 5.32% with a strong spring harvest being offset by expectations for El Niño related supply disruptions. Transport prices jumped as well, from 1.75% to 4.31%. Prices in restaurants and accommodation meanwhile are picking up a 50% increase in commercial cooking gas prices at the start of the month. Core inflation held at 3.9%. The central bank left its policy rate unchanged at 5.25% during last month's meeting but raised its inflation forecast to 5.1% for the fiscal year ending in March. Governor Malhotra said monetary policy would only respond if price pressures broadened although it is watching oil and food price developments closely.
Dollar Stalls Despite Iran Escalation Ahead of Critical CPI and Fed Warsh Testimony
Escalating conflict in the Middle East would normally be enough to send the Dollar sharply higher. Instead, markets hesitated. Brent crude climbed above $79 after the weekend's dramatic expansion of the US-Iran conflict, but stopped short of the $80 threshold that could trigger a broader inflation repricing. Besides, rather than rebuilding aggressive Dollar longs, traders opted to wait for Tuesday's US June CPI report and Kevin Warsh's first congressional testimony as Federal Reserve Chair, two events that could prove far more consequential for the policy outlook than the latest geopolitical headlines.
The restrained market reaction suggests investors are not yet convinced that the latest escalation will produce a sustained energy shock. Although Iran widened its retaliation across several Gulf states and the US launched its largest strikes of the conflict, Brent has yet to establish itself decisively above $80. That hesitation indicates traders are still reluctant to restore the full geopolitical risk premium that faded after oil prices retreated in recent weeks. Without a convincing break higher in crude, markets have little reason to materially revise inflation expectations or Fed pricing.
Attention is instead firmly fixed on an unusually important sequence of events in Washington. June CPI will be released at 12:30 GMT on Tuesday, with Warsh appearing before the House Financial Services Committee roughly 90 minutes later in his first congressional testimony since becoming Fed Chair. The Senate Banking Committee hearing follows on Wednesday, allowing lawmakers to respond after markets have had time to digest both the inflation data and Warsh's initial comments. The timing is exceptional, giving investors an almost immediate indication of how the new Fed Chair interprets a critical inflation report.
Friday's Monetary Policy Report provides the framework for both the CPI release and Warsh's testimony. As the semiannual Humphrey-Hawkins report, it effectively serves as the blueprint for his prepared remarks. The report described the US economy as expanding at a solid pace, with Q1 GDP growing at a 2.1% annualized rate, supported by strong high-tech investment and a rebound in government spending, while consumer spending remained only modest and residential investment stayed weak. The labor market was characterized as broadly stable, with unemployment holding at 4.2%, supported by slowing labor-force growth even as private payroll gains strengthened.
Inflation remains the central issue. The report highlighted headline PCE inflation accelerating to 4.1% and core PCE to 3.4%, attributing the increase to three specific forces: tariff-driven import prices, higher energy costs linked to Middle East supply disruptions, and stronger AI-related demand for technology goods. At the same time, housing services inflation has continued to ease, suggesting underlying inflation pressures are becoming less broad-based. That framework means Tuesday's CPI report will be judged less by the headline figure alone than by whether energy prices and core goods continue to account for most of the inflation strength.
Currency markets reflected that cautious positioning. New Zealand Dollar outperformed after the BusinessNZ Performance of Services Index returned to expansion, reinforcing signs the domestic recovery is regaining momentum. Canadian Dollar also found support from stronger oil prices ahead of Wednesday's Bank of Canada policy decision, while Euro traded firmer. At the other end of the spectrum, Yen remained under pressure as optimism surrounding Japan's government pension fund initiative continued to fade, with Swiss Franc and Australian Dollar also lagging. Sterling and Dollar traded closer to the middle of the performance table as investors preferred to await Tuesday's potentially market-defining events.
Markets Ran Ahead of Tokyo: Yen Weakens as GPIF Expectations Meet Reality
Markets pared expectations of an imminent overhaul of Japan's GPIF investment strategy after officials clarified there are no immediate plans to revise the pension fund's benchmark asset allocation. The Yen weakened as investors unwound Friday's optimism, while stronger New Zealand services data reinforced the country's economic recovery, helping NZD/JPY extend its rebound toward key resistance at 93.80. Read More.
Brent Oil May Target $85 If US-Iran Escalation Pushes It Through $80
Brent oil surged above $79 after US-Iran conflict widened into a multi-country confrontation across Gulf. Attack on commercial shipping, Iran’s claim that Strait of Hormuz is closed and broader retaliation against US-aligned states have raised risk of prolonged disruption. Technically, firm break above 80.59 could open way toward 85.67, close to 55-day EMA at 85.59. Read More.
New Zealand BNZ PSI: Services Sector Returns to Expansion, but Recovery Still Tentative
New Zealand's services sector returned to expansion in June as the BusinessNZ PSI rose to 50.6 from 48.0, ending five months of contraction. Strong gains in new orders suggest demand is improving, but employment and activity remained below 50, indicating the recovery is still in its early stages. The data reinforce expectations that economic growth is recovering gradually without materially changing the RBNZ's cautious policy outlook. Read More.
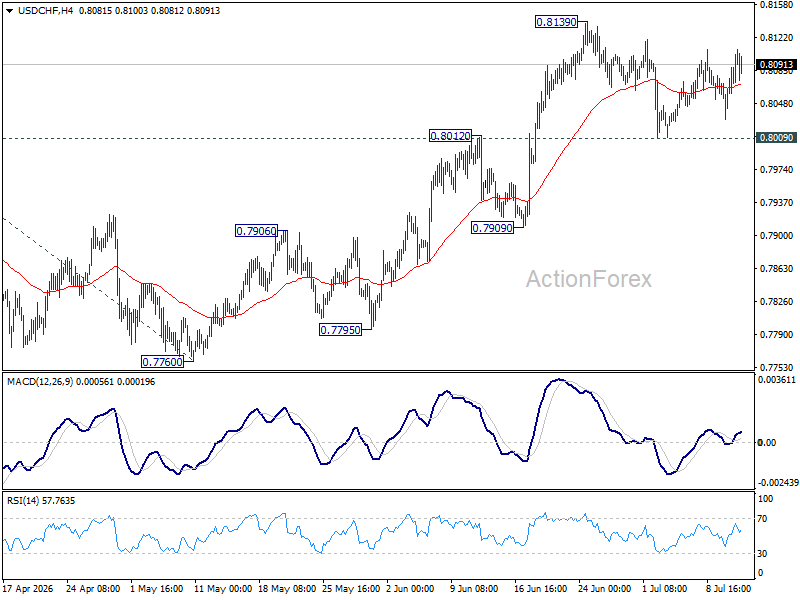
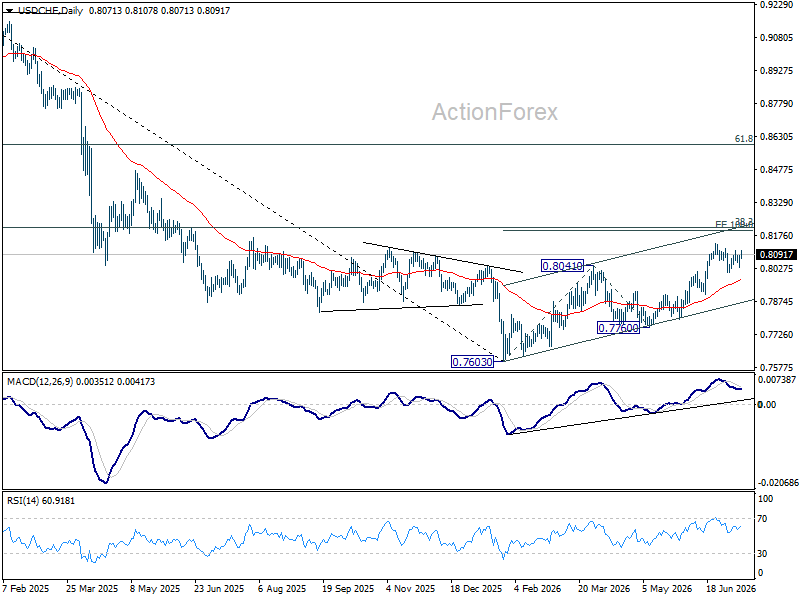
USD/CHF Daily Outlook
Range trading continues in USD/CHF and intraday bias stays neutral. With 0.8009 support intact, further rise is expected. On the upside, above 0.8139 will extend the rally from 0.7760 to 100% projection 0.7603 to 0.8041 from 0.7600 at 0.8198 next. However, sustained break of 0.8012 will bring deeper fall to 0.7909 support instead.
In the bigger picture, while a medium term bottom was formed at 0.7603, it's still early to call for bullish trend reversal. As long as 38.2% retracement of 0.9200 (2025 high) to 0.7603 at 0.8213 holds, the larger down trend could still continue through 0.7603 at a later stage. However, firm break of 0.7603 will argue that the trend has reversed and turn focus to 0.8332 support turned resistance (2023 low) for confirmation.
Ethereum Wave Analysis
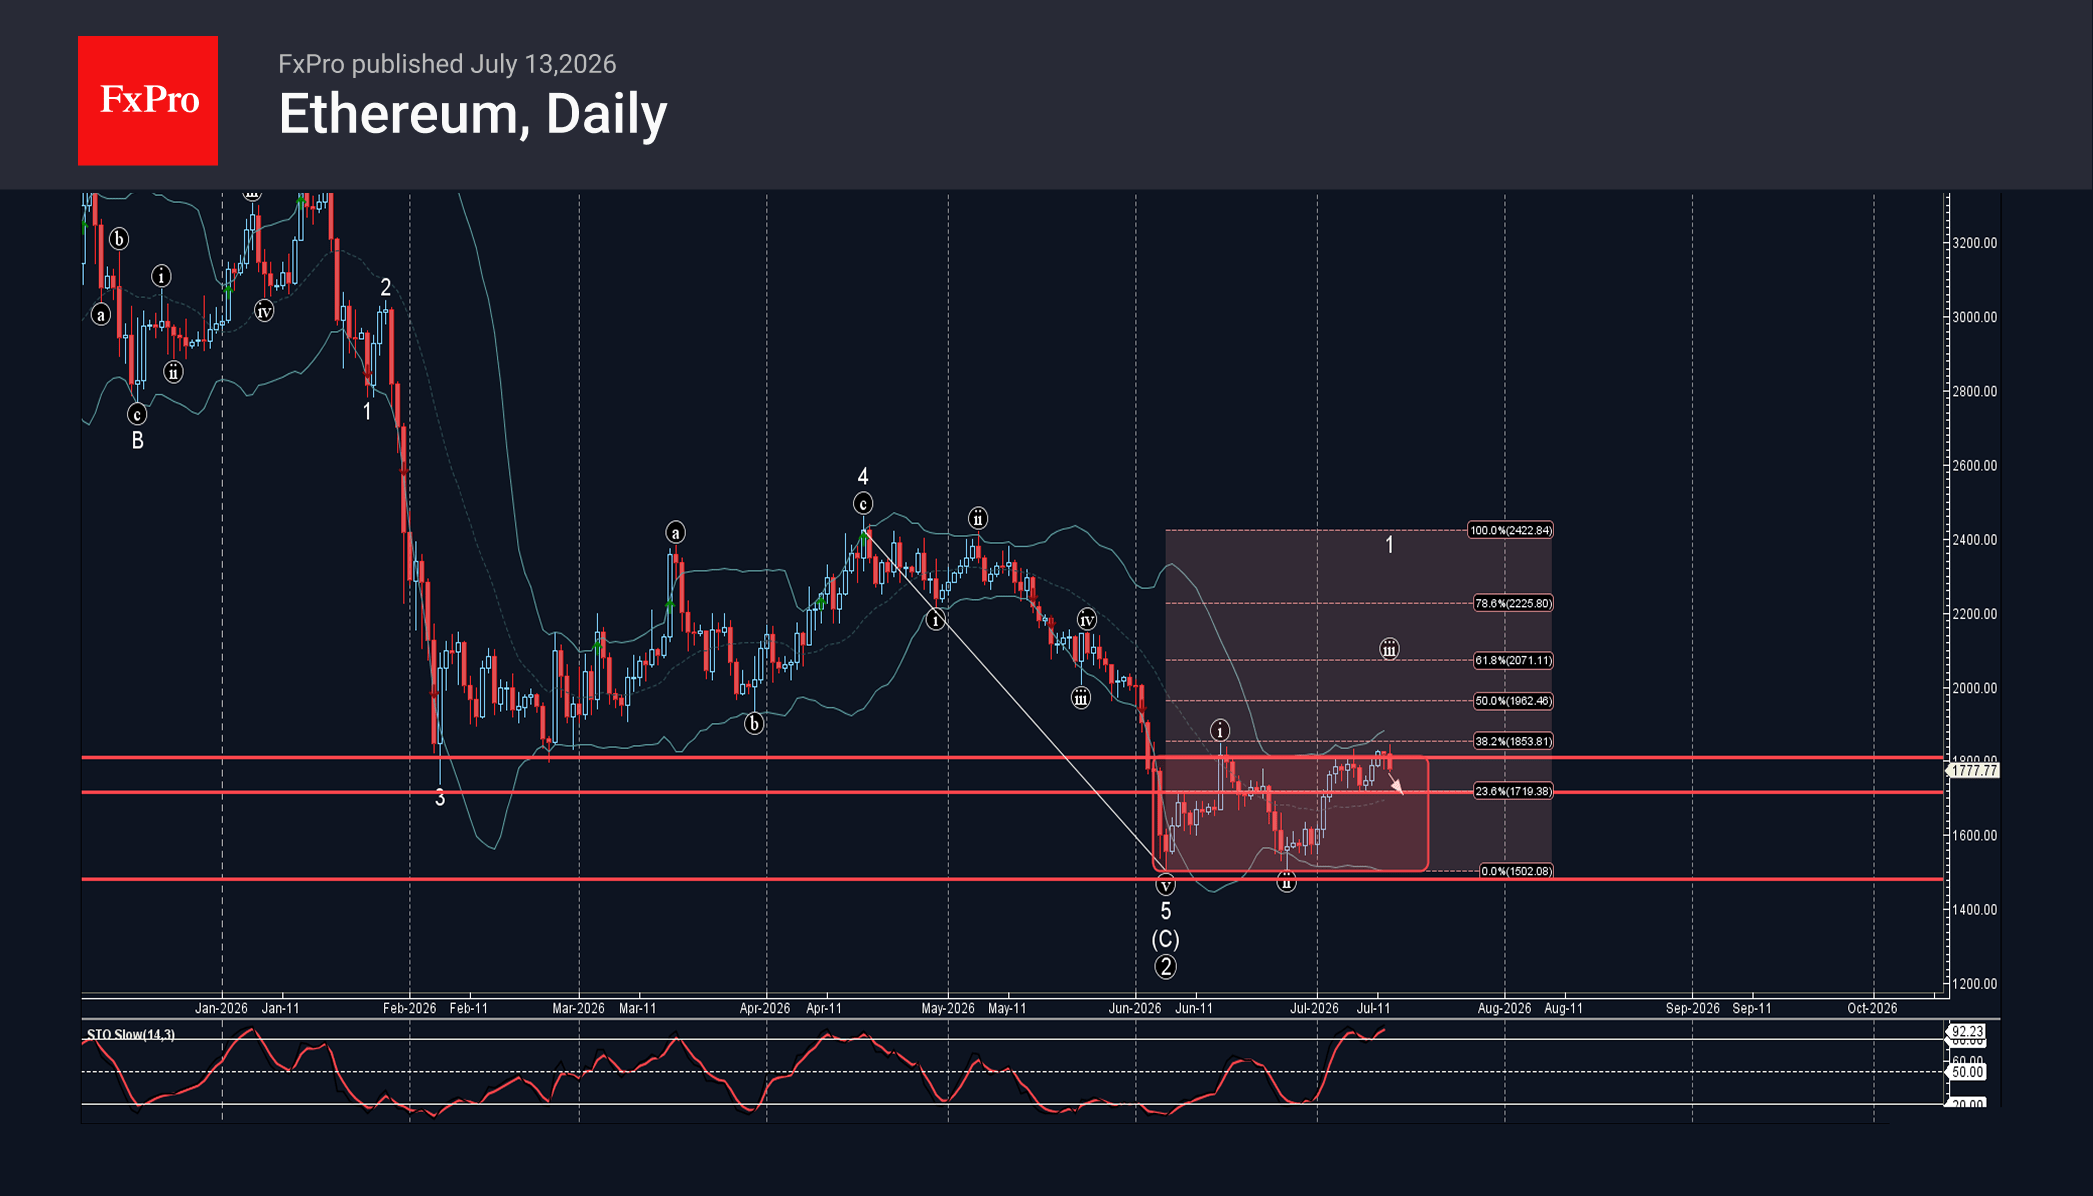
Ethereum: ⬇️ Sell
– Ethereum reversed from resistance level 1800.00
– Likely to fall to support level 1715.0.
Ethereum cryptocurrency recently reversed down from the resistance zone between the key resistance level 1800.00 (which stopped wave i in June) and the upper daily Bollinger Band.
This resistance zone was further strengthened by the 38.2% Fibonacci correction level of the previous sharp downward impulse from April.
Given the strong daily downtrend and overbought daily Stochastic, Ethereum cryptocurrency can be expected to fall further to the next support level 1715.0.
GBPJPY Wave Analysis
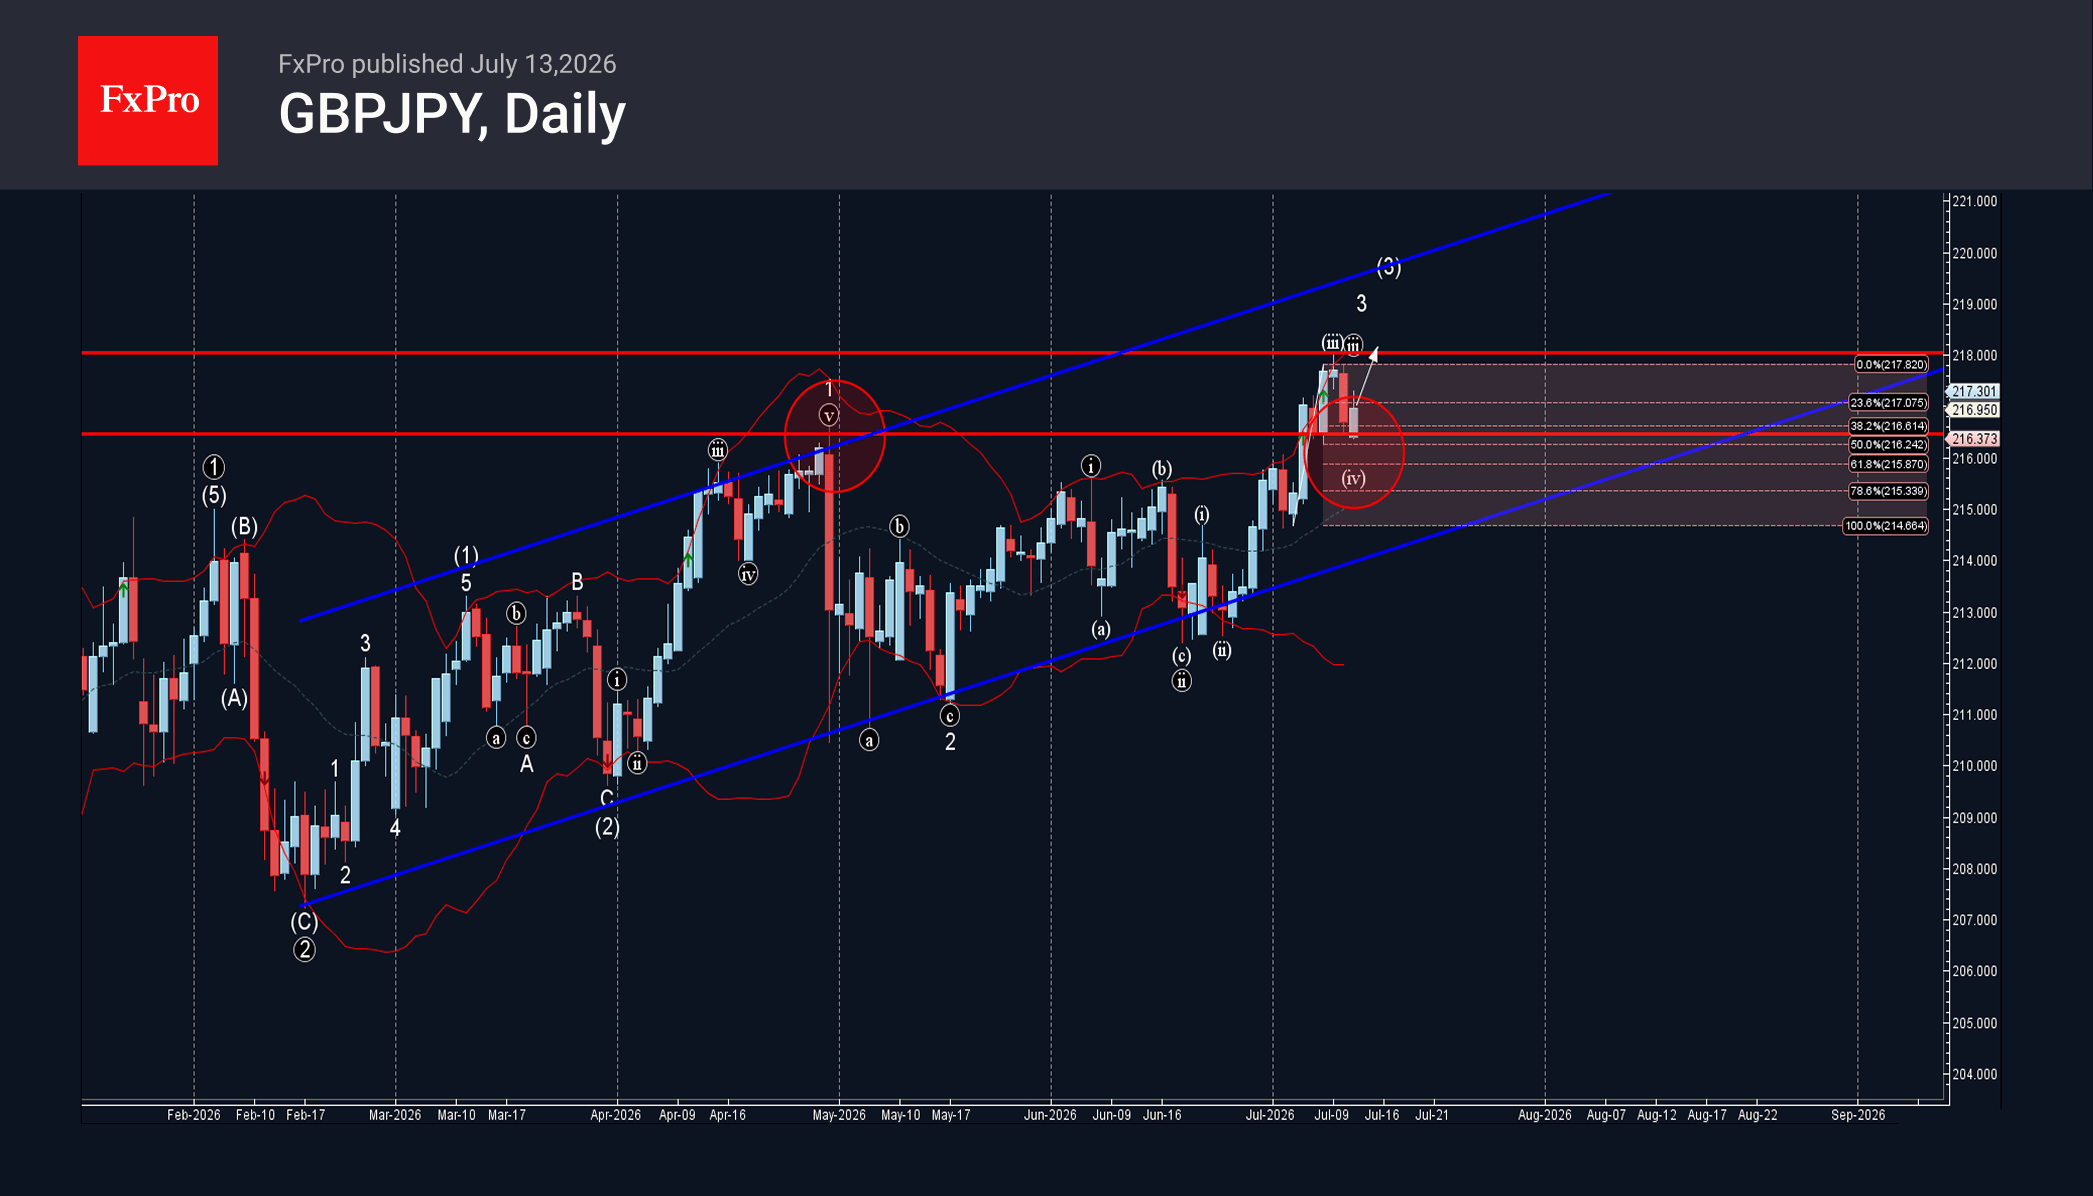
GBPJPY: ⬆️ Buy
– GBPJPY reversed from support zone
– Likely to rise to resistance level 218.00
GBPJPY currency pair recently reversed down from the support zone between the pivotal support level 216.50 (former monthly high from April) and the 50% Fibonacci correction of the upward impulse from the start of July.
The upward reversal from this support zone continues the active impulse waves v, 3 and (3).
Given the clear daily uptrend and bearish yen sentiment seen today, GBPJPY currency pair can be expected to rise further to the next resistance level 218.00 (which stopped earlier wave iii).
The Dollar: Will the CPI and Warsh Decide Everything This Week?
- Geopolitics, Kevin Warsh and inflation data are likely to cause sharp fluctuations in the USD index.
- Gold is under pressure from real Treasury yields.
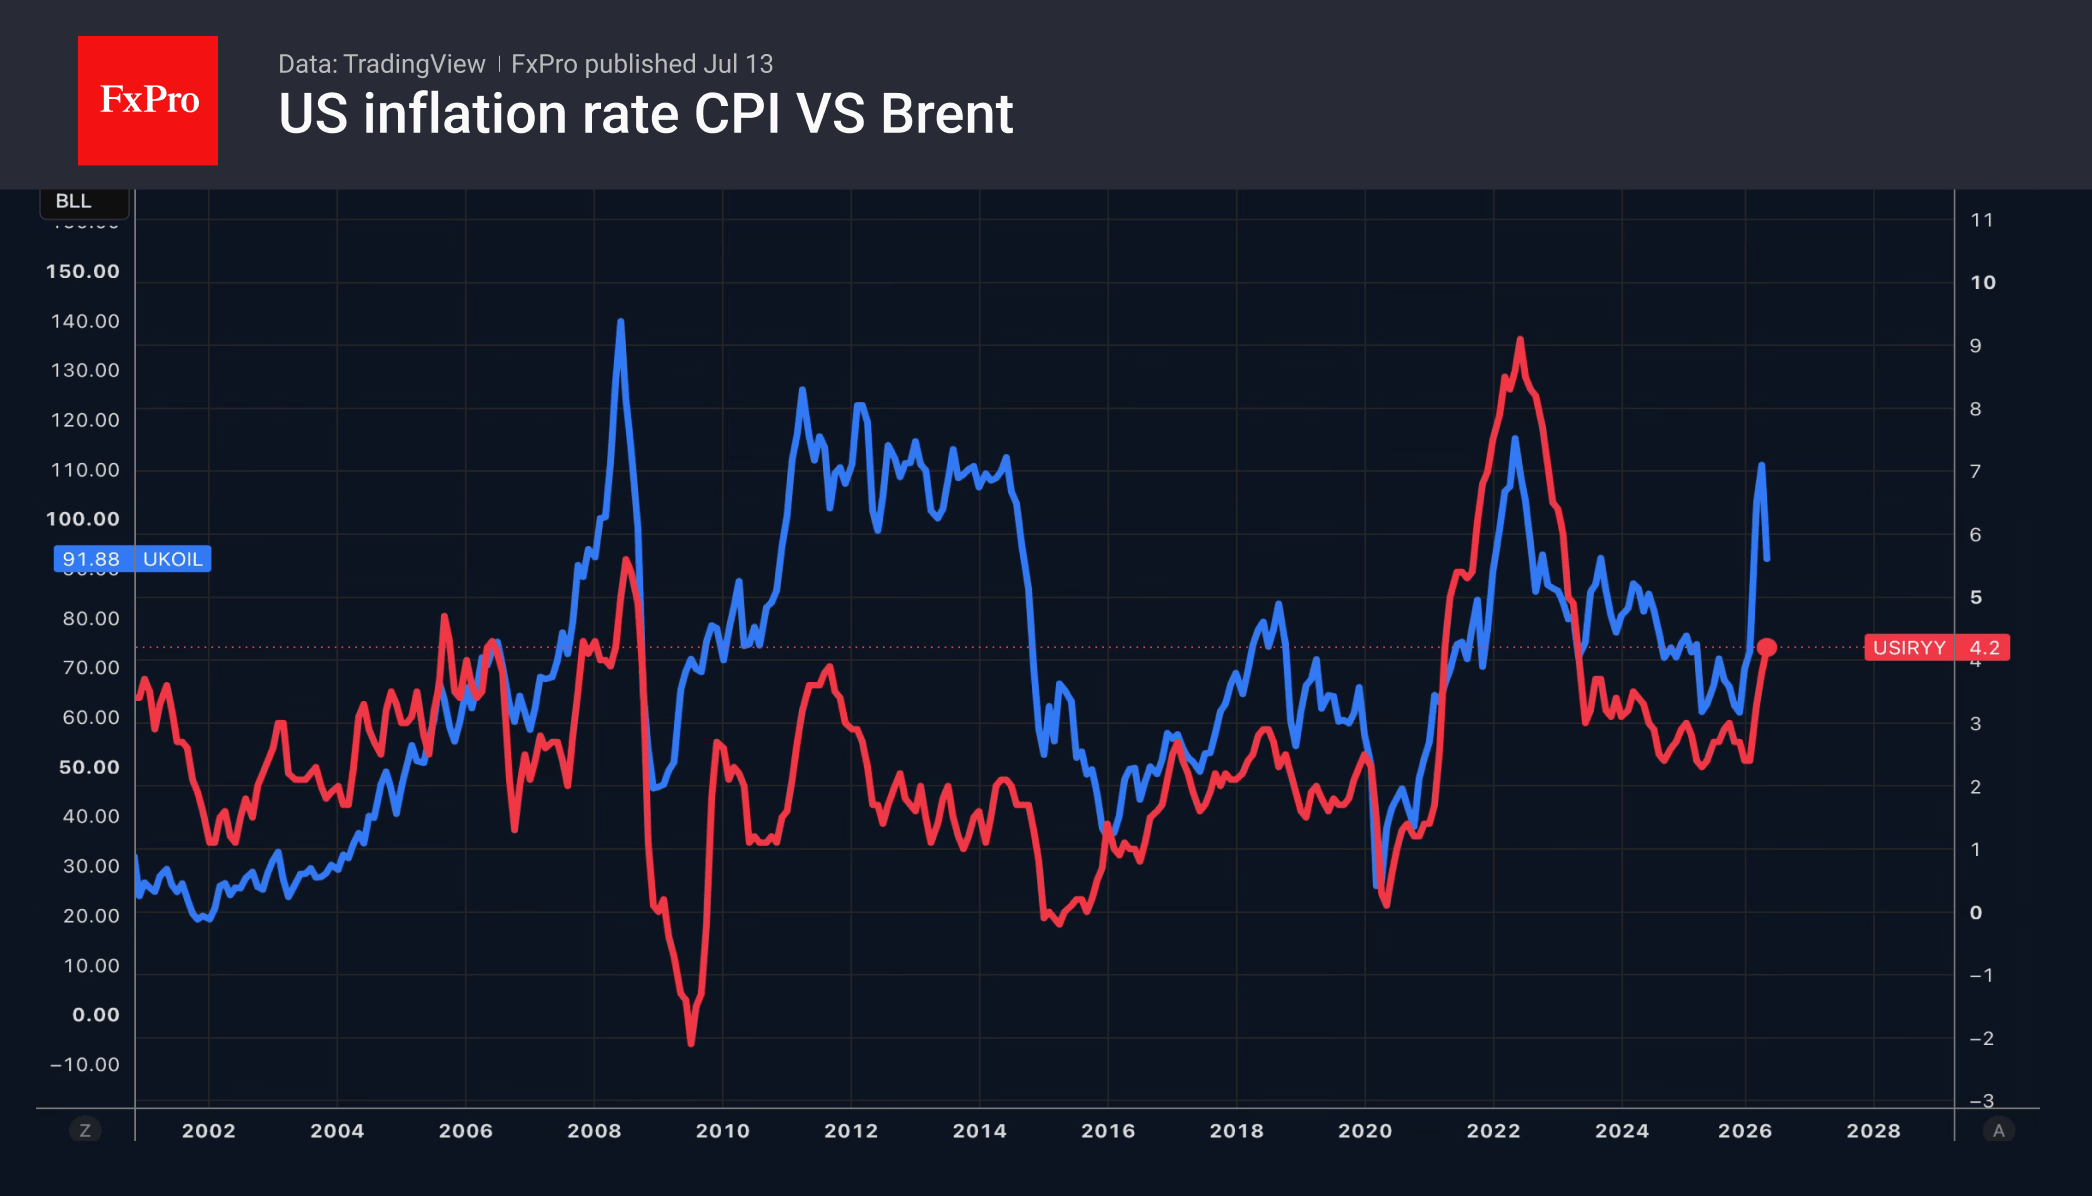
The US dollar began the week on an upward trend against the backdrop of escalating tensions in the Middle East. Donald Trump declared that the ceasefire is over, whilst Tehran denied the White House’s claims that it was seeking opportunities for negotiations. Confrontation is evident, and with it, the direct correlation between oil prices and the dollar is re-emerging.
Markets are factoring geopolitics into their expectations of potential Fed rate adjustments. Consequently, the probability of two rate rises in 2026 has risen from 36% to 50% over the past week.
However, investors’ attention is focused not only on geopolitics, but also on the release of US inflation figures for June and Kevin Warsh’s testimony before the US Congress. Warsh has twice caused turmoil in the financial markets. First, at his first FOMC meeting, he stated that the Fed intended to do everything in its power to bring consumer prices back to target, which caused the dollar to rise. Then, in Sintra, Portugal, the new Fed Chair’s comments on progress in the fight against inflation, by contrast, weakened the greenback.
Consumer prices are expected to fall by 0.1% month-on-month in June, marking the first decline since the pandemic and suggesting the indicator peaked in May. However, FOMC hawks may seize upon the acceleration in core inflation from 0.2% to 0.3% month-on-month. The market’s reaction will depend on the actual figures.
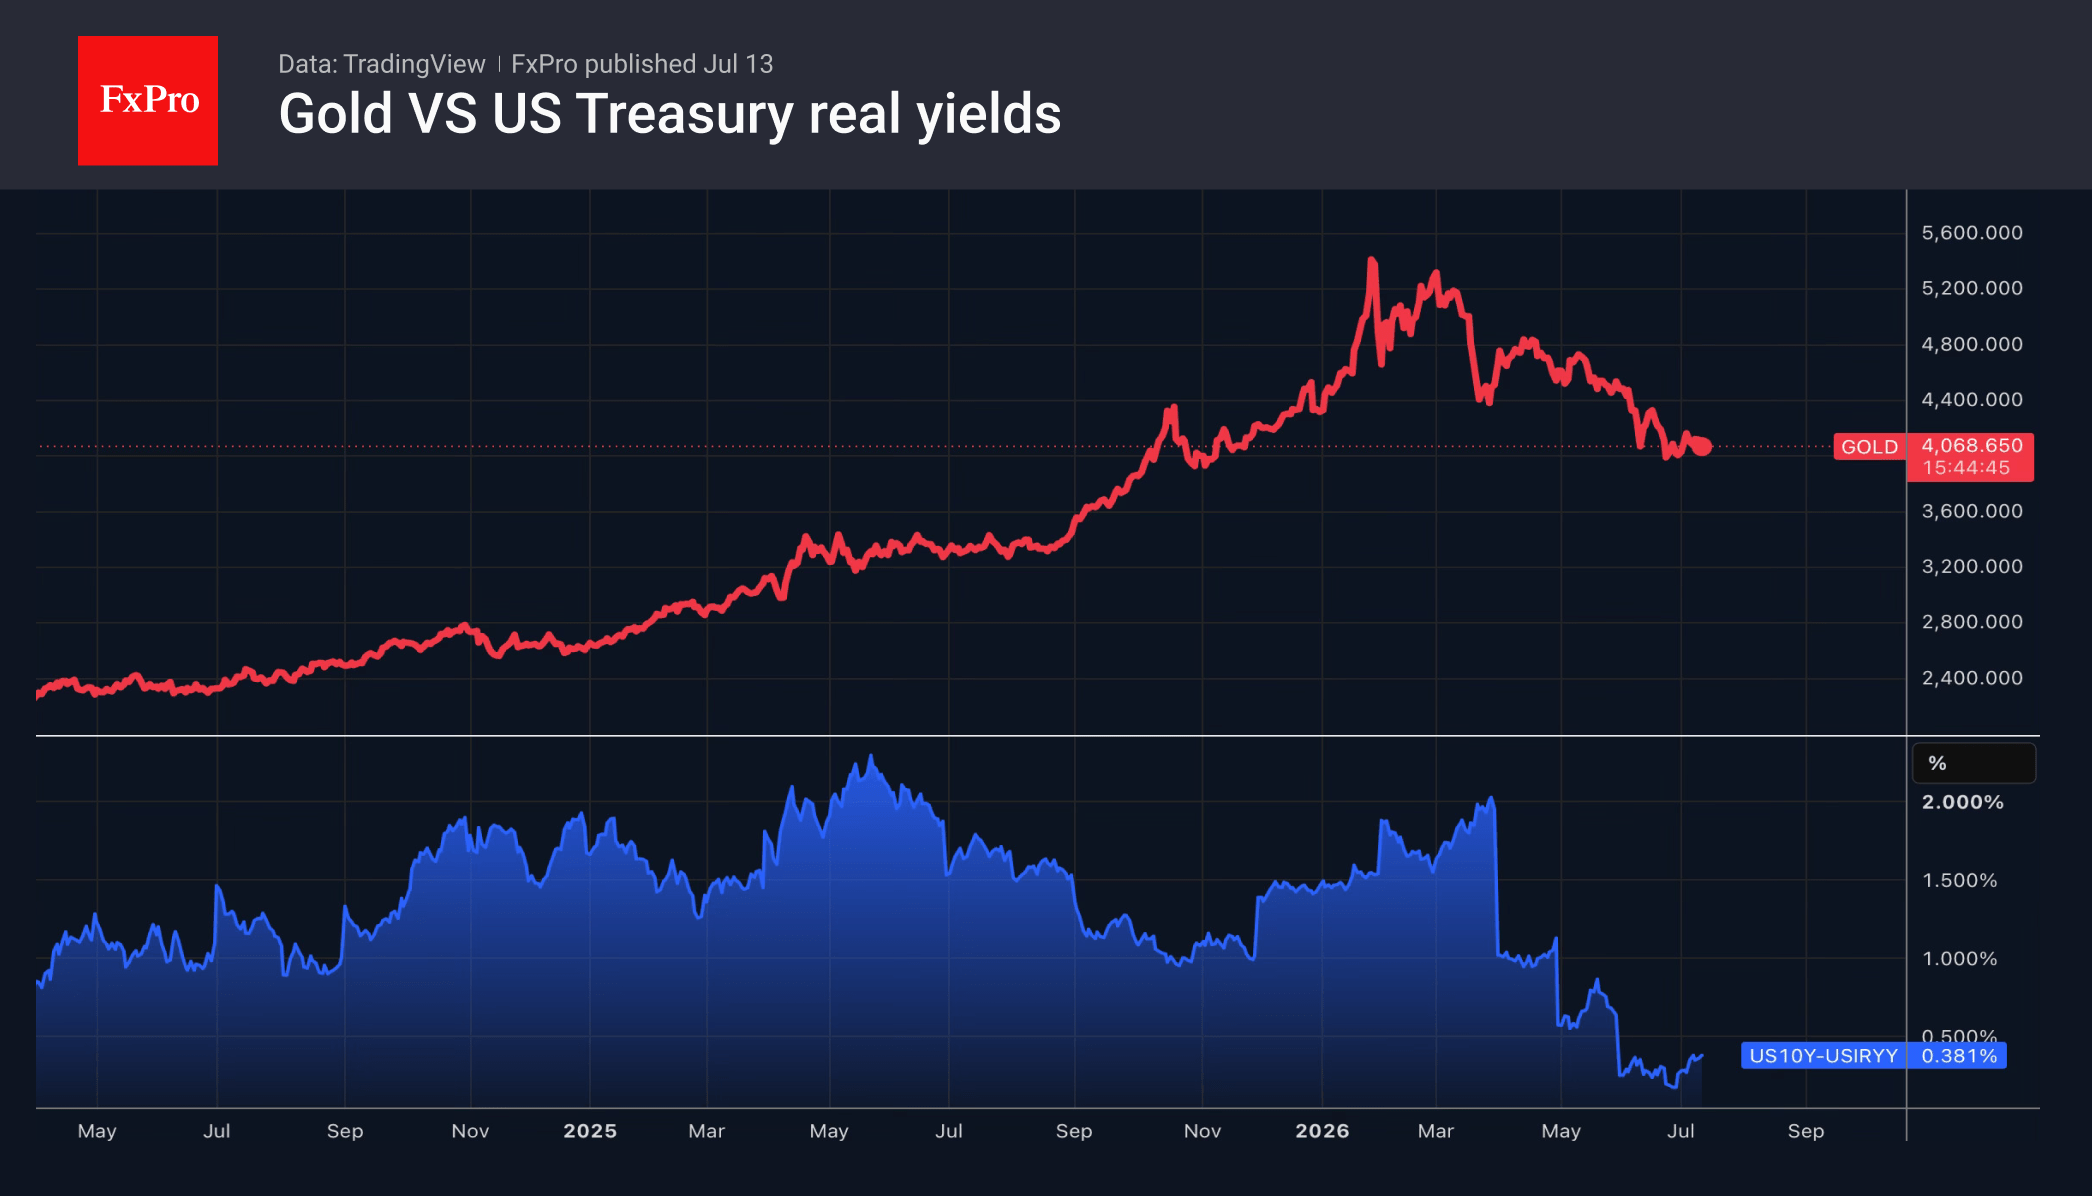
The escalation of the conflict in the Middle East has caused gold to retreat towards $4,000 per ounce. The precious metal is sensitive to movements in real Treasury bond yields, which for 10-year bonds have reached their highest level in over a year. This, combined with the strengthening of the US dollar and the increasing likelihood of aggressive monetary tightening by the Fed, is creating headwinds for gold.
The FxPro Analyst Team
EUR/USD Daily Outlook
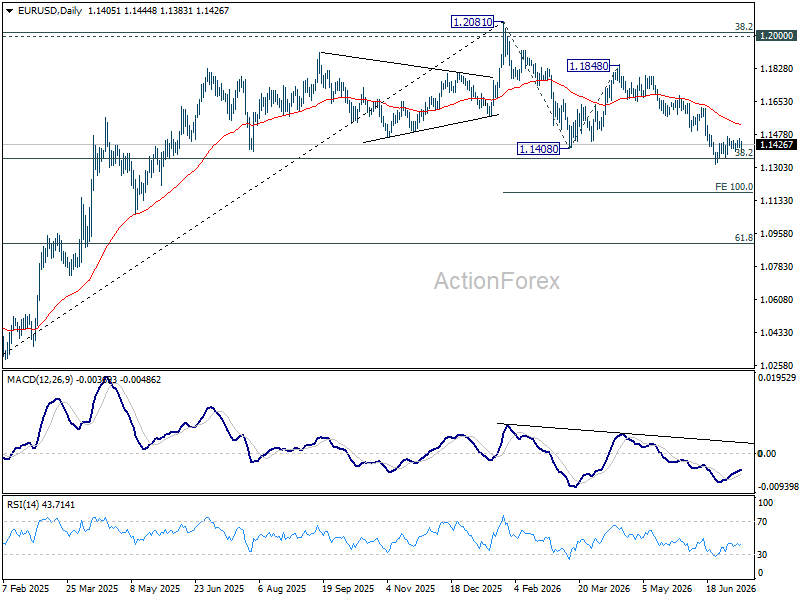
Intraday bias in EUR/USD remains neutral and more consolidations would be seen above 1.1323. With 1.1499 support turned resistance intact, further decline is expected. On the downside, break of 1.1323 will resume the fall from 1.2081 to 100% projection of 1.2081 to 1.1408 from 1.1848 at 1.1175. However, decisive break of 1.1499 will turn bias back to the upside for 1.1621 resistance.
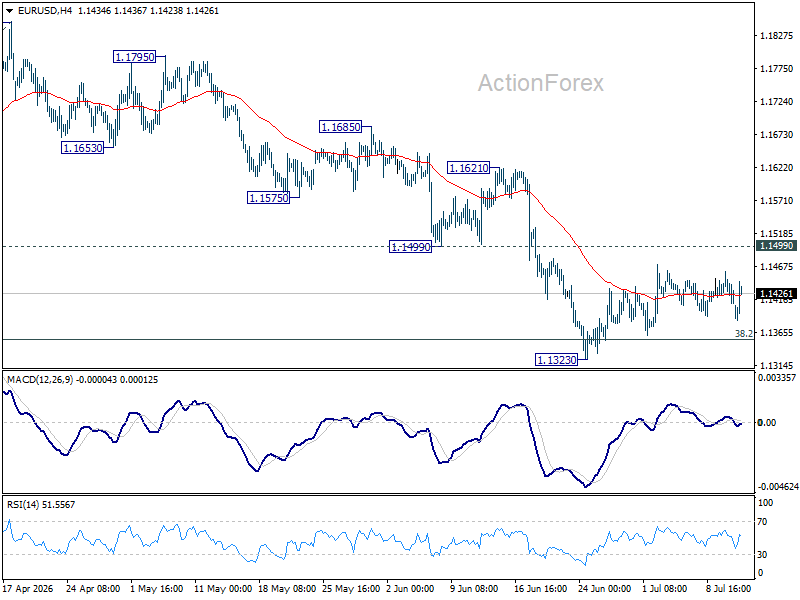
In the bigger picture, focus is back on 38.2% retracement of 1.0176 to 1.2081 at 1.1353. Decisive break there will revive the case of medium term bearish trend reversal after rejection by 1.2 key cluster resistance level. Further fall should be seen to 61.8% retracement at 1.0904. Nevertheless, strong rebound from 1.1353, followed by break of 1.1621 resistance, will retain medium term bullishness.
USD/JPY Daily Outlook
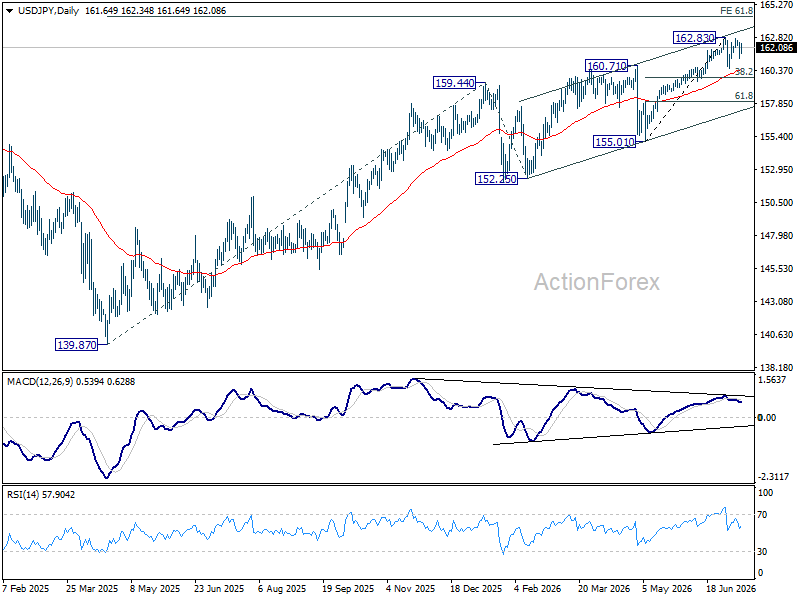
Range trading continues in USD/JPY and intraday bias stays neutral. In case of deeper pullback, downside should be contained by 38.2% retracement of 155.01 to 162.83 at 159.84. On the upside, firm break of 162.83 will resume larger up trend.
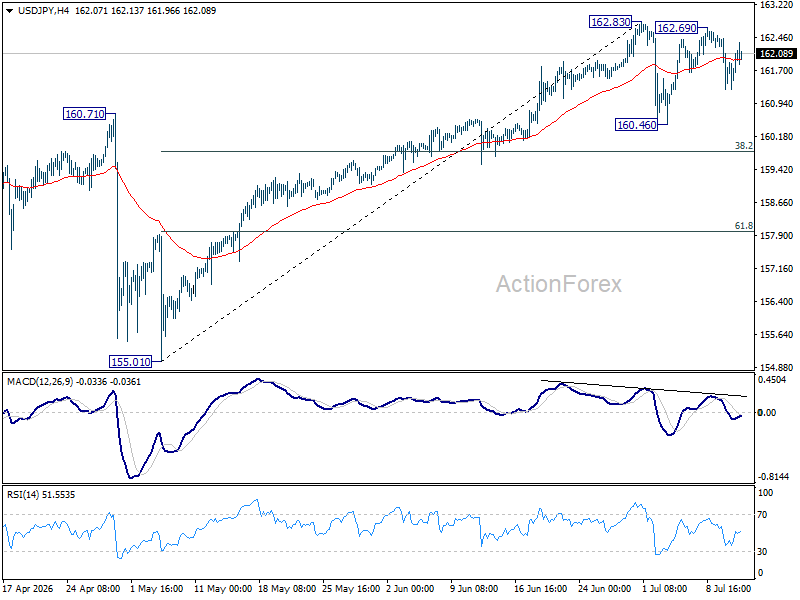
In the bigger picture, rise from 139.87 (2025 low) is seen as another rising leg of the long term up trend. Next target is 61.8% projection of 139.87 to 159.44 from 152.25 at 164.34. For now, outlook will remain bullish as long as 155.01 support holds, even in case of deep pullback.