Sample Category Title
GBP/USD Daily Outlook
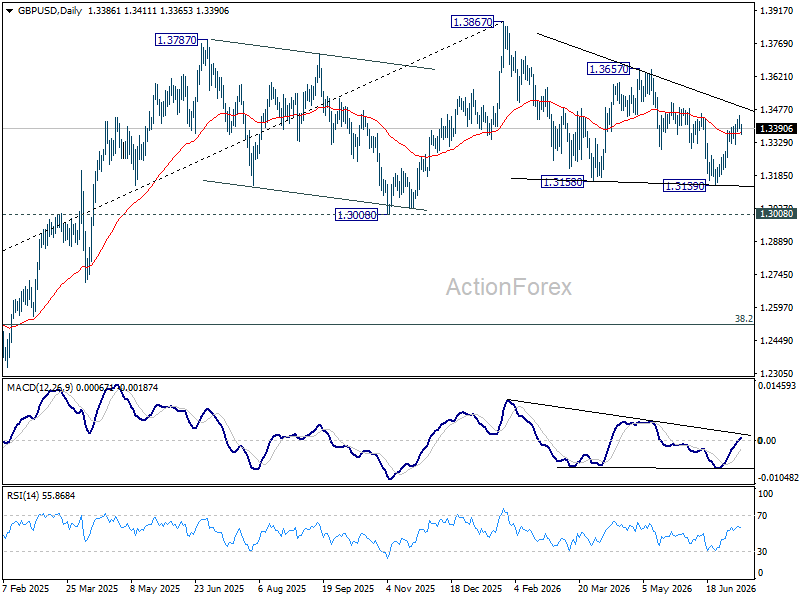
Intraday bias in GBP/USD is turned neutral with current retreat. On the upside, firm break of 1.3459 will argue that whole correction from 1.3867 has completed, and target 1.3657 resistance for confirmation. On the downside, break of 1.3451 will turn bias back to the downside for 1.3139 support instead.
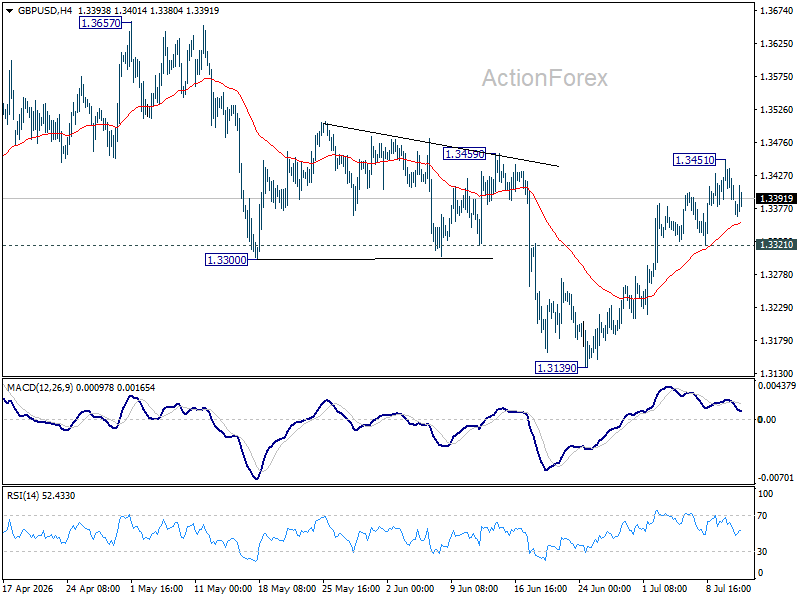
In the bigger picture, price actions from 1.3867 are a corrective pattern within the broader up trend from 1.0351 (2022 low). With 1.3008 support intact, medium term bullishness is maintained and break of 1.3867 is in favor for a later stage, towards 1.4248 key resistance (2021 high). However, firm break of 1.3008 will at least bring deeper fall to 38.2% retracement of 1.0351 to 1.3867 at 1.2524, with increased risk of bearish reversal.
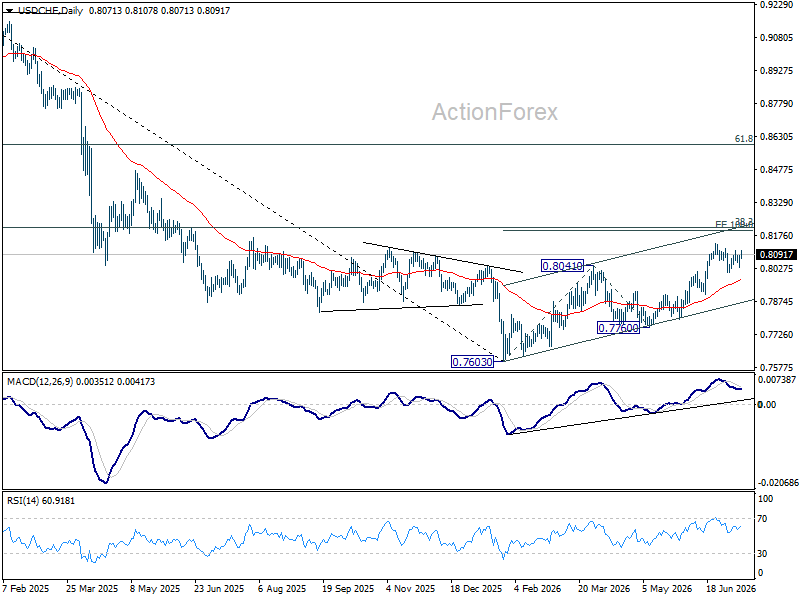
USD/CHF Daily Outlook
Range trading continues in USD/CHF and intraday bias stays neutral. With 0.8009 support intact, further rise is expected. On the upside, above 0.8139 will extend the rally from 0.7760 to 100% projection 0.7603 to 0.8041 from 0.7600 at 0.8198 next. However, sustained break of 0.8012 will bring deeper fall to 0.7909 support instead.
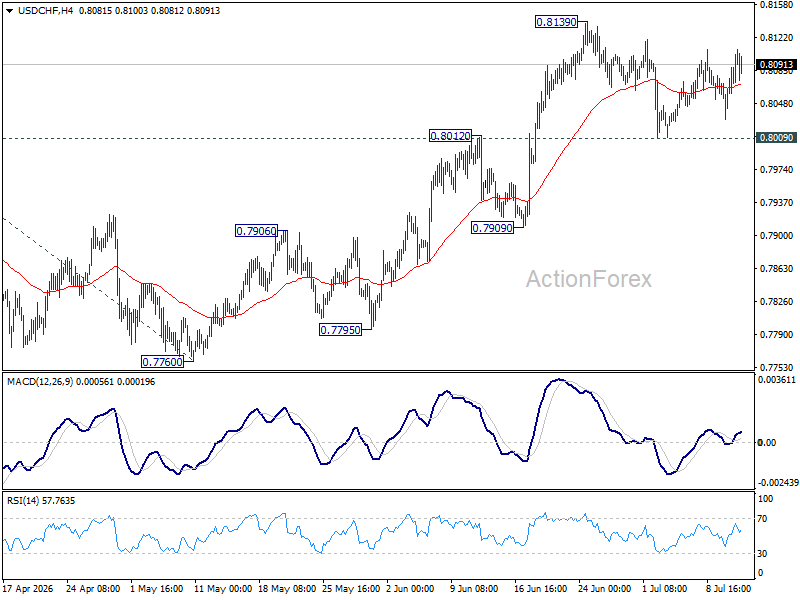
In the bigger picture, while a medium term bottom was formed at 0.7603, it's still early to call for bullish trend reversal. As long as 38.2% retracement of 0.9200 (2025 high) to 0.7603 at 0.8213 holds, the larger down trend could still continue through 0.7603 at a later stage. However, firm break of 0.7603 will argue that the trend has reversed and turn focus to 0.8332 support turned resistance (2023 low) for confirmation.
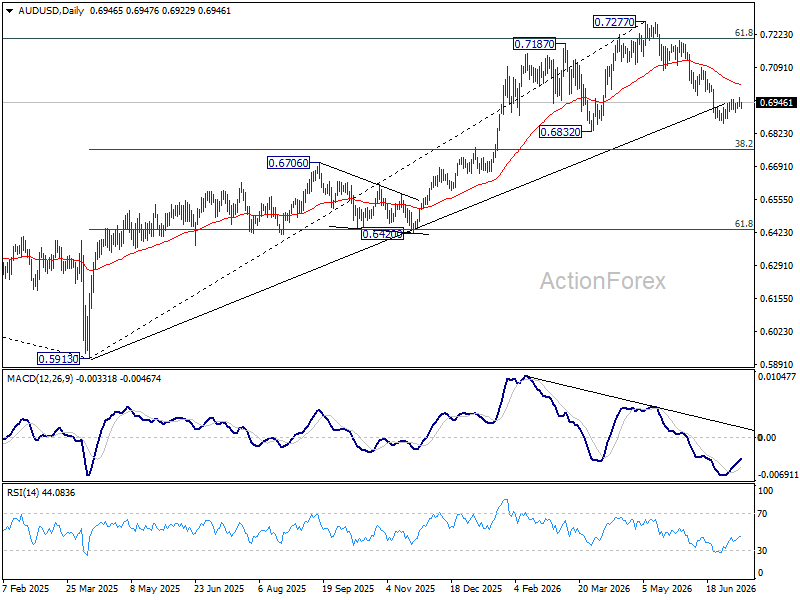
AUD/USD Daily Report
Intraday bias in AUD/USD remains neutral and more consolidations would be seen above 0.6864. Further fall is expected as long as 0.6977 support turned resistance holds. Below 0.6864 will target 0.6832 support. Firm break there will target 0.6756 fibonacci level. However, sustained break of 0.6977 will bring stronger rebound to 0.7087 resistance instead.
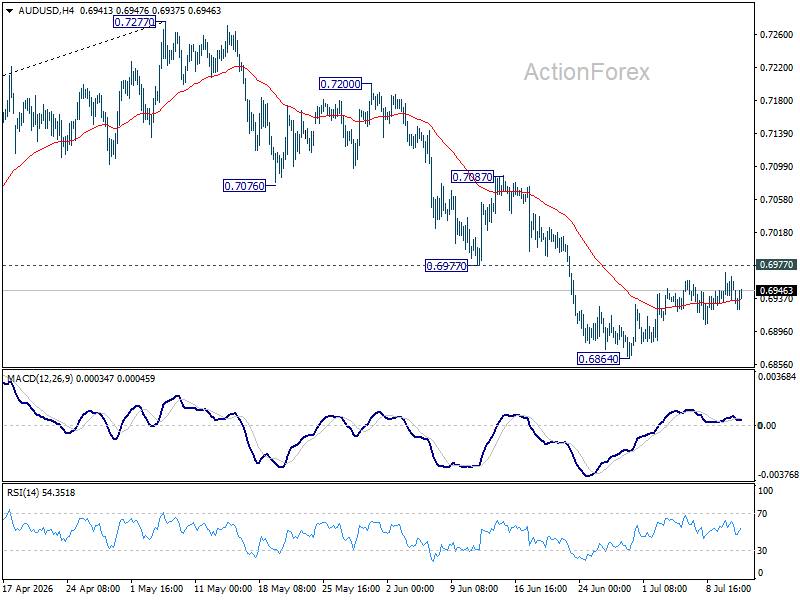
In the bigger picture, considering bearish divergence condition in D MACD, a medium term top could be formed at 0.7277 after failing to sustain above 61.8% retracement of 0.8006 (2021 high) to 0.5913 (2024 low) at 0.7206. Deeper fall could be seen to 38.2% retracement of 0.5913 to 0.7277 at 0.6756 as a correction. But strong support should be seen there to bring rebound. Consolidations would continue below 0.7277 for a while.
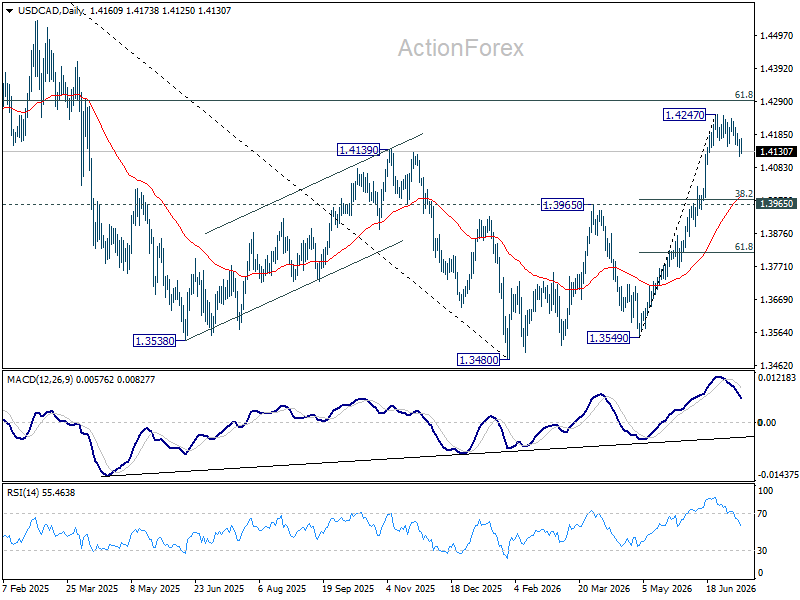
USD/CAD Daily Outlook
Intraday bias in USD/CAD remains neutral and more consolidations could be seen below 1.4247. Deeper pullback cannot be ruled out. But downside should be contained above 1.3965 resistance turned support. Above 1.4247 will resume the rally from 1.3480 to 61.8% retracement of 1.4791 to 1.3480 at 1.4290. Firm break there will pave the way back to 1.4791 high.
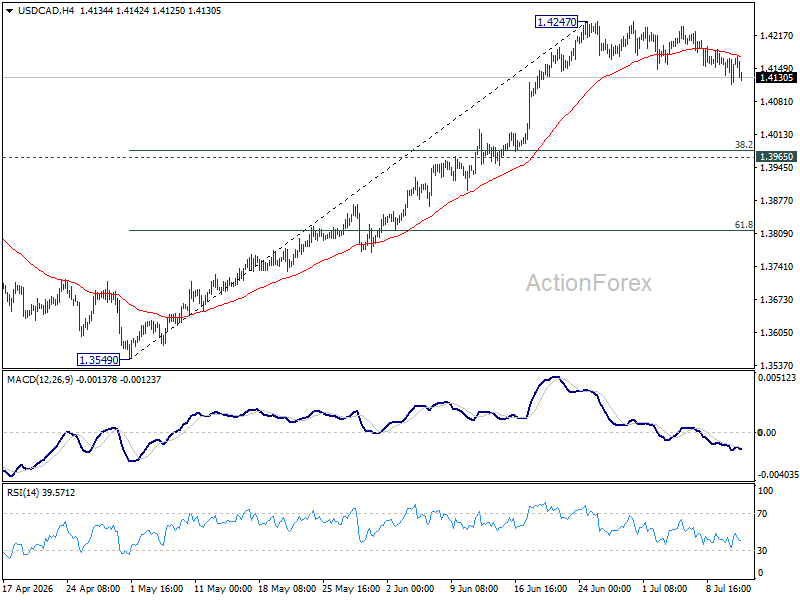
In the bigger picture, current development suggests that fall from 1.4791 has completed as a three wave correction to 1.3480. It's still early to judge if rise from there a corrective bounce, or resumption of the larger up trend from 1.2005 (2021 low). But in either case, retest of 1.4791 high should be seen next.
GBP/JPY Daily Outlook
Intraday bias in GBP/JPY remains neutral and more consolidations could be seen below 217.99 temporary top. Further rally is expected as long as 214.69 support holds. On the upside, above 217.99 will target 220.90 fibonacci projection level next.
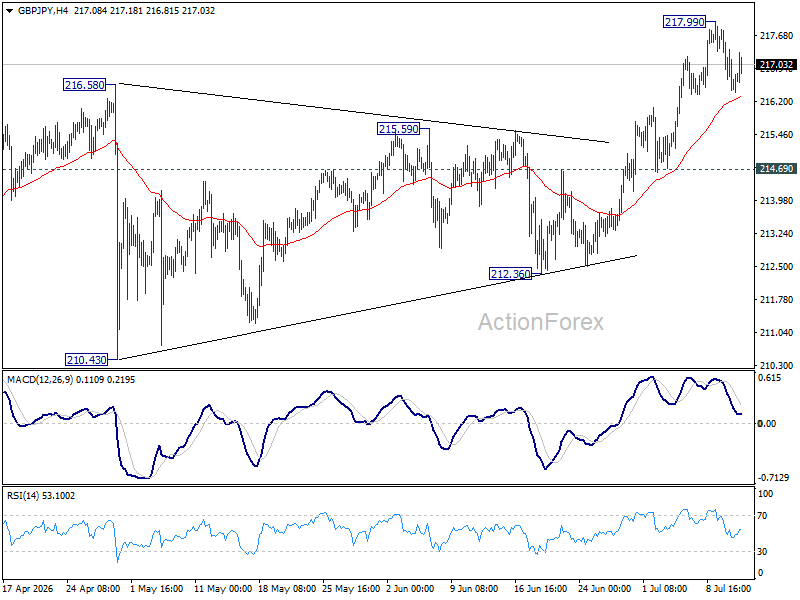
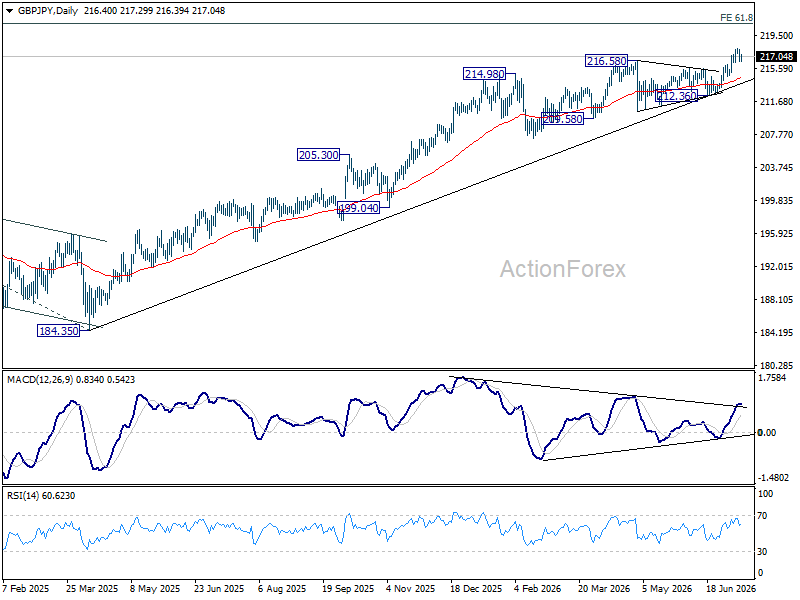
In the bigger picture, the long term up trend is in progress. Next target is 61.8% projection of 148.93 (2022 low) to 208.09 (2024 high) from 184.35 at 220.90. For now, outlook will remain bullish as long as 55 W EMA (now at 208.22) holds, in case of pullback.
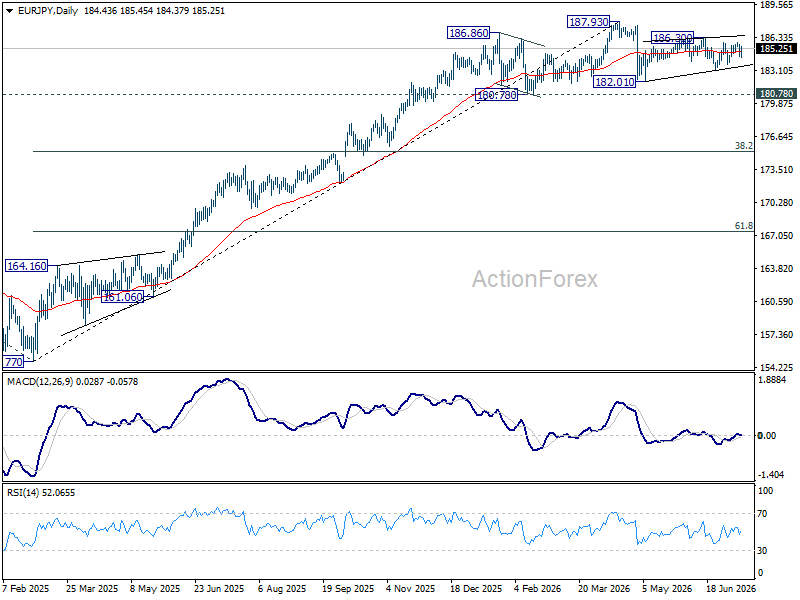
EUR/JPY Daily Outlook
EUR/JPY is staying in sideway trading and intraday bias remains neutral. On the upside, firm break of 186.30 will resume the rebound from 182.10 towards 187.93 high. On the downside, break of 183.14 will bring deeper fall to retest 182.10.
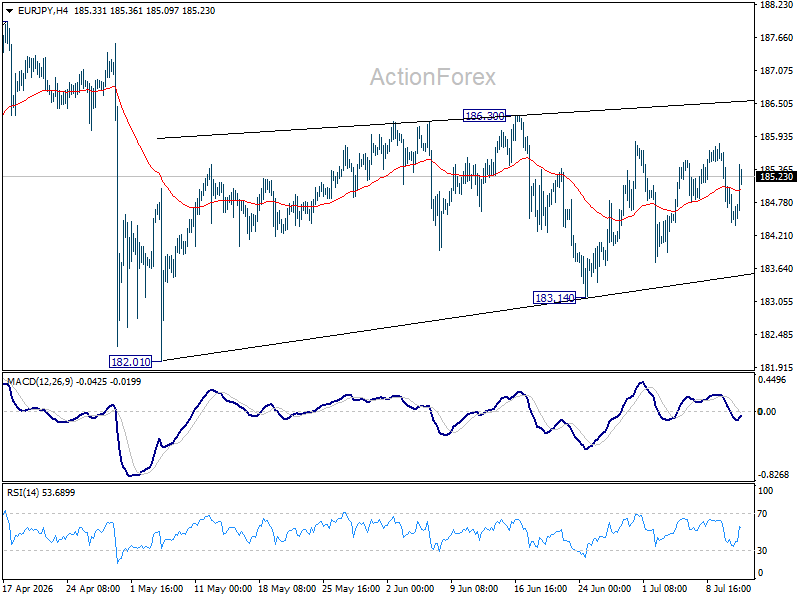
In the bigger picture, there is no sign of reversal yet. Uptrend from 114.42 (2020 low) is still expected to resume at a later stage to 78.6% projection of 124.37 (2022 low) to 175.41 (2025 high) from 154.77 at 194.88. However, sustained break of 55 W EMA (now at 179.93) will argue that it's already in a medium term down trend to 175.41 resistance turned support and below.
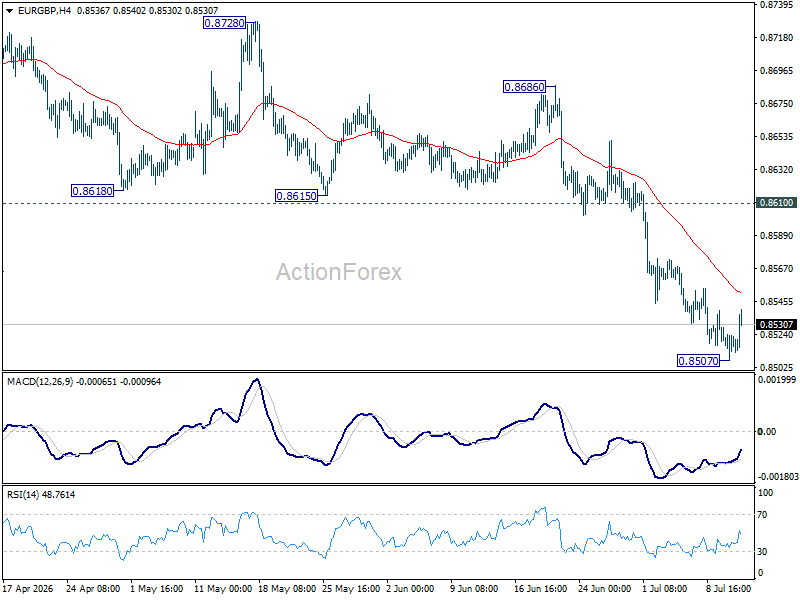
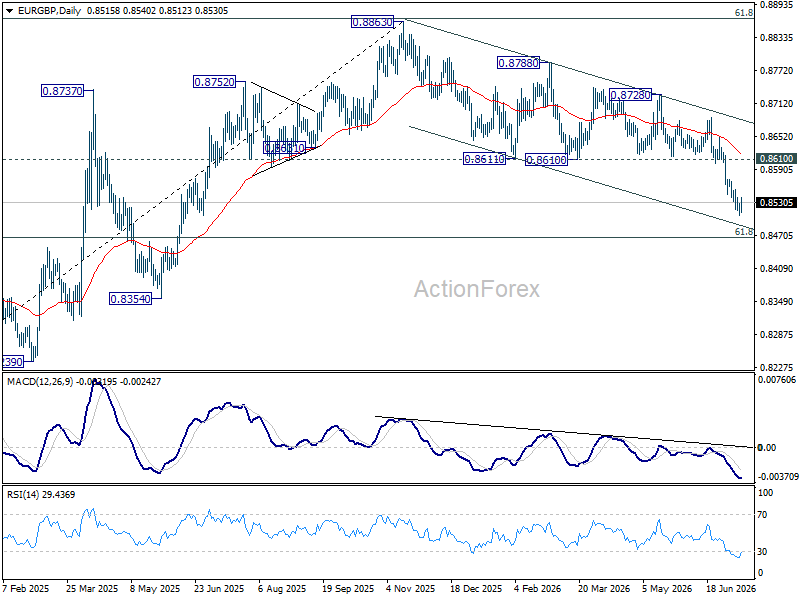
EUR/GBP Daily Outlook
Intraday bias in EUR/GBP is turned neutral with current recovery, and some consolidations could be seen above 0.8507. Upside should be limited below 0.8610 support turned resistance to bring another fall. Below 0.8507 will resume larger down trend to 61.8% retracement of 0.8221 to 0.8863 at 0.8466.
In the bigger picture, current development suggests that rise from 0.8221 (2024 low) has completed at 0.8863, just ahead of 38.2% retracement of 0.8221 (2024 low) to 0.8863 (2025 high) at 0.8618. Deeper fall would be seen back to 0.8201 (2022 low). For now, outlook will be neutral at best as long as 0.8863 hold.
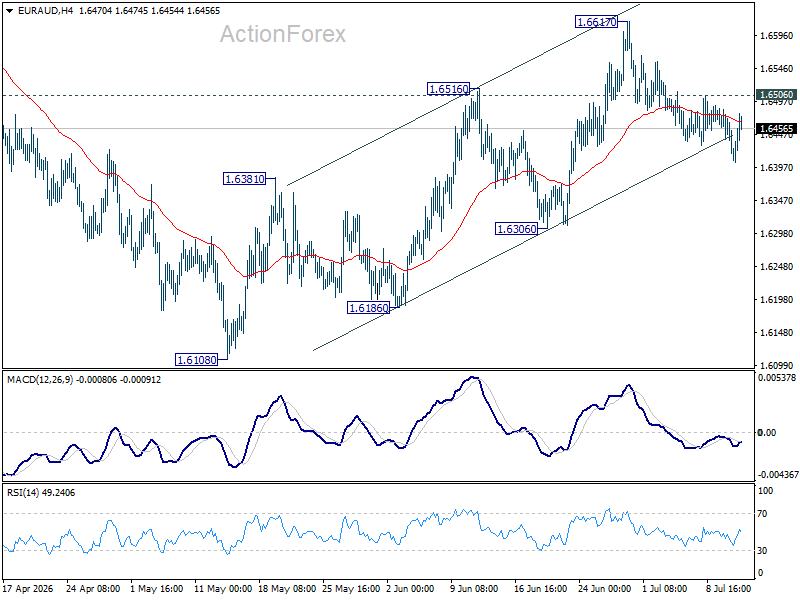
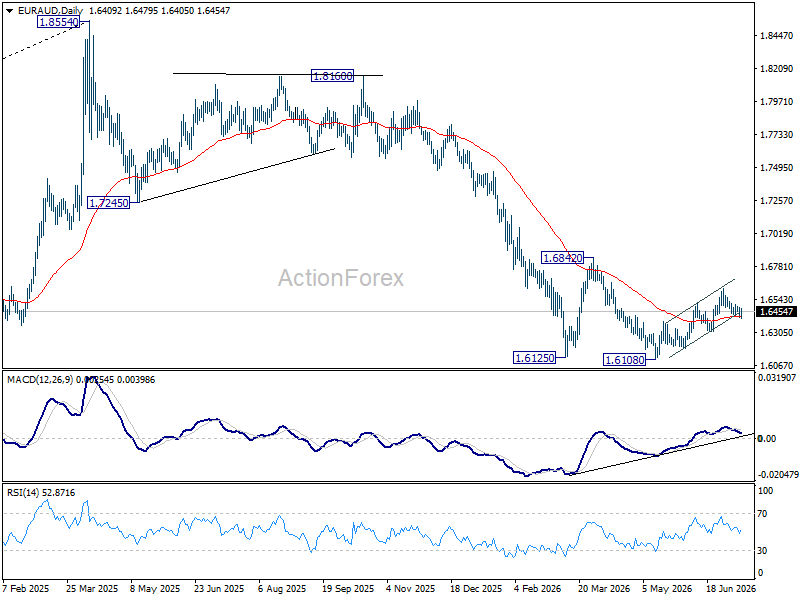
EUR/AUD Daily Outlook
Intraday bias in EUR/AUD remains neutral and outlook is unchanged. Consolidations could continue below 1.6617, but outlook will stay bullish as long as 1.6306 support holds. On the upside, above 1.6506 minor resistance will bring retest of 1.6617. Firm break there will resume the rebound from 1.6108. However, decisive break 1.6306 support will argue that the rebound has completed, and bring retest of 1.6108.
In the bigger picture, outlook will stay bearish as long as 1.6842 resistance holds. Fall from 1.8554 (2025 high) is expected to continue to 61.8% retracement of 1.4281 to 1.8554 at 1.5913. Decisive break there will pave the way back to 1.4281 (2022 low). However, firm break of 1.6842 should confirm medium term bottoming, and bring stronger rally.
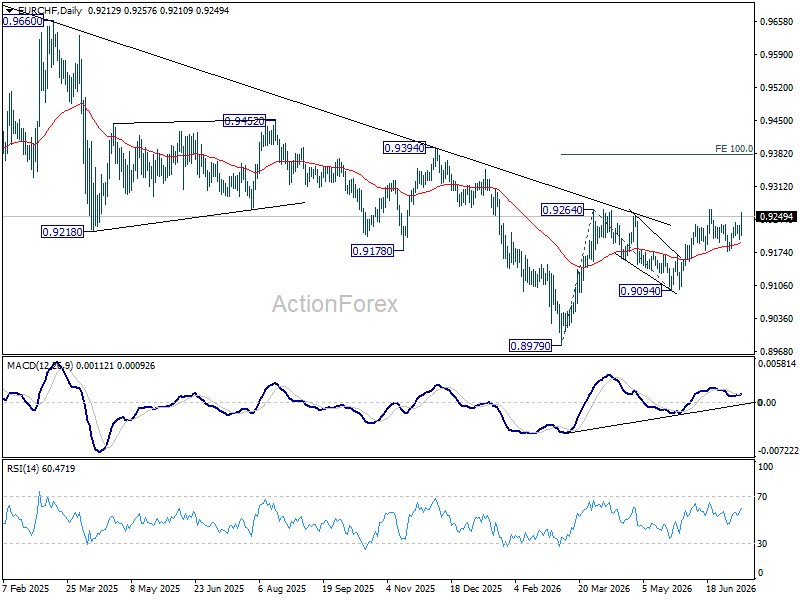
EUR/CHF Daily Outlook
EUR/CHF's strong break of 0.9234 resistance confirms that pullback from 0.9265 has completed at 0.9176. Intraday bias is back on the upside. Firm break of 0.9265 will resume whole rally from 0.8979. Next target is 100% projection of 0.8979 to 0.9264 from 0.9094 at 0.9379. Outlook will remain bullish as long as 0.9176 support holds, in case of retreat.
In the bigger picture, the break of medium term falling trend line resistance indicates that 0.8979 is already a medium term bottom. Considering bullish convergence condition in W MACD, rise from there should at least be reversing the fall from 0.9928, with prospect of developing into a medium term up trend. Firm break of 0.9394 resistance will add more credence to this case. For now risk will remain on the upside as long as 0.9094 support holds, in case of retreat.
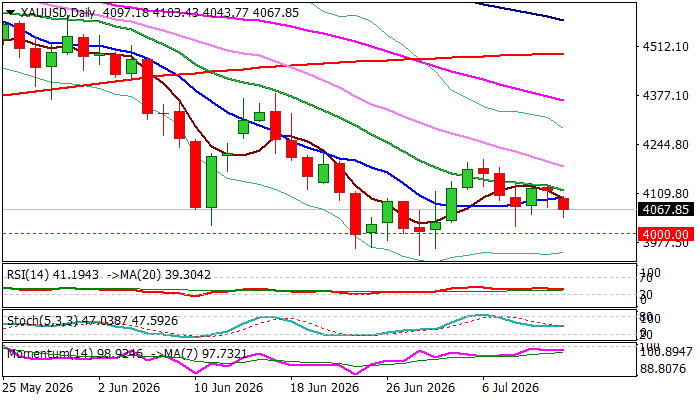
Gold – Key $4K Support Zone at Risk Again on Worsening Geopolitical Situation
Gold edged lower after opening with $20 gap lower on Monday, following the latest escalation in the Middle East that fueled inflationary risk and added to expectations that the Fed will keep higher interest rates or possibly opt for rate hikes, providing support to US dollar.
Markets also focus on this week’s key economic data – release of US June inflation report and Fed Chair Warsh’s semiannual testimony on economy, inflation and monetary policy that will add fresh details on overall outlook.
Technical studies on daily chart remain in mainly bearish configuration, following several death-crosses formed during June (20; 30; 55 / 200DMAs), 14-d momentum holding in negative zone and RSI below 50).
Fresh weakness after recent recovery stall, shifts near-term focus to the downside, with initial requirement on weekly close below Fibo support at $4076 (where bears were rejected four times) guarding key supports at $4000/$3950 (psychological / recent spikes below $4K), with firm break here (after a multiple failure) to generate bearish continuation signal of larger downtrend from new historical high.
At the upside, falling 20DMA marks first significant resistance ($4118), ahead of pivotal barrier at $4203 (July 6 recovery peak).
Res: 4118; 4183; 4203; 4288
Sup: 4021; 4000; 3942; 3886