Sample Category Title
USD/CAD: One Trendline Away from Deciding the Next Move
After several strongly positive weeks, USD/CAD has stalled over the past few sessions, entering a phase of uncertainty.
On the dollar side, Fed Chair Kevin Warsh has struck a firm tone, reaffirming the 2% inflation target and pushing back against political pressure to cut rates, while sticky PCE inflation near 4% keeps hike odds alive for September. Yet June payrolls came in softer and speculative USD positioning looks stretched, raising doubts on how much further the rally can extend. Markets will also watch upcoming US CPI and PPI releases closely, as either gauge could reinforce the Fed hike case or, if softer, cap dollar strength.
The loonie's story is similarly mixed. Canada's June jobs report beat expectations, reducing the odds of a BoC cut, yet the currency remains capped by falling oil prices, subdued inflation, and unresolved CUSMA trade uncertainty. Two currencies face both genuine support and headwinds, leaving USD/CAD hostage to this week's BoC decision and incoming US data—a backdrop that aligns well with what the chart itself is showing.
USD/CAD Technical analysis
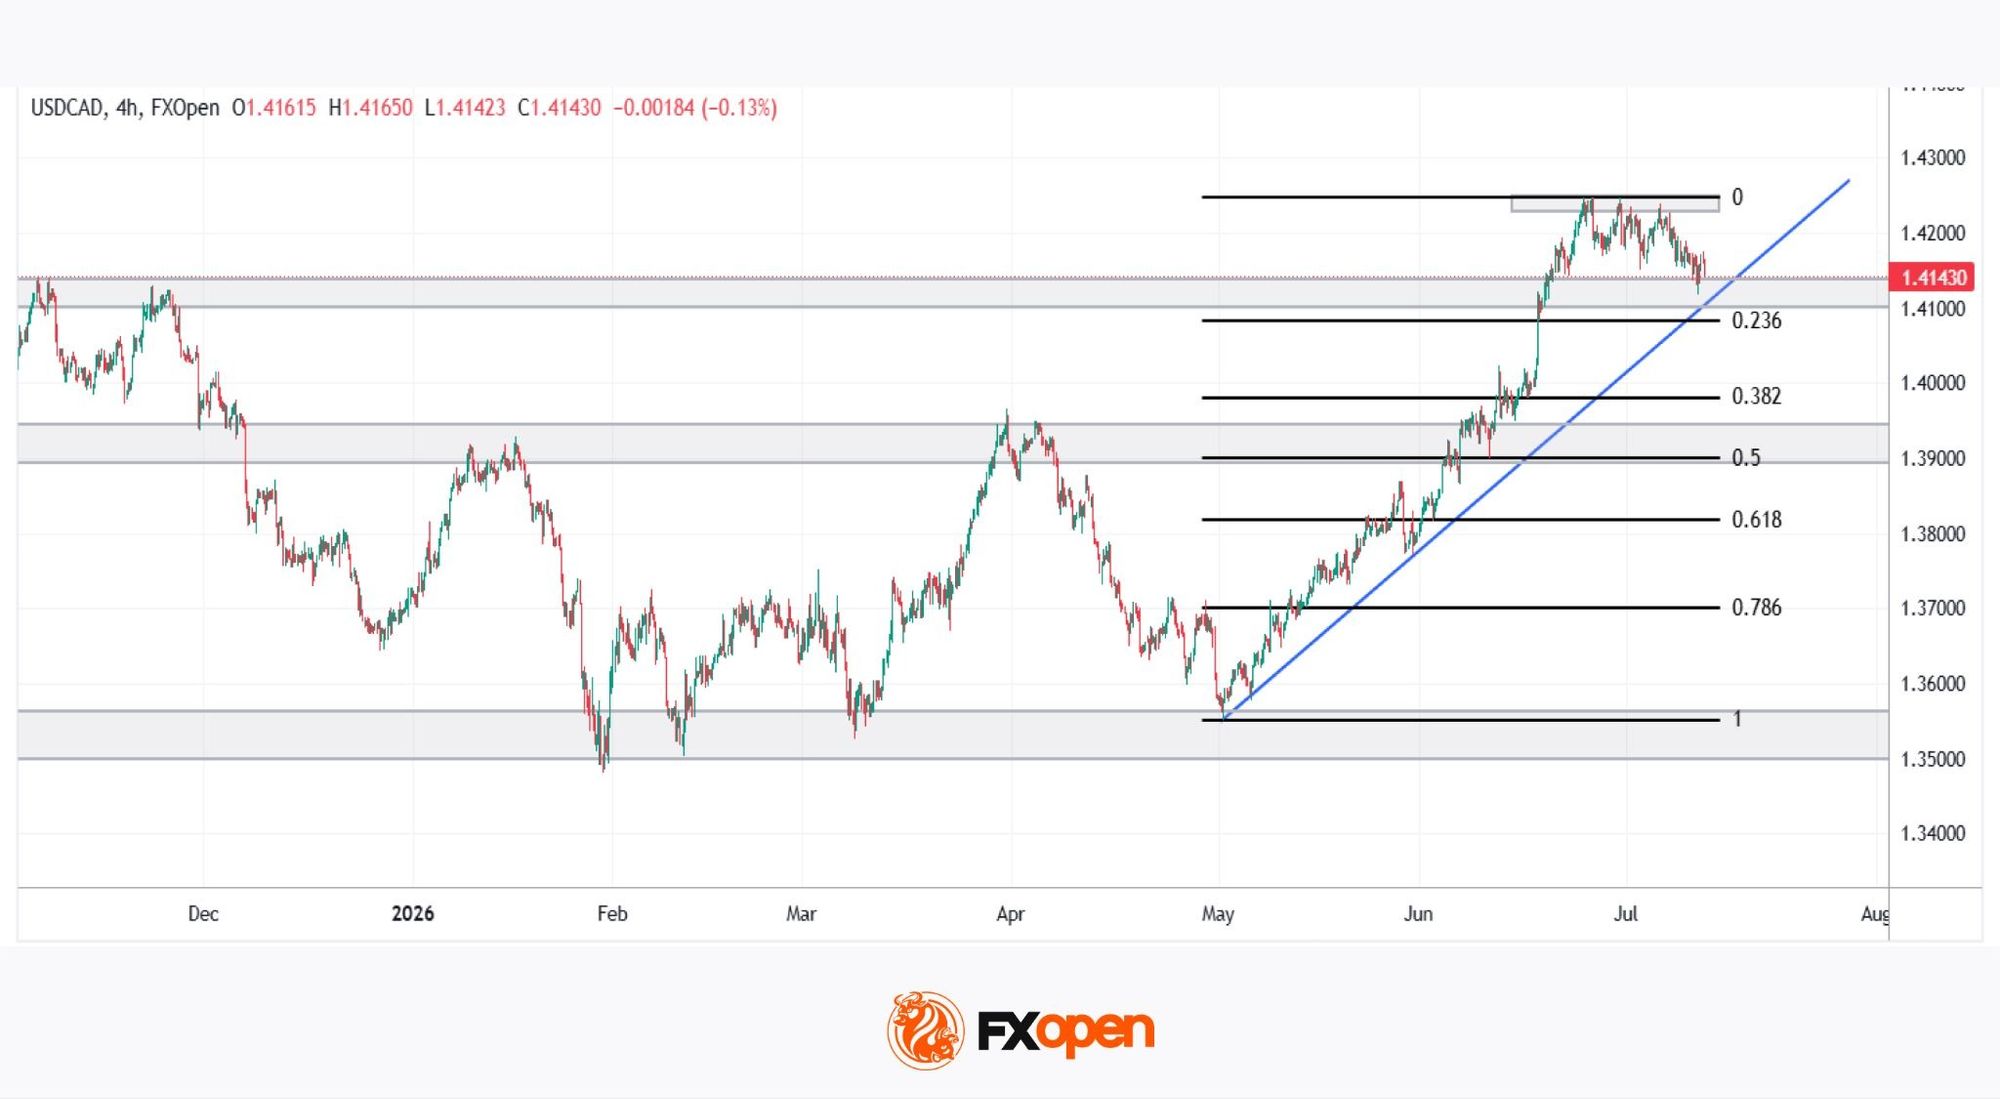
As the 4H chart shows, USD/CAD has traded within a well-defined ascending channel since May's lows, and is now consolidating just below recent swing highs. The Fibonacci retracement drawn from that low to the July high offers a useful reference for the levels ahead.
Bullish Scenario
As long as price holds above the ascending trendline and defends the former resistance, now turned support, in the 1.4100 area, the broader uptrend structure remains firmly intact, and this pause looks far more like healthy consolidation than an early reversal signal. A confirmed bounce off the trendline, followed by a decisive push back above the recent swing high near the 1.4250 area, would validate continued bullish control and open the way for USD/CAD to extend its rally into fresh highs for the move, keeping the dollar's medium-term strength against the loonie firmly in place.
Bearish Scenario
A clean, sustained break below the ascending trendline would mark the first real technical warning sign, shifting near-term momentum decisively lower. In that case, the 0.382 and 0.5 Fibonacci retracement levels would become the first meaningful support tests, coinciding with the psychological 1.3900-1.4000 range. Losing these levels could expose a deeper slide towards the 0.618 retracement—an area that would confirm a genuine correction of the entire May-to-July rally rather than a simple pullback, and would put the pair's medium-term bullish structure into serious question.
With price sitting right on the ascending trendline, the coming sessions could prove decisive in determining where USD/CAD heads next.
Trade over 50 forex markets 24 hours a day with FXOpen. Take advantage of low commissions, deep liquidity, and spreads from 0.0 pips (additional fees may apply). Open your FXOpen account now or learn more about trading forex with FXOpen.
This article represents the opinion of the Companies operating under the FXOpen brand only. It is not to be construed as an offer, solicitation, or recommendation with respect to products and services provided by the Companies operating under the FXOpen brand, nor is it to be considered financial advice.
The Crypto Market Is Struggling to Break Out, but Sentiment Is Improving
Market Overview
On Monday morning, the crypto market capitalisation retreated to $2.16T from the $2.20T region, where we also saw increased selling pressure in the middle of last month. In the short term, market capitalisation remains below the 50-day moving average, showing no signs of a shift to a bullish trend.
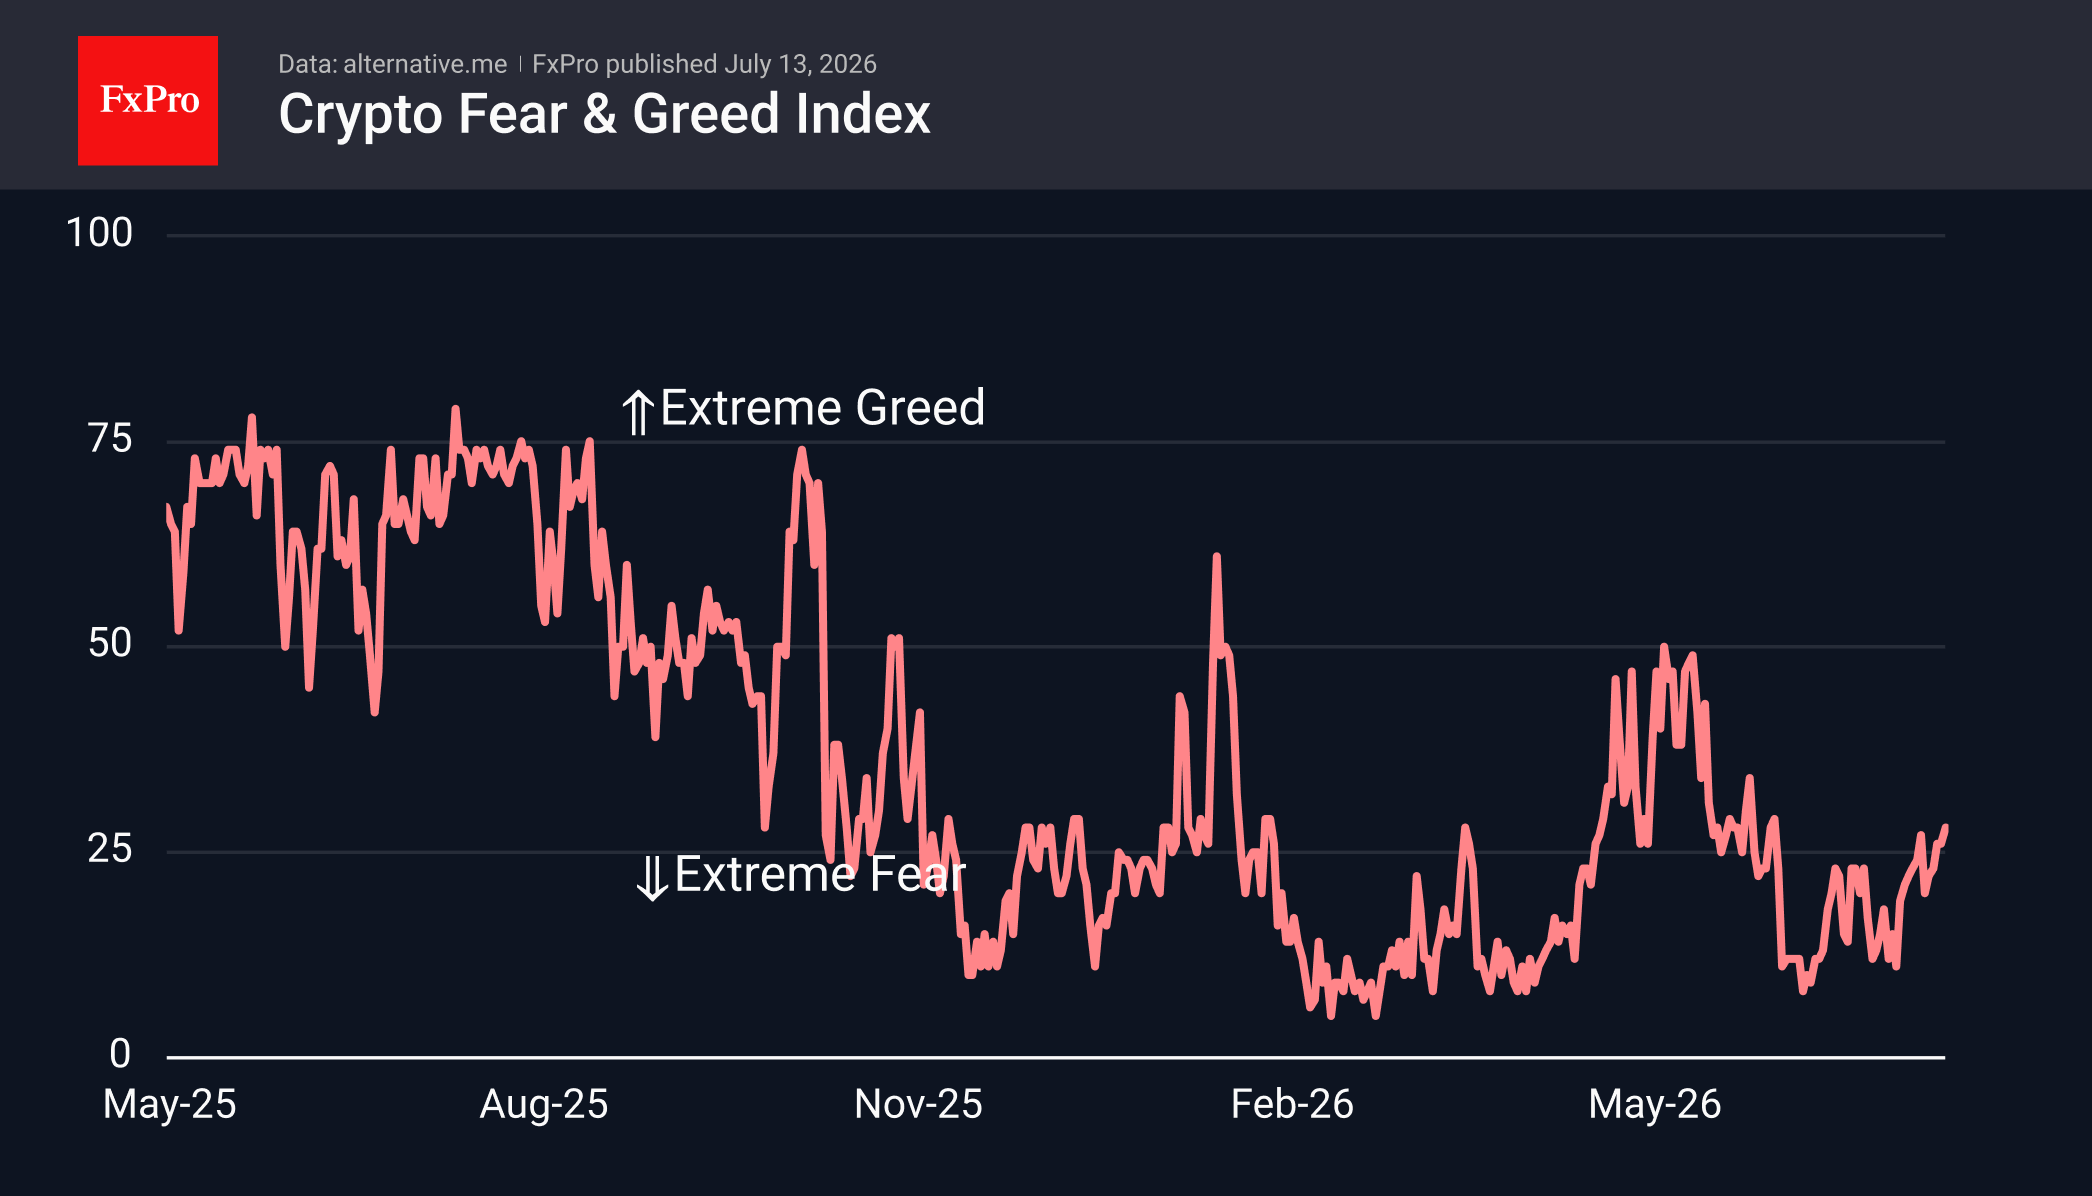
The sentiment index has risen to 28, as without fresh downward price momentum, the indicator tends to move towards neutral territory. Current readings are the highest since early June, but, as in May, we urge caution against concluding that a bull market has returned until sentiment consolidates above the 50 level – something that has not been achieved since last September.
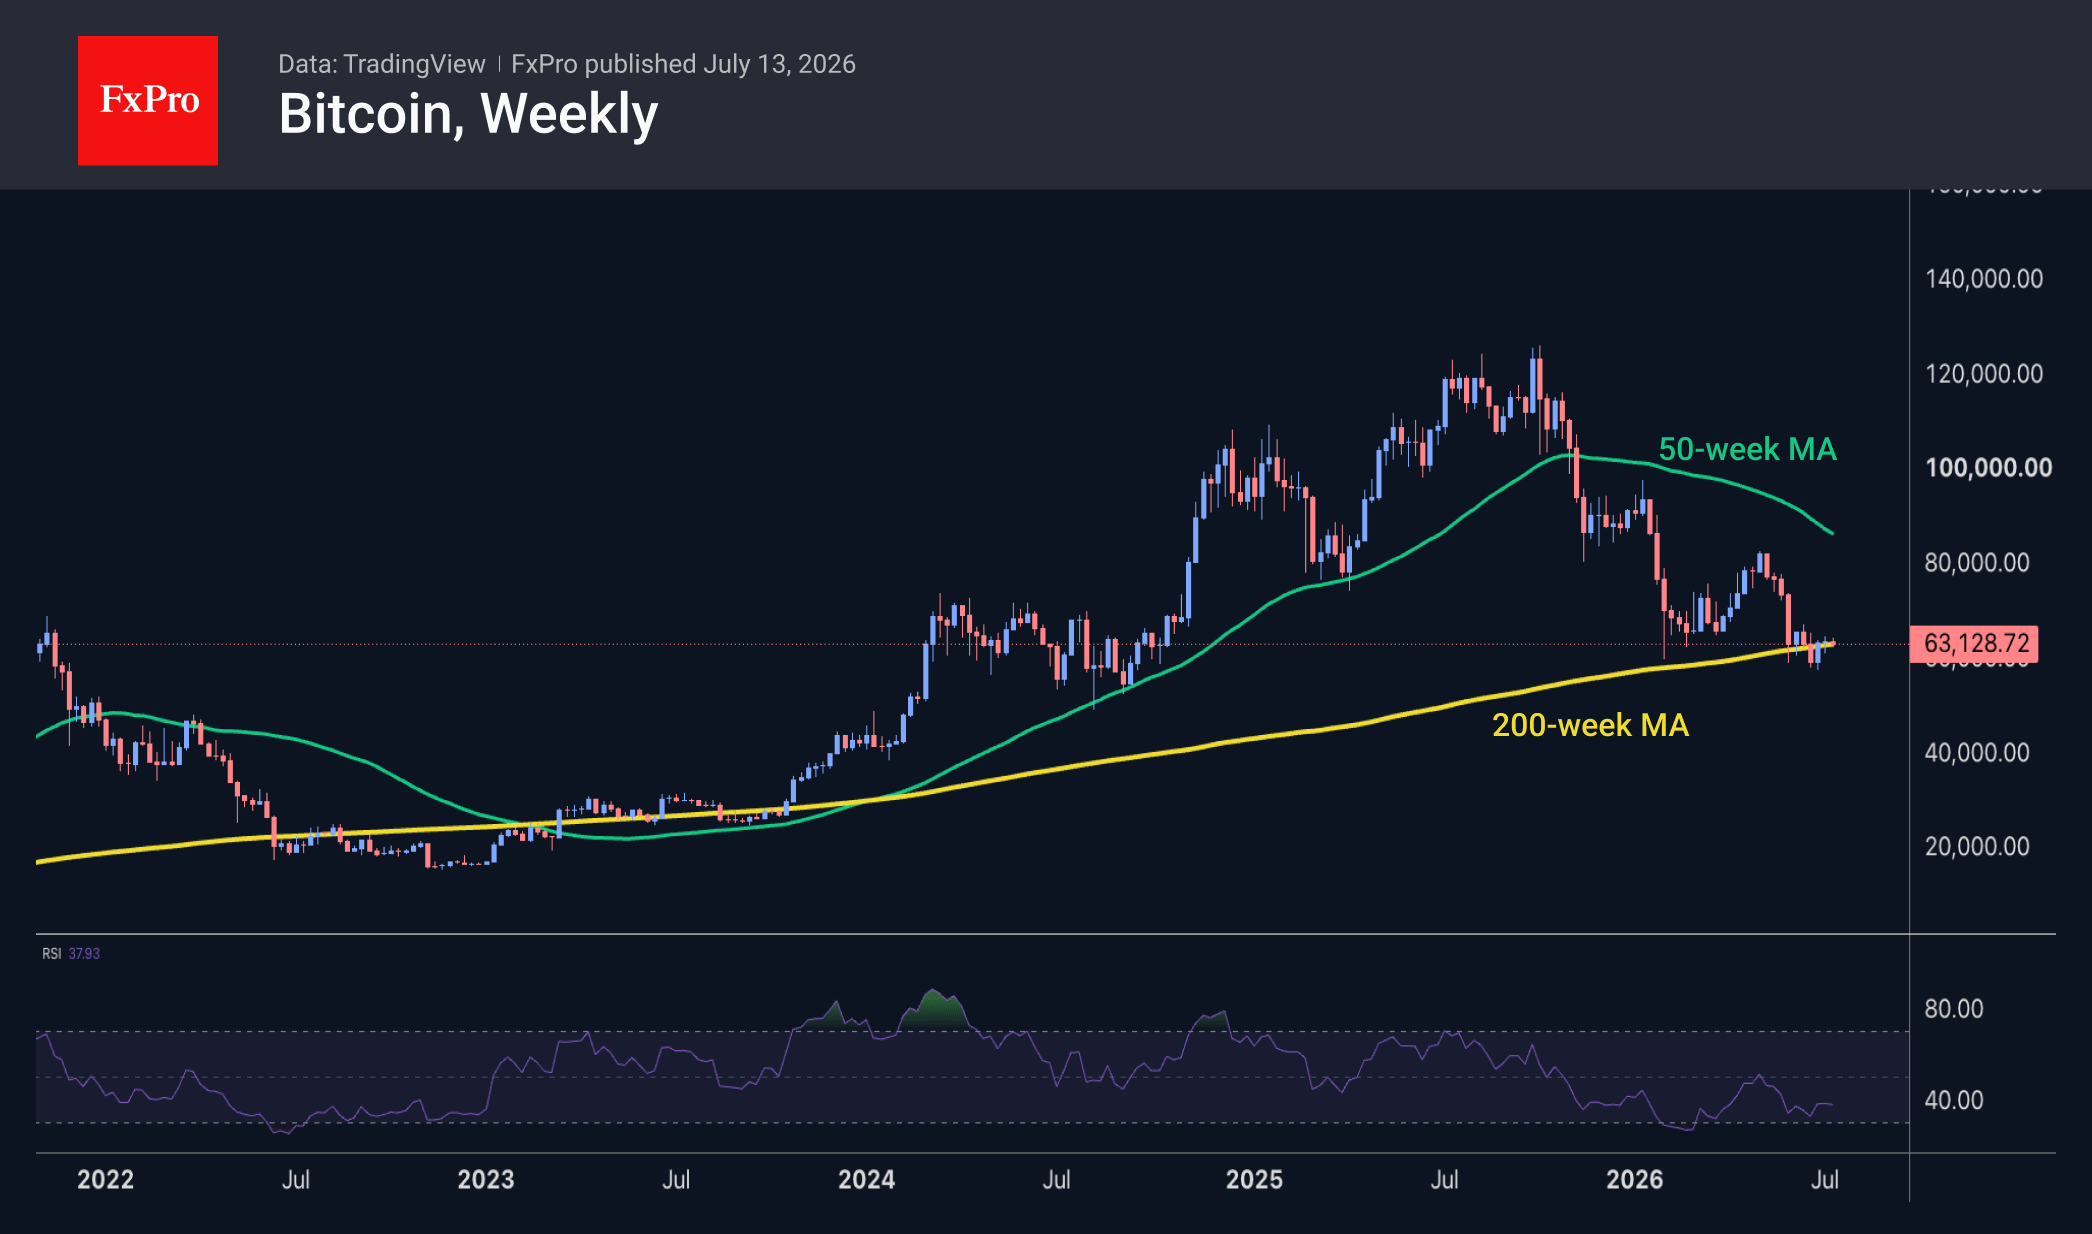
Bitcoin technically closed the week at its 200-week moving average, but is starting Monday with a fresh dip towards it, indicating that bullish potential is limited. At the same time, a divergence between price and the RSI is gradually forming on weekly timeframes. This is a positive signal for the medium term, but it is more a signal to stop being bearish rather than a bullish signal of a market reversal. Historically, a touch of the 200-week moving average has served as a decent signal that the main part of Bitcoin’s correction is coming to an end and has been a good point for gradually building up long-term positions. However, it is important to understand that this narrative could change quickly and does not promise a rapid rebound.
News Background
Inflows into US spot Bitcoin ETFs have resumed after eight weeks of outflows, during which investors withdrew nearly $8.5 billion from the funds. According to SoSoValue, net inflows into spot BTC ETFs amounted to $197.4 million for the week. Inflows into ETH ETFs totalled $84.4 million for the week.
JPMorgan believes that the real structural threat to Bitcoin lies in the shift by banks and major investment funds towards private blockchain platforms, which could deal a blow to public blockchains.
Demand for Bitcoin is recovering rapidly, though the growth is currently being driven mainly by retail traders in the speculative futures market, CryptoQuant notes. At the same time, the situation in the spot market remains less positive.
Bitcoin has approached a key long-term support level, according to the Power Law model that Fidelity has been tracking since 2015. However, without a return of liquidity, BTC could remain in a sideways trend for months to come.
As a result of the latest adjustment, the mining difficulty of the first cryptocurrency has fallen by 5 per cent to 127.17 T. According to Glassnode, the smoothed seven-day moving average hash rate stands at 864.4 EH/s.
The FxPro Analyst Team
EUR/USD: US Inflation Will Determine Everything
EUR/USD opens the week around 1.1433. Investors continue to assess the situation in the Middle East, where uncertainty remains high. Oil prices corrected lower following a sharp rise at the start of the week, after reports that the United States and Iran intend to continue peace negotiations.
At the same time, fresh mutual strikes between the parties have heightened fears that the conflict could once again enter an escalation phase, leaving the prospects for maintaining the ceasefire uncertain.
Renewed hostilities have brought fears of a new inflation wave back to the market, supporting expectations of further Federal Reserve monetary tightening. Markets currently estimate the probability of a rate hike in September at approximately 62%, up from 58% a week earlier, though this figure exceeded 70% mid-week.
Additional attention has been drawn to comments from New York Federal Reserve President John Williams, who noted that one of the key drivers of inflationary pressure in the United States remains demand growth, linked to developments in artificial intelligence technology.
The main event of the week will be the release of the US June consumer price index (CPI). Higher-than-expected figures would reinforce expectations that the Fed will maintain a tight policy stance, potentially supporting the dollar. Conversely, weaker-than-forecast CPI data would increase pressure on the US currency, as markets would begin to price in a softer monetary policy trajectory once again
Technical Analysis
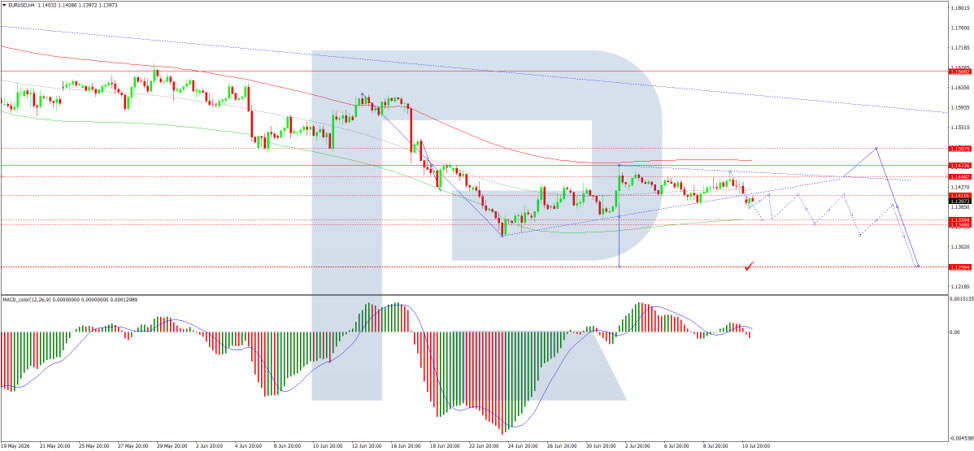
On the H4 chart of EUR/USD, the market has formed a consolidation range around the 1.1410 level, currently extending down to 1.1388 and up to 1.1410. A consolidation range around this level is practically complete. An upside breakout would suggest a corrective wave developing to 1.1450, followed by a decline to 1.1260. A direct downside breakout would open potential for a downward wave to 1.1260. Technically, this scenario is confirmed by the MACD indicator-its signal line is above zero but pointing strictly downwards, reflecting continued bearish momentum with the potential for the trend to continue lower.
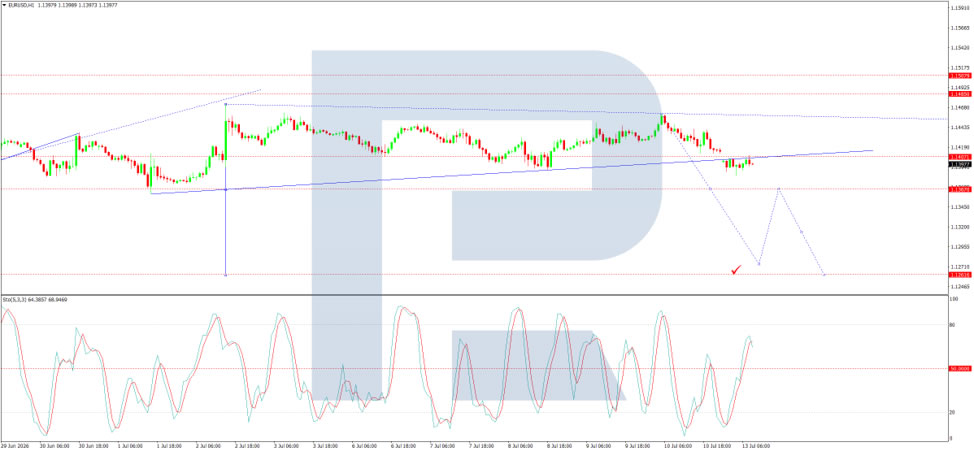
On the H1 chart, the market has completed the next growth wave to the 1.1412 level. A consolidation range is currently forming below this level. Today, a range expansion down to 1.1366 and up to 1.1400 is expected, followed by a decline to 1.1260. Technically, this scenario is confirmed by the Stochastic oscillator-its signal line is above 50 and pointing strictly up to 80, before a subsequent decline to 20.
Conclusion
EUR/USD is treading water at the start of the week as markets await key US inflation data that could set the tone for the Federal Reserve's policy path. Geopolitical uncertainty in the Middle East remains elevated, with conflicting signals-renewed peace talks on one hand and fresh military strikes on the other-keeping investors cautious. Inflation expectations have been reinforced by escalating tensions, pushing September rate hike probabilities higher despite a mid-week dip. Comments from NY Fed's Williams on AI-driven demand as an inflation factor have added another dimension to the debate. All eyes are now on Wednesday's CPI release: a stronger print could boost the dollar, while a weaker outcome would ease pressure on the euro. Technically, the bearish outlook for EUR/USD remains intact, with downside potential towards 1.1260 in the medium term.
Markets Ran Ahead of Tokyo: Yen Weakens as GPIF Expectations Meet Reality
Markets Ran Ahead of Tokyo: Yen Weakens as GPIF Expectations Meet Reality
Markets spent Friday pricing in a structural shift. Monday was about recognizing that the shift, if it comes, will probably take much longer than first imagined. That change in expectations left the Yen weaker across the board after reports indicated Japan has no immediate plans to revise the Government Pension Investment Fund's benchmark asset allocation, despite the government's ambition to steer more institutional money toward domestic assets.
Finance Minister Satsuki Katayama's remarks last week about encouraging "substantially greater investments in Japanese financial assets" had sparked speculation that GPIF could soon redirect a significant portion of its enormous portfolio back into Japan. Investors quickly extrapolated that into stronger structural demand for Japanese assets, lifting both the Yen and government bonds. Officials have now clarified that any increase in domestic investment is expected to come within GPIF's existing allocation bands rather than through an immediate overhaul of its medium-term investment framework. Chief Cabinet Secretary Minoru Kihara also reiterated today that the fund reviews its benchmark portfolio annually and only makes changes when market conditions justify them.
The broader policy direction therefore remains intact, but the timetable has changed. Rather than abandoning the idea of encouraging greater domestic investment, policymakers appear intent on pursuing it gradually. The market simply moved faster than the government expected. Monday's Yen weakness reflects investors scaling back expectations of an imminent capital-flow shift, not abandoning the longer-term narrative that Japan wants more of its institutional savings invested at home.
At the same time, New Zealand Dollar received fresh support from improving domestic fundamentals. New Zealand's services sector returned to expansion in June as the BusinessNZ Performance of Services Index climbed from 48.0 to 50.6, joining the recent rebound in manufacturing. According to BNZ's Stephen Toplis, the combined surveys point to economic growth recovering toward 2.0%, suggesting the economy is returning to its pre-oil shock trend.
Those two stories have naturally converged in NZD/JPY. The cross is benefiting not only because the Yen has surrendered part of Friday's gains, but also because New Zealand's domestic outlook continues to improve. That combination creates a more convincing fundamental backdrop for the latest rally than one driven purely by shifts in risk sentiment or broad US Dollar moves.
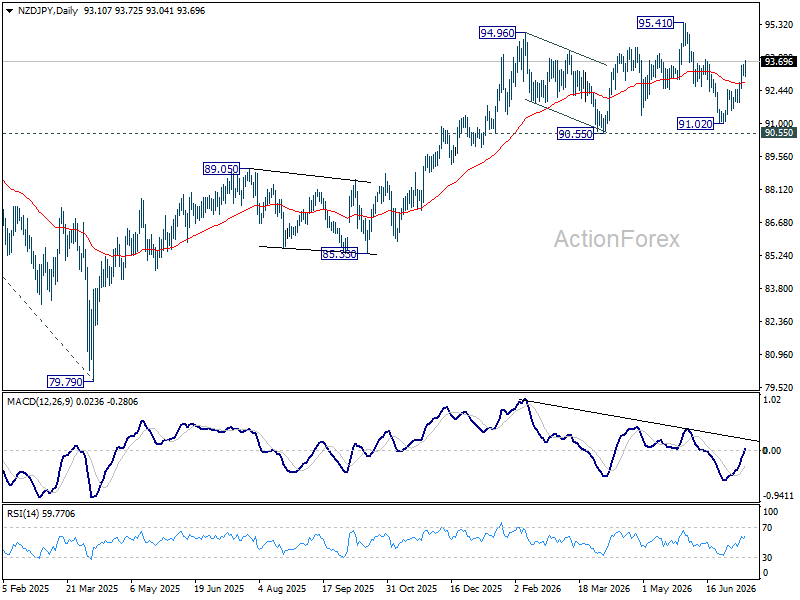
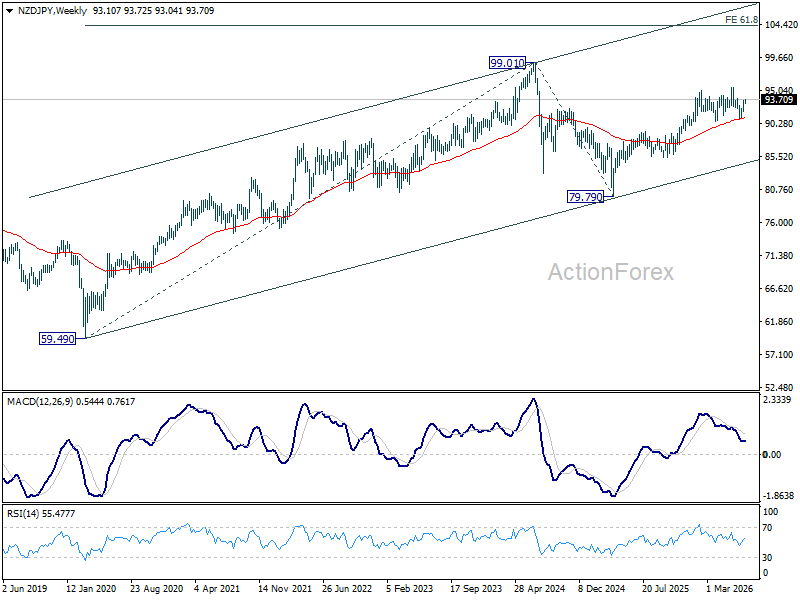
Technically, the extended rebound from 91.02 suggests the pullback from 95.41 has already completed after NZD/JPY successfully defended both key structural support at 90.55 and the 55 W EMA (now at 91.07). The broader uptrend from the 2025 low at 79.79 therefore remains intact.
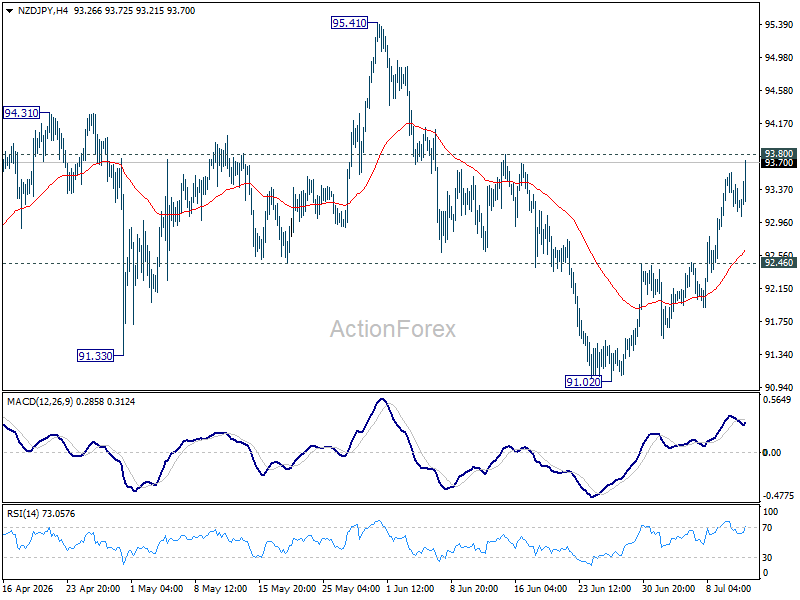
Immediate attention is on 93.80 resistance. A firm break would bring a retest of 95.41, while a decisive move above that high would resume the medium-term advance toward the 2024 peak at 99.01. On the downside, a break back below 92.46, now acting as initial support, would delay the bullish outlook and signal a prolonged period of near-term consolidation instead.
Sunrise Market Commentary
Markets
Renewed US missile strikes against Iran prompted retaliatory action across the Middle East over the weekend with conflicting messaging over whether Hormuz is open or not. Since strikes were launched back-and-forth early this week, pressure on the fragile cease-fire (what's in the name?) agreed under the MoU keeps building. Brent crude prices this morning jump north of $79/b compared with last week's close just above $75/b. The Dutch TTF gas future trades above €50/MWh. A move beyond €53.55 would bring us to highest levels since March. The US dollar opened stronger, but the greenback fails to really gain momentum in this morning's Asian session (EUR/USD 1.14; USD/JPY 162). Asian stock markets cede ground with European and US equity futures also pointing to a softer start. Core bond futures are lower with recent developments both impacting thoughts on central bank reaction functions and inflation expectations. Today's empty eco calendar implies that the Iranian headline roulette is back in play to drive intraday moves. Erring on the side of caution (higher oil, weaker bonds/stocks and stronger USD) seems to be the way to go. Only after European close, speeches by ECB Schnabel, Fed Waller and BoE chief economist Pill offer some distraction.
Tomorrow, things get more interesting with the release of June CPI inflation numbers and Fed Chair Warsh's inaugural semiannual testimony before US Congress. Consensus expects headline inflation to be 0.1% lower M/M thanks to gas prices, which would pull headline CPI from 4.2% Y/Y to 3.8% Y/Y. Core CPI is forecast at 0.2% M/M and 2.9% Y/Y (unchanged). Especially a slightly stronger (monthly) core CPI pace would be unnerving with minutes of the June FOMC meeting already showing "a few" in favour of a rate hike. Tariffs, energy and fertilizer disruptions and the AI boom are pushing up inflation, leading US money markets into Fed tightening bets. The market implied probability of July action stands at 33% with a first hike almost fully discounted by the September meeting. Fed chair Warsh held his cards close to his chest for now, in line with his overall goal to reduce Fed communication and forward guidance. It's unclear whether he'll be more open in front of Congress, but markets will take any clues especially on the assessment of inflation (risks). Other things to watch in the US this week are the start of Q2 earnings season, retail sales (Thursday) and University of Michigan consumer confidence (Friday) and some final other Fed speakers before the start of the blackout period (July 18).
News & Views
The Czech National Bank was cautious in drawing conclusions from June's unexpectedly sharp CPI deceleration. Price growth fell from 2.1% to 1.5%, final figures showed Friday – below the CNB's 2% mid-point target. That was, however, thanks to steep falls in notoriously volatile fuel and food prices. Fuel for example had raised March and April inflation by almost 1 ppt but had been correcting lower since. Food for its part fell an exceptional 1.3% m/m, reducing headline inflation by 0.6 ppts. The CNB doesn't expect this trend to continue in the months ahead, adding that inflation excluding these volatile items "saw minimal changes and broadly followed the previous trend." Core CPI eased only marginally to 2.8%. It remains supported by strong services inflation (4.5%). CNB deputy governor Zamrazilova flagged concern about consumer demand being so strong and to be the driver of future inflation. The CNB expects headline inflation to be close to 2% in 2026H2 and slightly surpass it towards year-end. Elevated core inflation and the increase in global inflation pressures remain reasons for increased caution, it concluded.
Hungary's parliament is all but certain to oust the incumbent and Orban-allied president Sulyok under a fast-track approval process later today. While the Hungarian president has a largely ceremonial role, prime minister Magyar is trying to avoid getting trapped in a Polish situation. The pro-European government led by Tusk there is hampered in rolling out policies due to the president's veto powers. The removal of Sulyok would therefore be more a symbolical move that underscores Magyar's pledge to not only oust Orban during the last elections but the complete system he had created. His pro-European course along with a longer-term pledge to join the euro area had caused a massive Czechia-like convergence trade that pushed and kept the forint near multi-year highs and triggered regional outperformance of Hungarian bonds.
Brent Oil May Target $85 If US-Iran Escalation Pushes It Through $80
Brent is again approaching level that has repeatedly separated geopolitical noise from a genuine oil-market shock. After jumping above $79 on Monday, crude now faces last week’s high near $80.59. This time, however, backdrop is more dangerous: US-Iran confrontation has widened into a multi-country conflict across Gulf, while competing claims over whether Strait of Hormuz is open have left shipping conditions increasingly uncertain.
Weekend escalation began with an attack on Cyprus-flagged container ship M/V GFS Galaxy as it moved through Strait from Friday into Saturday. Iran’s Islamic Revolutionary Guard Corps called strike a warning against vessels using unauthorized routes, while ship was left ablaze and one of 23 crew members was reported missing. Tehran then declared Strait closed until further notice. Washington answered with biggest US strikes of episode so far, targeting around 140 missile, drone, naval, ammunition, communications and surveillance sites overnight into Sunday. CENTCOM said cumulative number of targets hit across three nights had risen above 300.
More important than size of US operation was breadth of Iran’s retaliation. Attacks and interception alerts spread across Bahrain, Kuwait, Qatar, UAE, Jordan and Oman, bringing several US-aligned states directly into conflict. An oil drilling platform in Kuwait was hit, Qatar intercepted a missile attack, UAE engaged incoming threats, missiles struck Prince Hassan Air Base in Jordan, and drones targeted Oman despite its mediation role. That geographic widening marks clear break from earlier exchanges and increases risk that Gulf governments are pulled deeper into military response.
Hormuz itself is now caught between two incompatible narratives. US military says Strait is open and Iran lacks authority to close it. Iran’s Ports and Maritime Authority says passage is impossible. Markets do not need either claim to be fully correct for oil risk to increase. Shipping can be disrupted through delayed sailings, higher insurance costs, route uncertainty and reluctance among crews and operators long before a formal blockade becomes effective.
That distinction matters for Brent. Previous tensions failed to sustain prices above $80 because actual supply conditions changed little and traders expected diplomatic channels to reopen. Weekend events create a stronger case for a lasting risk premium. Attack on commercial shipping, Iran’s closure declaration and simultaneous strikes across Gulf have made operational disruption more plausible, leaving $80 as key test of whether market begins to price a broader regional supply threat.
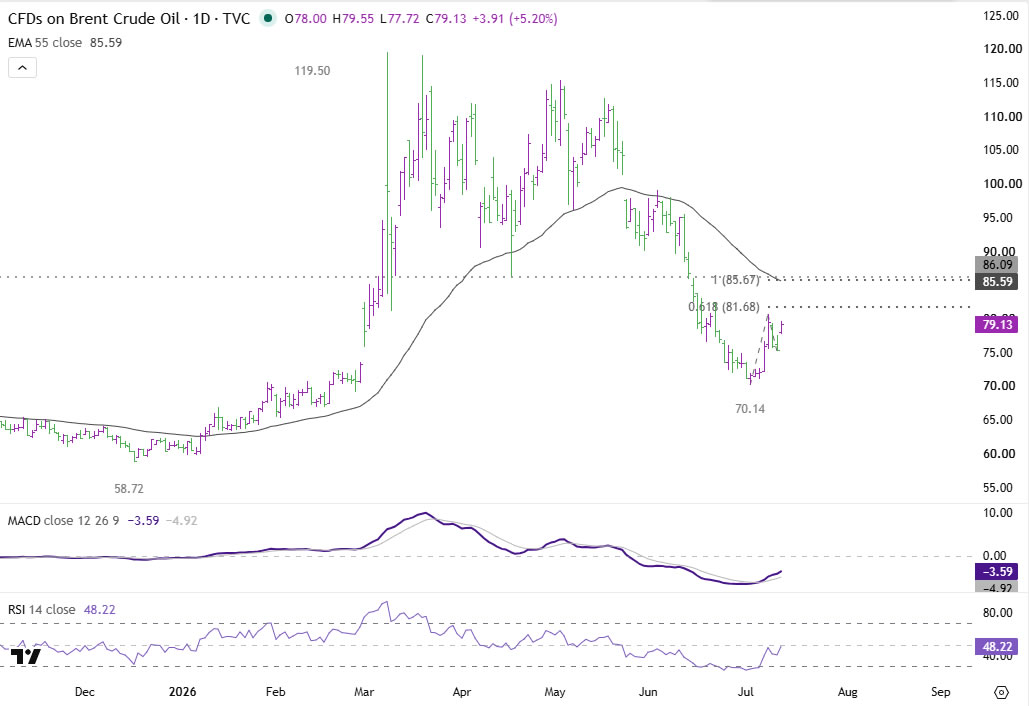
Price action already shows stronger near-term structure. Brent found clear support at 55 4H EMA (now at 75.60), before gapping higher this week. Immediate resistance sits at last week’s 80.59 high. Decisive break would strengthen case for continuation of rebound from 70.14, bringing 61.8% projection of 70.14 to 80.59 from 75.22 at 81.68 into view, followed by 100% projection at 85.67. That target closely matches 55-day EMA at 85.59, making mid-$80s logical destination if upside momentum accelerates.
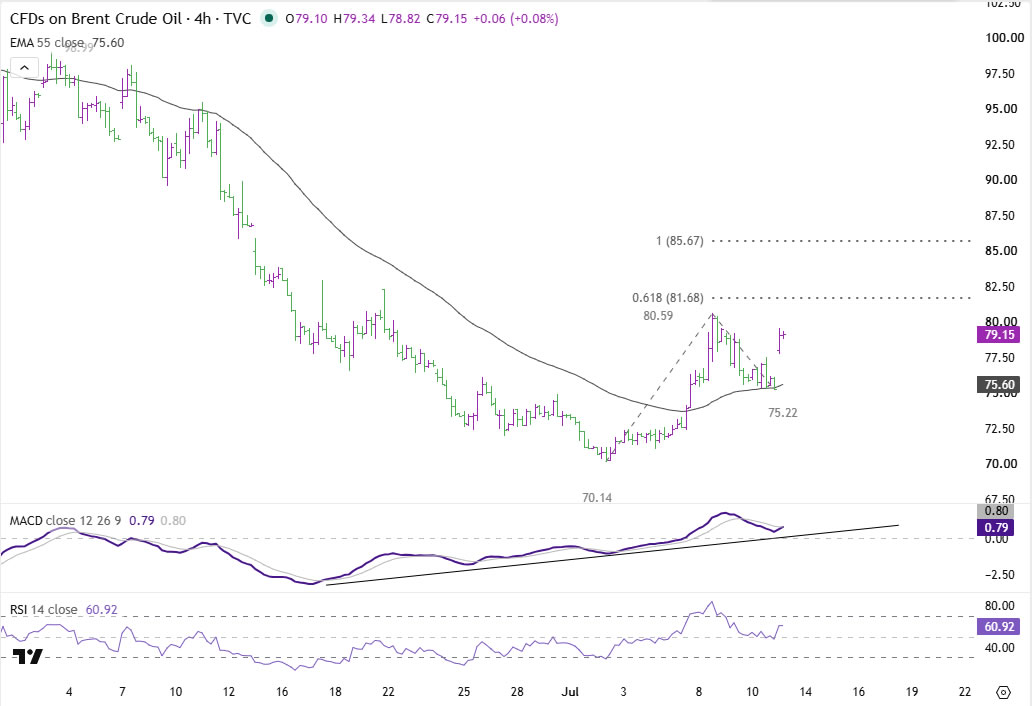
Brent does not need to enter a new long-term bull trend to reach that area. Rally toward 85 would still fit a three-wave corrective rebound within broader decline. But firm break of 80.59 would show that markets are treating escalation as more than another temporary headline. Holding below that level, by contrast, would suggest traders still believe Strait disruption can be contained before physical oil flows are materially affected.
New Zealand BNZ PSI: Services Sector Returns to Expansion, but Recovery Still Tentative
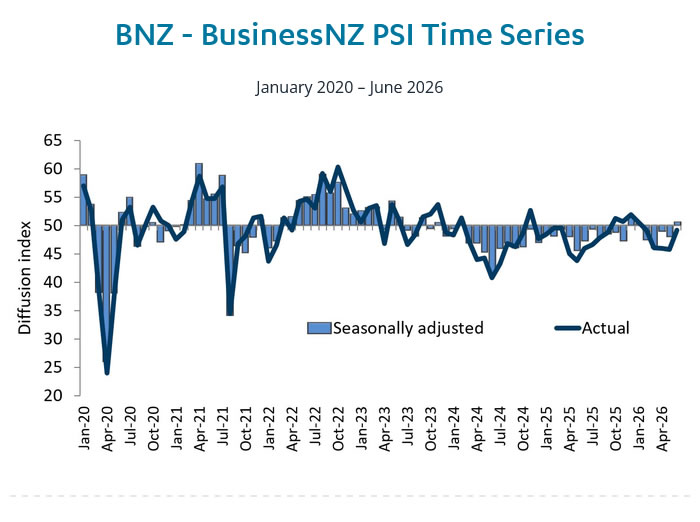
New Zealand's services sector returned to expansion in June, with the BusinessNZ Performance of Services Index rising from 48.0 to 50.6, its first reading above the 50-point threshold since January. The improvement follows a similarly strong rebound in the Performance of Manufacturing Index, suggesting the economy has regained some momentum after a prolonged period of weakness. New orders provided the strongest support, climbing from 48.2 to 53.0, while supplier deliveries also moved back into expansion at 51.2.
Despite the headline improvement, the underlying details point to a recovery that is still in its early stages. Activity and sales improved from 45.1 to 49.3, employment edged only marginally higher from 48.7 to 48.8, and inventories rose from 47.8 to 49.9, leaving all three components just below the expansion threshold.
BusinessNZ Chief Executive Katherine Rich noted that sectors reliant on discretionary consumer spending, including hospitality and personal services, continue to struggle as households prioritize essential expenses amid persistent cost-of-living pressures. BNZ Head of Research Stephen Toplis said the combined rebound in manufacturing and services suggests economic growth could soon approach 2.0%, reinforcing the view that New Zealand's pre-oil shock recovery is resuming rather than accelerating.
For the RBNZ, the report is another indication that domestic activity is gradually improving, but it is unlikely to materially alter the central bank's cautious, data-dependent stance. While the pickup in new orders points to firmer demand ahead, subdued employment and activity measures suggest policymakers still have little reason to contemplate a more restrictive policy path.
| Indicator | Actual | Previous |
|---|---|---|
| BusinessNZ PSI | 50.6 | 48.0 |
| Activity / Sales | 49.3 | 45.1 |
| New Orders / Business | 53.0 | 48.2 |
| Employment | 48.8 | 48.7 |
| Stocks / Inventories | 49.9 | 47.8 |
| Supplier Deliveries | 51.2 | 49.8 |
Market Takeaways
- BusinessNZ PSI returned to expansion for the first time since January 2026, signaling the services sector is stabilizing.
- New Orders was the strongest component, pointing to improving underlying demand.
- Supplier Deliveries also returned to expansion, suggesting business activity is becoming more active.
- Activity, Employment and Inventories all remained below 50, indicating the recovery is still narrow rather than broad-based.
- Together with the strong PMI Manufacturing survey, the data reinforce expectations that New Zealand's economy is resuming its pre-oil shock recovery.
- The report supports the RBNZ's view that growth is improving gradually, but is unlikely to change its cautious, data-dependent policy stance.
EUR/USD Recovery Stumbles at Resistance, Leaving Bulls on Alert
Key Highlights
- EUR/USD started a recovery wave and climbed to test 1.1450.
- A rising channel or a possible bearish pennant is forming with resistance at 1.1500 on the 4-hour chart.
- GBP/USD recovered and tested the 1.3450 resistance.
- WTI Crude Oil prices struggled to stay above $75.00 and trimmed gains.
EUR/USD Technical Analysis
The Euro recovered some losses and climbed above 1.1420 against the US Dollar. However, EUR/USD seems to be facing hurdles near 1.1475 and 1.1500.
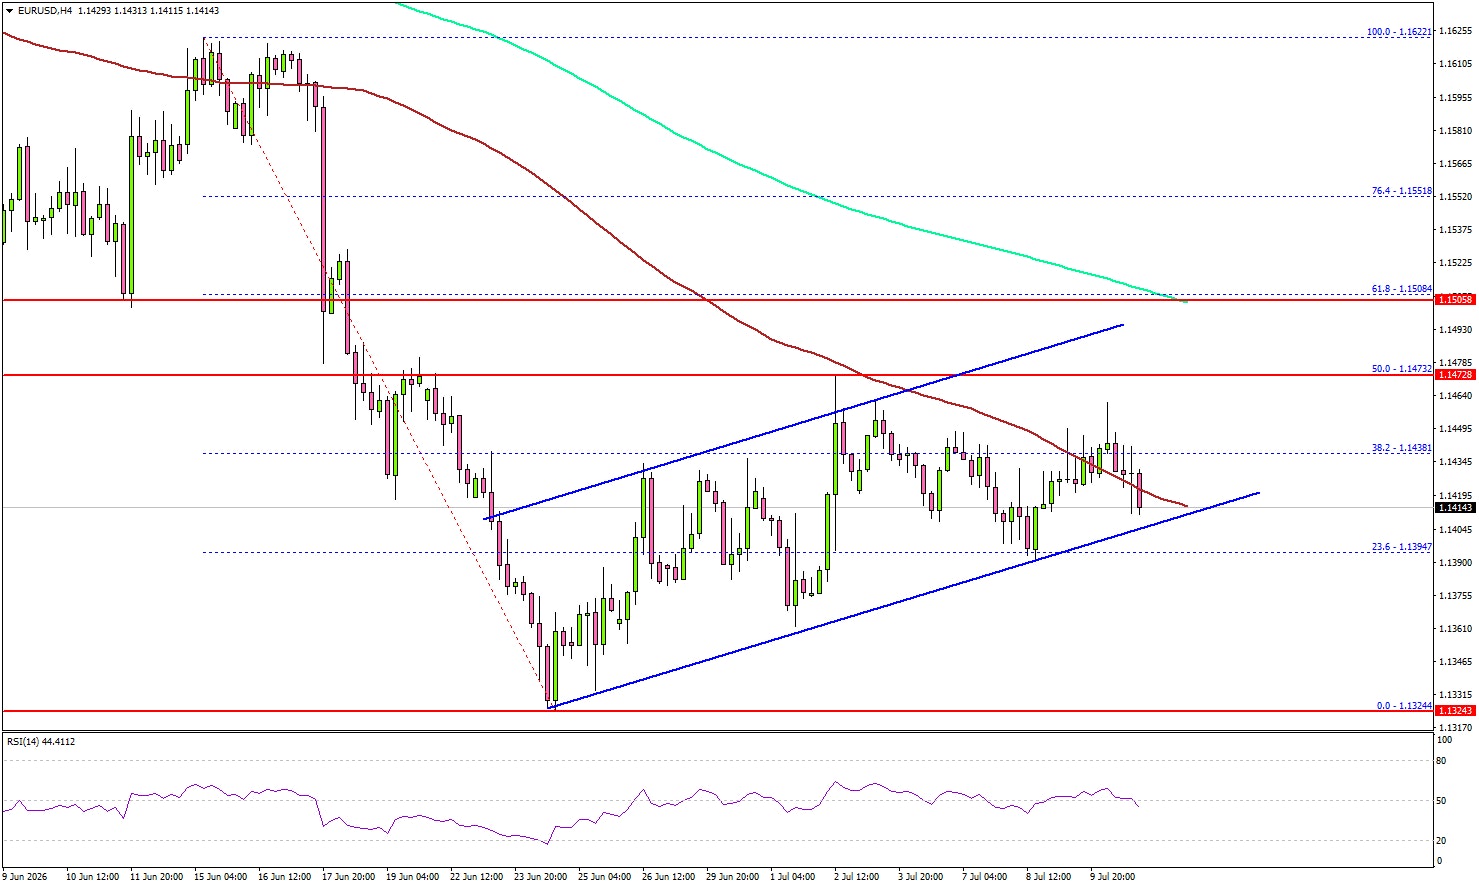
Looking at the 4-hour chart, the pair failed to clear the 50% Fibonacci retracement level of the downward move from the 1.1622 swing high to the 1.1324 low. It also struggled to settle above the 100 simple moving average (red, 4-hour) and remained well below the 200 simple moving average (green, 4-hour).
If there is a fresh decline, the pair might find support near 1.1380. The first major support could be near 1.1350. A downside break and close below 1.1350 might send the pair toward 1.1325. Any more losses could open the doors for a test of 1.1280.
On the upside, the bears might remain active near 1.1475. The next major resistance might be 1.1500. There is also a rising channel or a possible bearish pennant forming with resistance at 1.1500.
A close above the channel resistance could decrease selling pressure. In the stated case, the bulls could aim for a move to 1.1580.
Looking at GBP/USD, the pair recovered some losses, tested the 1.3450 resistance, and now shows some signs of consolidation.
Upcoming Key Economic Events:
- Fed's Waller speech.
- ECB's Schnabel speech.
- Monthly Budget Statement (Jun).
USD/JPY Falls as Japan Encourages Local Investment
Crude oil prices rose at the start of the week after President Trump said the ceasefire was over and fighting had started again. Stock markets fell, while USD/JPY moved back toward recent highs. Later in the week, the U.S. agreed to continue talks with Iran, which caused oil prices to fall again.
There was little major economic data during the week, so markets focused on the Federal Reserve meeting minutes. The minutes showed that a few officials thought interest rates could be raised, but they still supported keeping rates unchanged. This was close to what markets expected, so the reaction was limited.
In Japan, Finance Minister Katayama said the government may encourage the GPIF and other pension funds to invest more in Japanese assets. She also spoke about gradual interest rate rises and more government bond products for households. These comments supported the yen and Japanese stocks, while higher-than-expected producer prices showed that inflation remains a concern.
Markets This Week
U.S. Stocks
The Dow fell from record highs early in the week as oil prices rose after fighting restarted in the Middle East. However, the uptrend stayed in place as the U.S. and Iran continued talks, helping the index close above its 10-day moving average. Buying short-term dips may remain the easier strategy, although higher-than-expected U.S. inflation data could create a chance to sell this week. Resistance levels are at 53,000, 53,500 and 54,000. Support is seen at 52,000, 51,000, 50,000, 49,500 and 49,000.
Japanese Stocks
The Nikkei continued to move lower as investors took profits and higher oil prices worried the market. However, the index recovered late in the week after Finance Minister Katayama encouraged more investment in Japanese stocks. With selling pressure still strong near 70,000, range trading may remain the best approach this week. Resistance is seen at 70,000, 71,000, 72,000, 73,000, 74,000 and 75,000, while support is at 67,500, 66,500 and 65,000.
USD/JPY
USD/JPY tested recent highs early in the week as oil prices moved higher. The pair then fell after the Japanese government called for pension funds to invest more in domestic assets, raising the possibility of less investment overseas. The close below the 10-day moving average is bearish, but higher U.S. interest rates should continue to support the pair unless Japanese authorities intervene. Range trading still appears to offer the best opportunities in the short and medium term. Resistance is at 162.00, 162.50, 163.00 and 165.00, while support is seen at 161.00, 160.50, 160.00, 159.00, 158.00, 157.00, 156.00, 155.50 and 155.00.
Gold
Gold struggled to move higher early in the week as a stronger U.S. dollar weighed on the market. Prices later returned to the 10-day moving average, which provided support. With U.S. inflation data due this week, gold may stay volatile, creating range-trading opportunities between $4,000 and $4,200. Resistance is at $4,200, $4,300, $4,400, $4,500, $4,600 and $4,665, while support is at $4,100, $4,050, $4,000, $3,900, and $3,800.
Crude Oil
Oil rose quickly after President Trump announced renewed fighting with Iran, but the market still expects a positive result from negotiations. Resistance held near $75, and although the recent downtrend has ended, large gains still look unlikely. Range trading between $67.50 and $75 may be the best short-term strategy. Resistance is at $75, $80, $85, $90, $95 and $100, while support is at $67.50, $65, and $60.
Bitcoin
Bitcoin continued its recent recovery as buyers returned to the market. Resistance held near $65,000 and volatility remained low, but with the 10-day moving average now rising, buying on weakness may be a better strategy than range trading this week. Resistance is at $65,000, $75,000, $80,000, $85,000, and $90,000, while support is at $60,000, $55,000 and $50,000.
This Week’s Focus
- Monday: U.S. OPEC Meeting
- Tuesday: Australia NAB Business Confidence, Japan Industrial Production, China Trade Balance, U.S. CPI
- Wednesday: Japan Reuters Tankan Index, China GDP, Industrial Production and Chinese Unemployment Rate, E.U. Industrial Production, U.S. PPI and Beige Book
- Thursday: U.K. GDP and Industrial Production, E.U. Trade Balance, U.S. Retail Sales and Pending Home Sales
- Friday: E.U. Current Account and CPI, U.S. Housing Starts, Industrial Production and Michigan Consumer Sentiment
Several important U.S. reports are due this week, including CPI, PPI, retail sales and consumer confidence. Traders will watch them for clues about when U.S. interest rates may rise. News about talks between the U.S. and Iran will also be important for oil and other markets, while traders will watch for more action from Japan to support the yen.
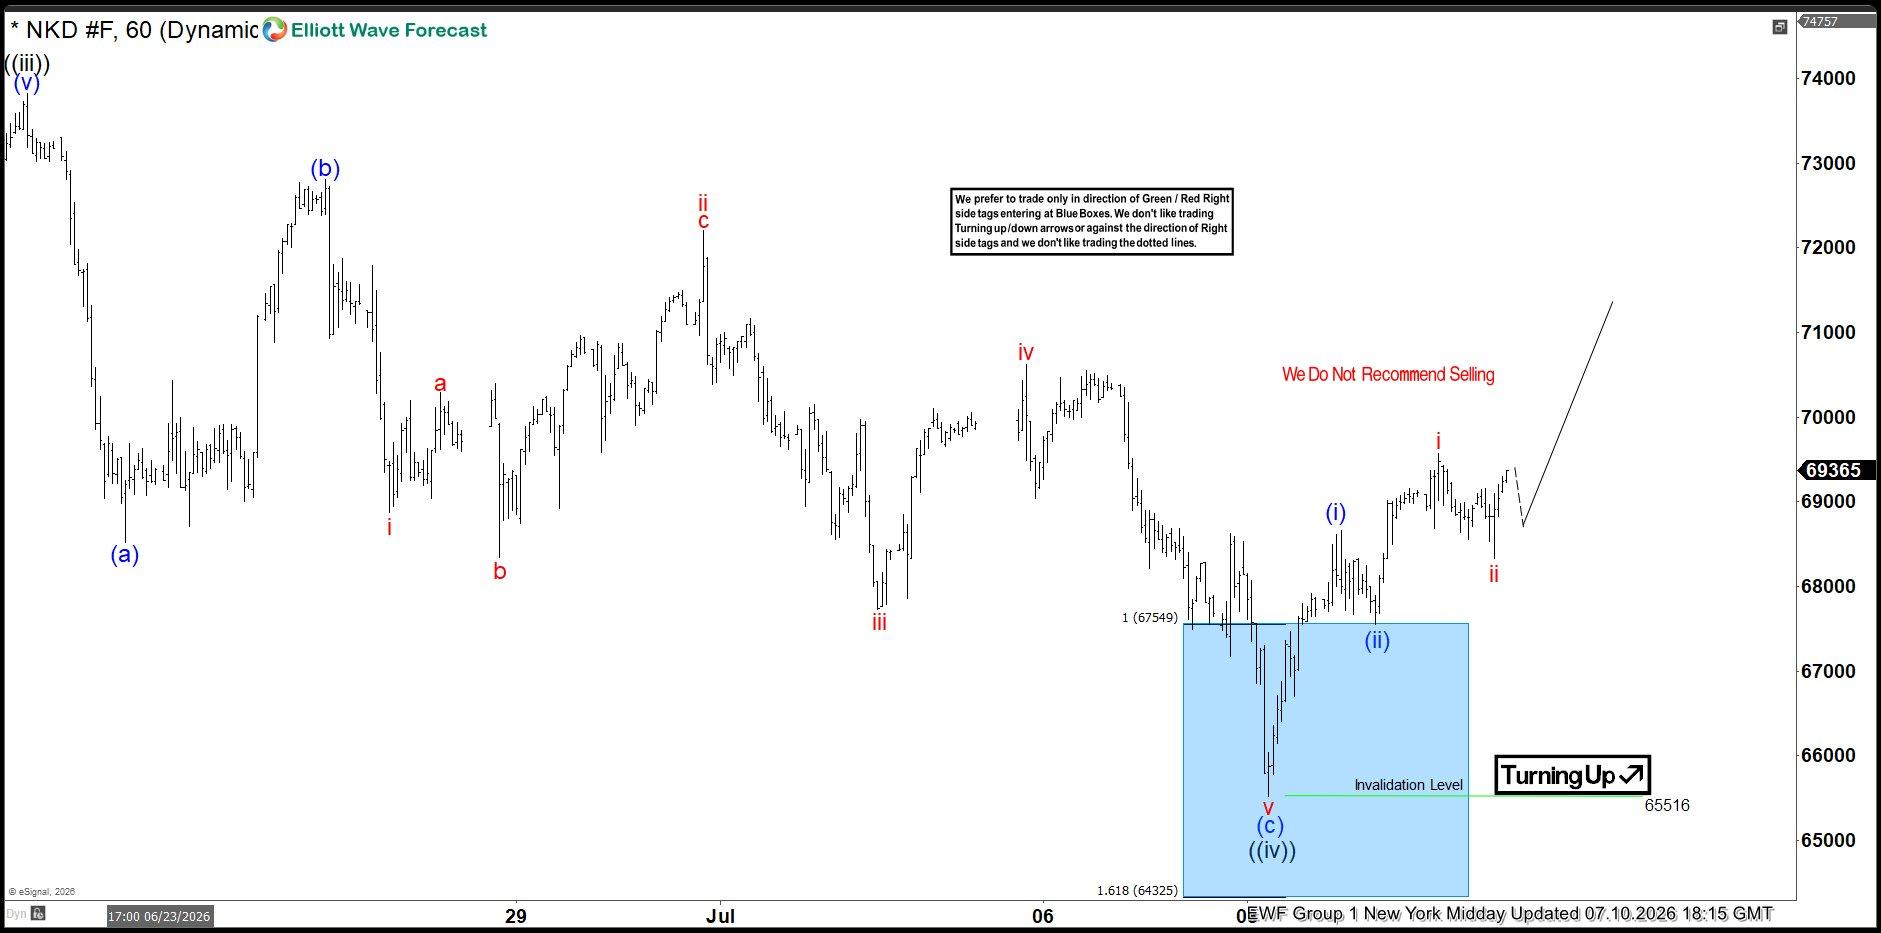
Nikkei Futures (Nkd_F): Buying Zone Hit – Longs Are Now Risk Free
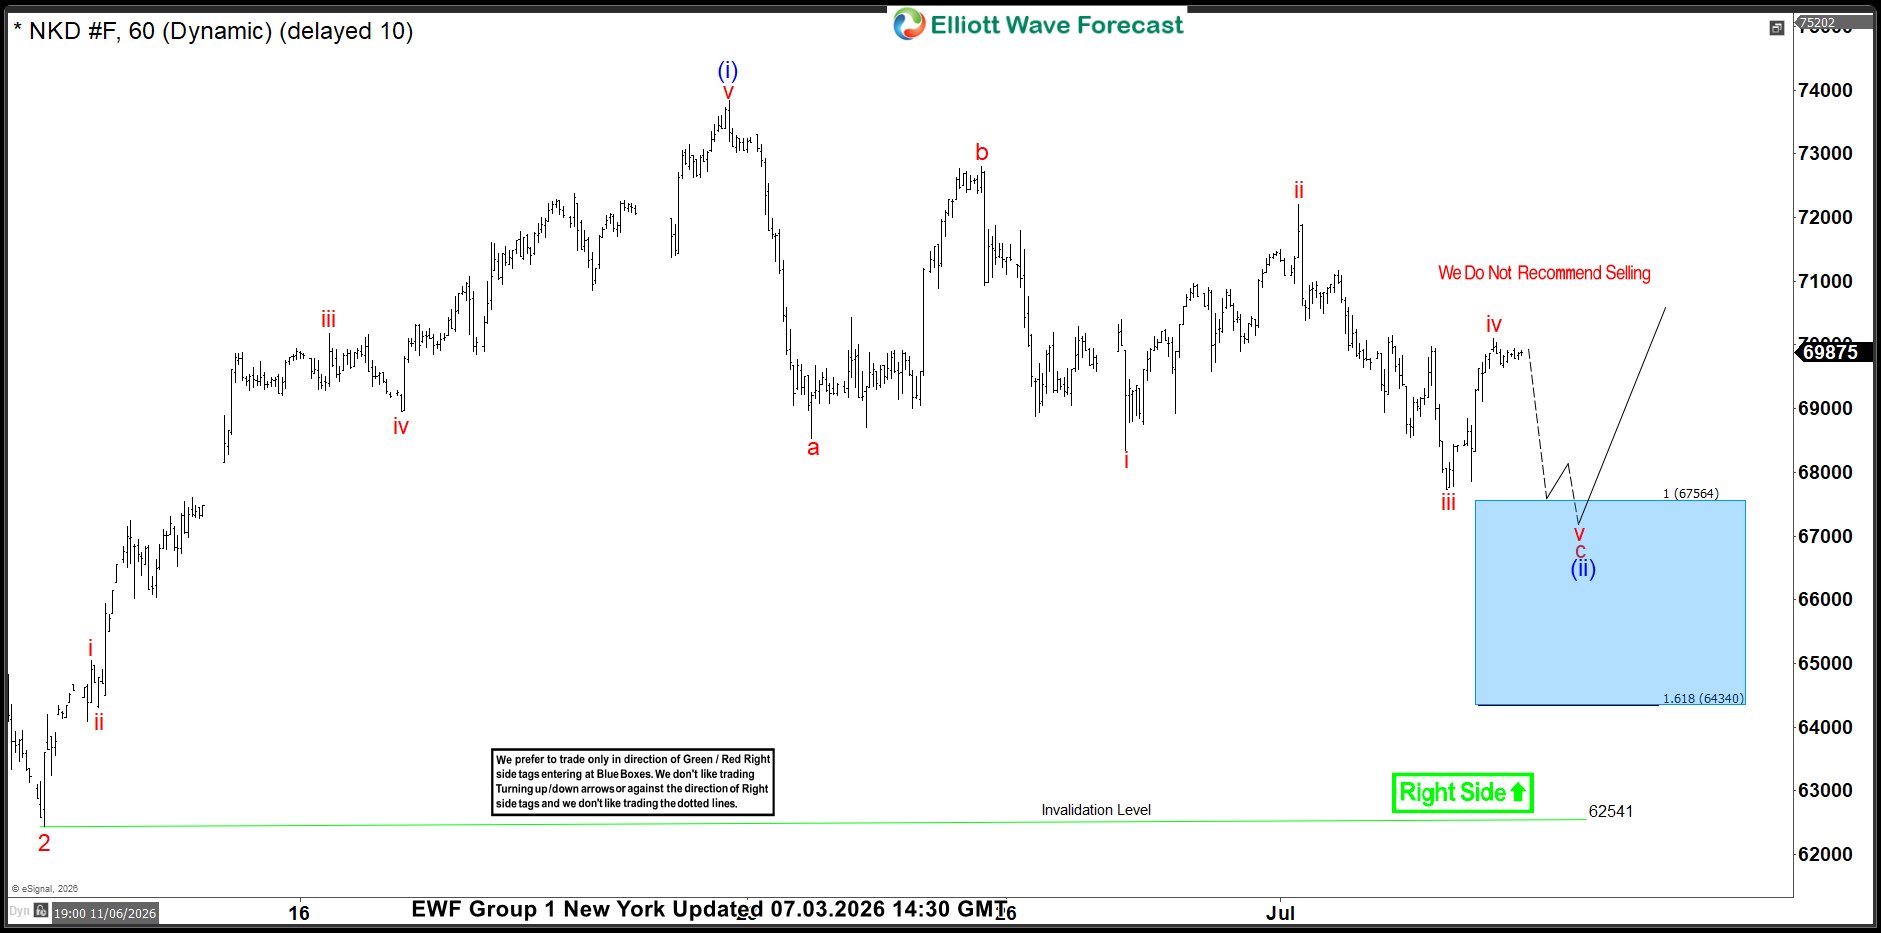
Hello fellow traders. In this technical article we’re going to take a look at the Elliott Wave charts charts of NIKKEI Futures published in members’ area of the website. As our members know, NIKKEI Futures recently completed a pullback that provided a high-probability trading setup. The decline unfolded as a clear Elliott Wave (a)(b)(c) corrective pattern, ending right in the Equal Legs area (Blue Box). In this article, we’ll explain the Elliott Wave structure and the trading setup
NIKKEI Elliott Wave 1 Hour Chart 07.03.2026
NIKKEI Futures is forming a 3-wave pullback, correcting the cycle from the 62,451 low. At this stage, the corrective structure appears incomplete, suggesting that another leg lower is still likely. Our Elliott Wave forecast called for a decline into the Blue Box area at 67564–64340, where we expected buyers to re-enter the market. Due to the bullish sequence on the higher time frames, we advised members to avoid selling the index and instead look for buying opportunities from the Blue Box, expecting at least a three-wave bounce. Once the price reached the 50% Fibonacci retracement of the rally from the connector labeled b in red, the trade became risk-free by moving the stop loss to breakeven while taking partial profits. The setup would be invalidated only if the price broke below the 1.618 Fibonacci extension at 64340.
Official trading strategy on How to trade 3, 7, or 11 swing and equal leg is explained in details in Educational Video, available for members viewing inside the membership area.
90% of traders fail because they don’t understand market patterns. Are you in the top 10%? Test yourself with this advanced Elliott Wave Test
Quick reminder on how to trade our charts :
Red bearish stamp+ blue box = Selling Setup
Green bullish stamp+ blue box = Buying Setup
Charts with Black stamps are not tradable.
NIKKEI Elliott Wave 1 Hour Chart 07.03.2026
NIKKEI Futures completed its correction above the invalidation level and reacted strongly from our Blue Box buying zone. After reaching the 50% Fibonacci retracement of wave (b), all long positions became risk-free. We advised members to move stops to breakeven and secure partial profits, allowing the market to continue with reduced risk. This is the advantage of a structured Elliott Wave process. Instead of chasing moves, our members prepare for high-probability setups and manage risk with a clear trading plan.
Our member chat rooms are open 24/7 and provide ongoing expert guidance on market trends and Elliott Wave analysis. Members are encouraged to ask questions about market structure and technical setups at any time.