Sample Category Title
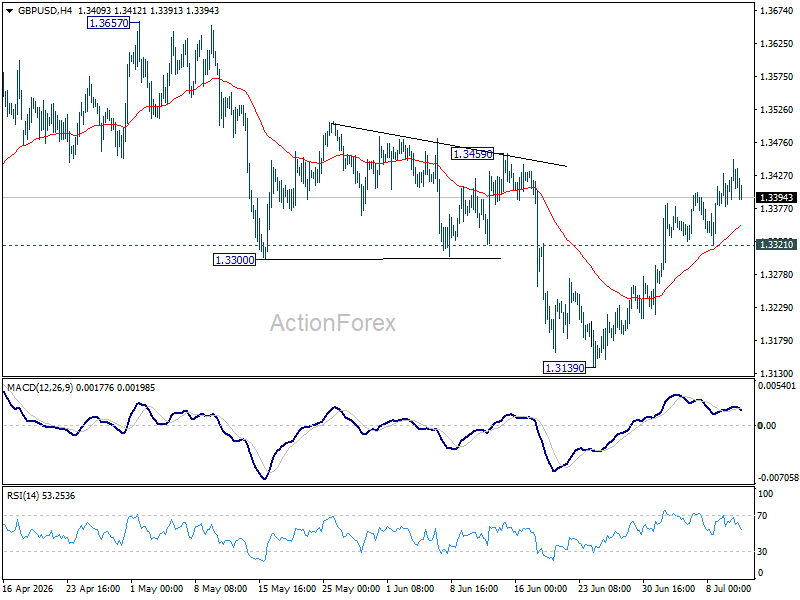
GBPUSD – Recovery Faces Strong Headwinds on Approach to Key 1.3400 Resistance Zone
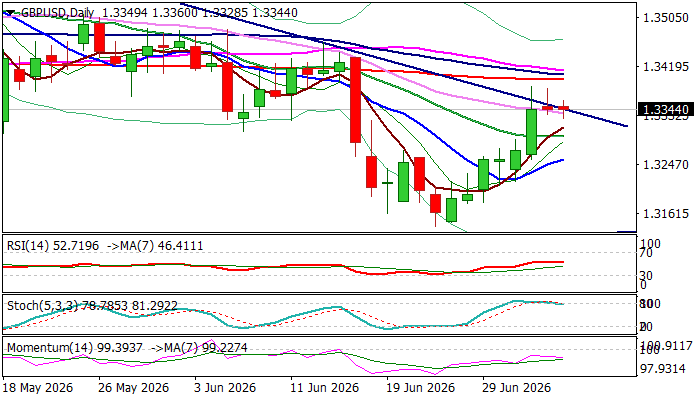
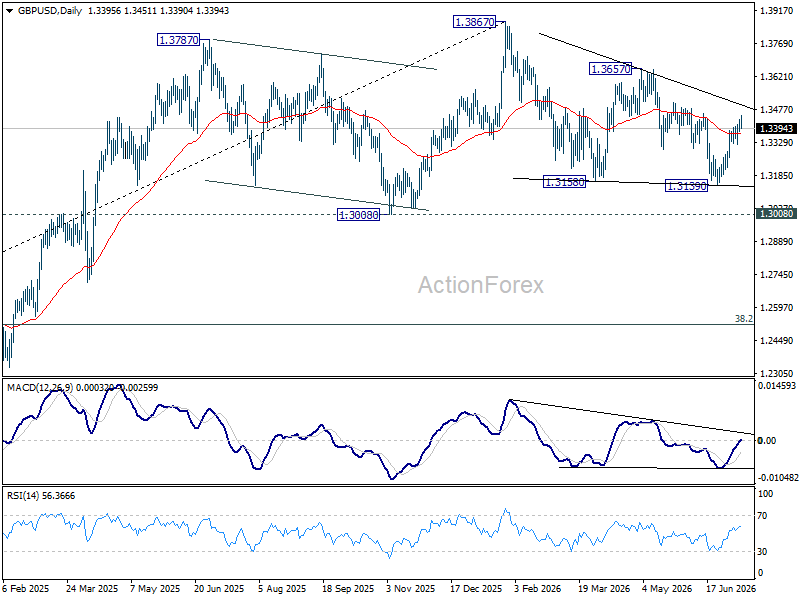
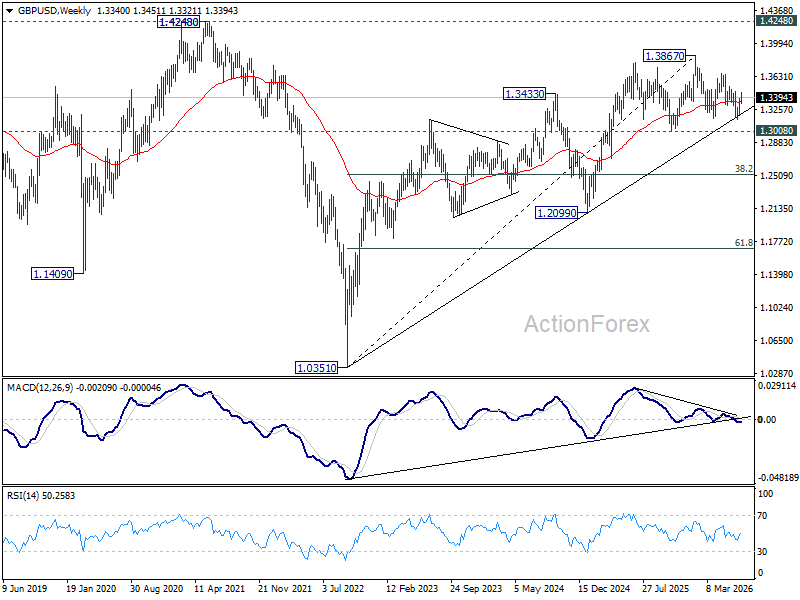
Cable moves within a narrow-range sideways mode for the second consecutive day, after 1% advance last week that completed reversal pattern on weekly chart (after the downleg from 1.3869 was contained by ascending trendline, drawn off 1.0348, 2022 low) and generated positive signal on close above weekly Ichimoku cloud top (1.3335).
On the other side, the picture on daily chart is not that optimistic (14-d momentum remains in negative territory and turns south, stochastic is emerging from overbought territory) as long upper shadows on last two daily candles point to strong headwinds from very significant 1.3400 resistance zone (consisting of converged 200/100/55DMAs / 50% retracement of 1.3653/1.3140 / daily cloud base).
The second consecutive daily Doji candle signals strong indecision and risk of further hesitation and possible recovery stall on approach to pivotal 1.3400 resistance zone.
More likely scenario in the near term would be dips towards 1.3300 zone (psychological / 20DMA) which needs to contain dips and keep in play hopes for fresh acceleration higher and possible attack at 1.3400 zone barriers.
Conversely, firm break of 1.3300 handle would further weaken near-term structure and risk deeper drop.
Res: 1.3385; 1.3400; 1.3412; 1.3460
Sup: 1.3330; 1.3300; 1.3256; 1.3212
Eco Data 7/13/26
| GMT | Ccy | Events | Act | Cons | Prev | Rev |
|---|---|---|---|---|---|---|
| 22:30 | NZD | BusinessNZ PSI Jun | 50.6 | 47.5 |
| 22:30 | NZD |
| BusinessNZ PSI Jun | |
| Actual | 50.6 |
| Consensus | |
| Previous | 47.5 |
EURGBP Wave Analysis
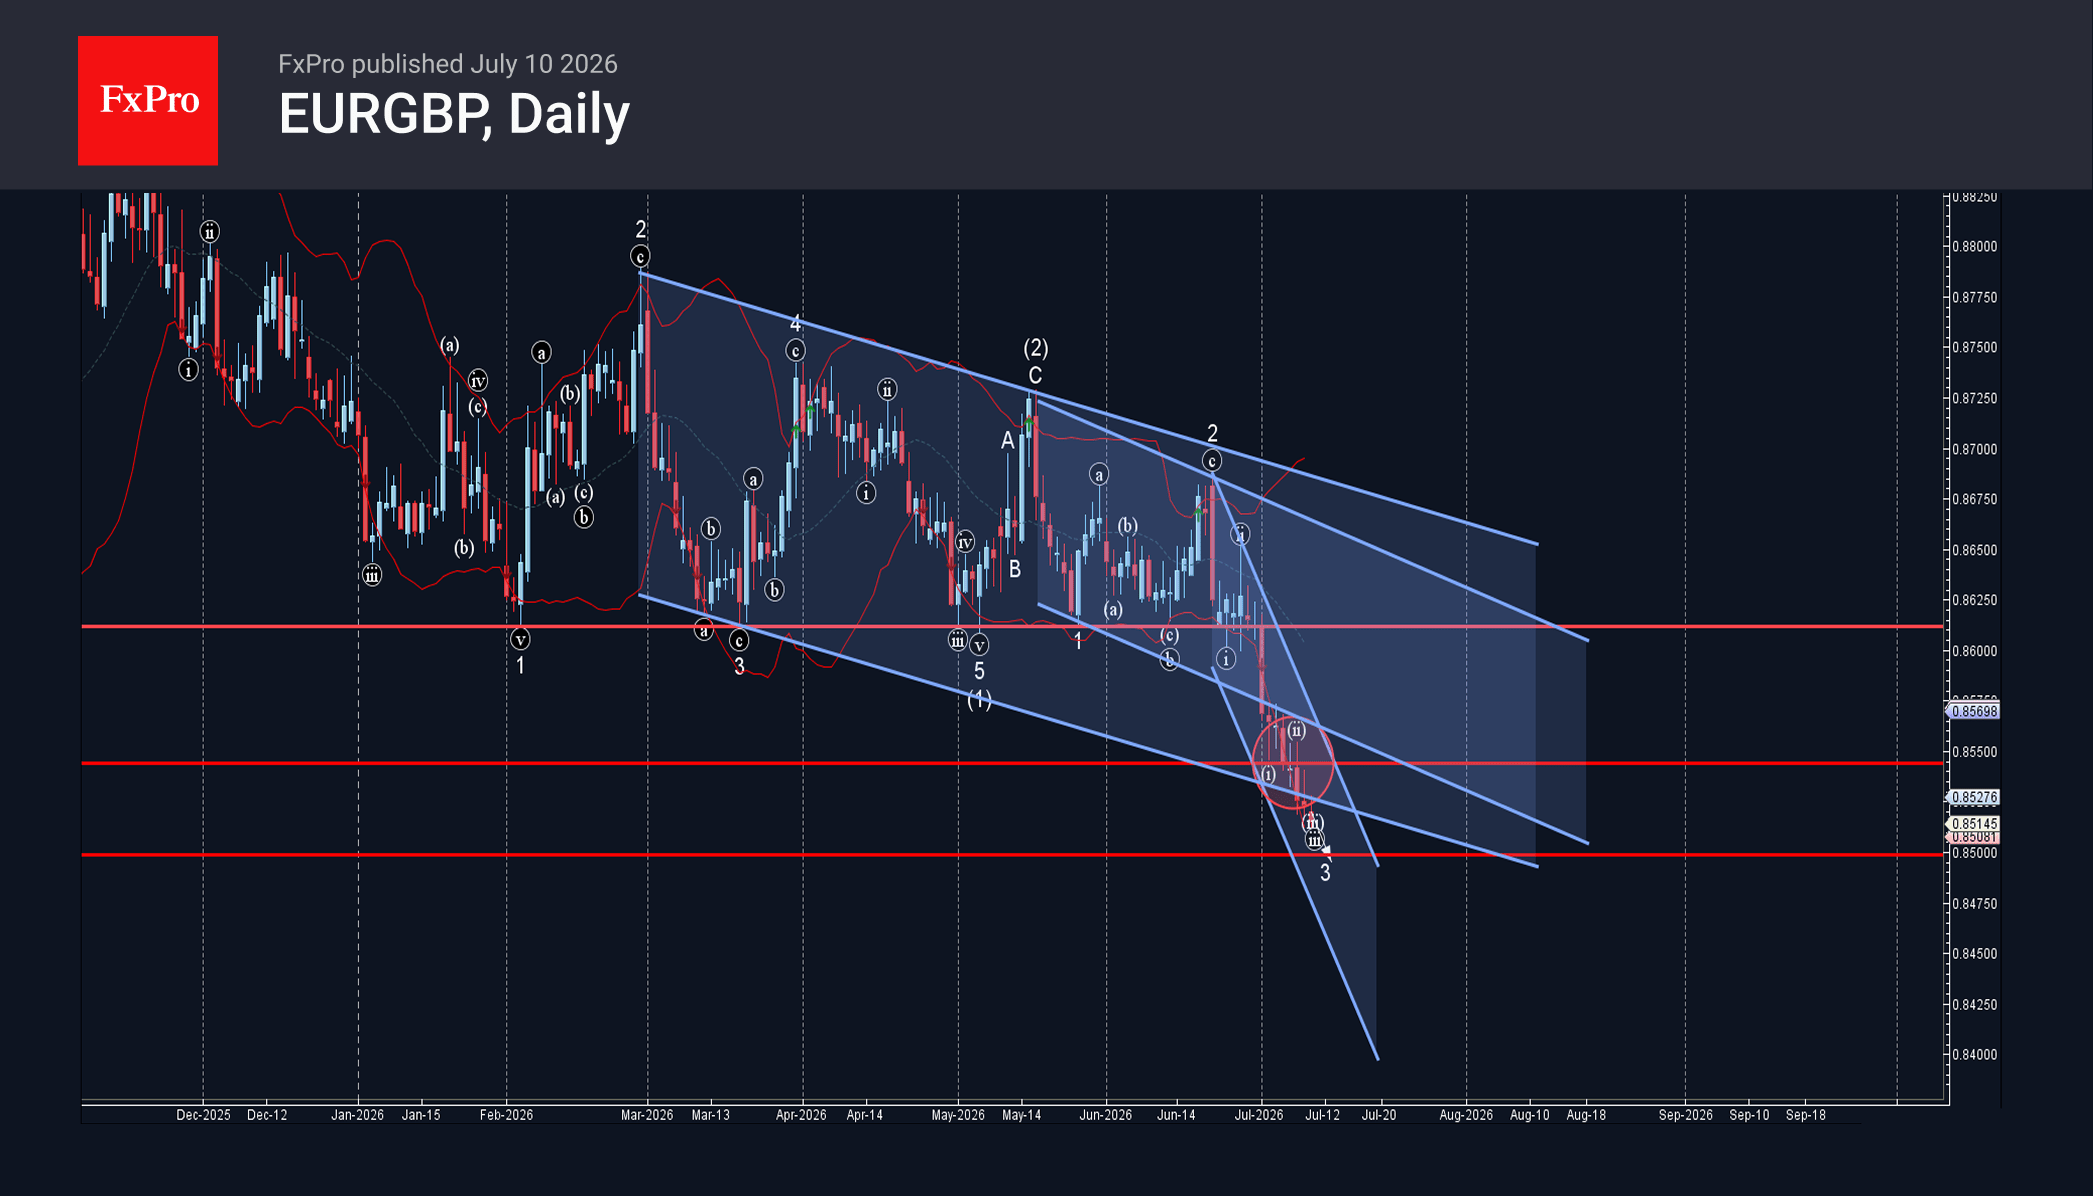
EURGBP: ⬇️ Sell
– EURGBP broke support zone
– Likely to fall to support level 0.8500
EURGBP recently broke through the support zone between the support level 0.8500 and the support trendlines of the two daily down channels from My and February.
The breakout of this support zone accelerated the active minor impulse wave 3 of the intermediate impulse wave (3) from May.
Given the clear daily downtrend, EURGBP can be expected to fall further to the next support level 0.8500 (target price for the completion of the active impulse wave 3).
Yields Break First as Markets Wait for Inflation Confirmation
Last week delivered no shortage of market-moving headlines, yet remarkably few decisive market moves. Investors had to navigate renewed US-Iran tensions, hawkish FOMC minutes, a surprise rate hike from the Reserve Bank of New Zealand, stronger-than-expected Canadian employment, and signs of structural policy shifts in Japan. Despite the unusually dense news flow, most major asset classes ultimately remained confined to familiar ranges, suggesting markets were collecting evidence rather than reaching firm conclusions.
That pattern was especially evident across currencies, commodities and equities. Oil briefly surged above USD 80 as the fragile US-Iran ceasefire appeared to unravel before retreating back toward USD 75 as both sides resumed technical talks. Gold and Silver initially extended their declines on renewed geopolitical uncertainty and firmer Fed expectations, only to recover part of those losses as fears of broader escalation eased. Equities displayed similar resilience. DOW briefly reached another record high, it still finished the week lower, while S&P 500 and NASDAQ advanced but remained below recent peaks. Across markets, price action reflected frequent shifts in sentiment without producing sustained directional conviction.
One market, however, stood apart. US Treasury yields quietly delivered what may prove to be the week's most important signal. Following hawkish June FOMC minutes, the 10-year Treasury yield broke above a key near-term resistance and closed at its highest level in weeks, indicating investors are becoming increasingly convinced that the Federal Reserve may need to tighten policy further if inflation proves persistent. That breakout now places next week's US CPI report firmly at the center of the macro calendar. Rather than determining whether inflation remains elevated, the data are more likely to determine whether the Treasury market's latest move represents the beginning of another leg higher in yields—or merely another false breakout in an otherwise headline-driven market.
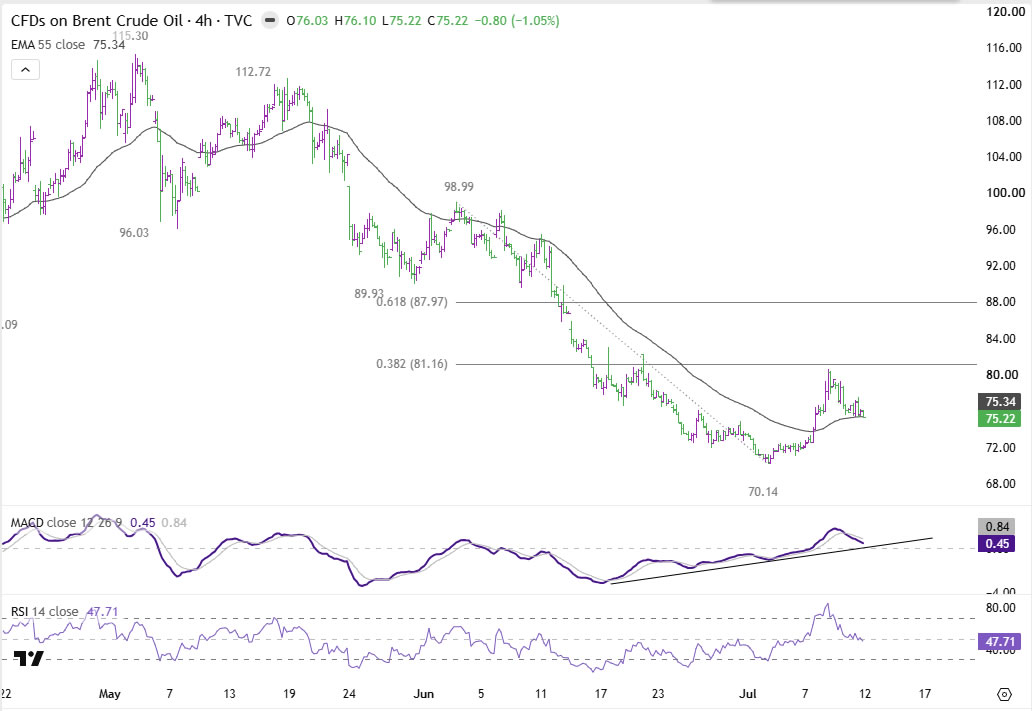
Oil Finds Balance as Iran Tensions Flare but War Premium Fails to Return
The Middle East once again dominated headlines last week, but the market's ultimate verdict was notably restrained. What initially appeared to be a serious deterioration in US-Iran relations—including attacks on commercial shipping near the Strait of Hormuz, retaliatory US airstrikes, Washington's decision to revoke Iran's oil-export waiver, and President Donald Trump's declaration that the ceasefire was "over"—briefly reignited fears that the conflict was sliding back toward open confrontation. Brent crude responded by surging above the psychologically important USD 80 level, reviving concerns that a geopolitical risk premium was returning to energy markets.
Yet the rally quickly lost momentum as events failed to evolve into a broader military escalation. Despite the exchange of hostilities, both Washington and Tehran gradually shifted back toward technical discussions by the end of the week, suggesting that neither side was prepared to abandon negotiations altogether. Trump's own remarks reflected that ambiguity. While declaring the ceasefire effectively dead, he simultaneously left the door open for continued talks. The conflicting messages reinforced the market's growing view that flare-ups have become part of the negotiating process rather than definitive evidence that diplomacy has collapsed. As a result, Brent surrendered much of its earlier gains to finish the week near USD 75, leaving a weekly increase of 4.6%—noticeable, but modest compared with the sharp swings seen since hostilities first escalated in late March.
The price action highlights an important shift in how investors are interpreting geopolitical developments. Earlier this year, each military incident was sufficient to trigger an aggressive repricing of supply risks. That leaves Brent's brief move above USD 80 looking more like a temporary squeeze driven by short covering than the beginning of a new bull run. Looking ahead, the USD 80-81 area remains the key technical and psychological threshold. A sustained break above that zone would signal markets are once again pricing a genuine deterioration in supply conditions. Until then, energy markets appear content to treat renewed hostilities as another episode within an unresolved—but still manageable—geopolitical standoff.
Hawkish Fed Minutes Lift Yields, But Dollar Still Awaits Confirmation
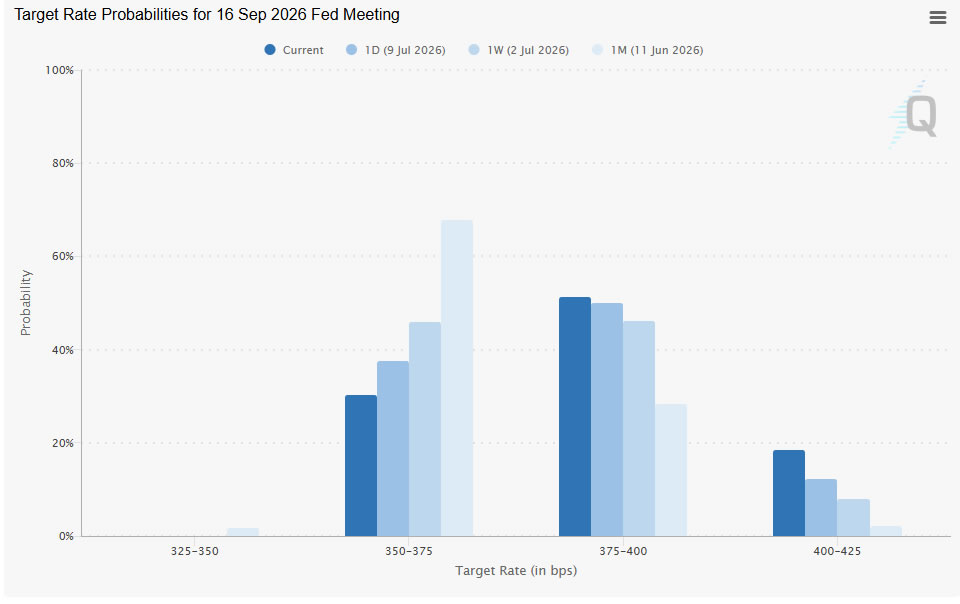
June's FOMC minutes provided one of the week's clearest hawkish surprises, reinforcing the view that the Federal Reserve remains firmly focused on inflation risks despite holding rates unchanged. The minutes revealed a Committee split almost evenly between those favoring another rate hike this year and those preferring to remain on hold, while inflation risks were explicitly assessed as tilted to the upside. Officials pointed not only to tariffs and higher energy prices stemming from the renewed Middle East conflict, but also to persistent demand generated by AI-related investment, with rising electricity consumption and technology-sector costs increasingly viewed as additional sources of inflationary pressure.
The most striking revelation, however, was that "a few participants" believed there was already "a case for raising the target range" at the June meeting itself before ultimately agreeing to wait for additional evidence. That language suggested the debate within the Committee had already moved beyond whether another hike would be necessary to whether the evidence had become sufficient to justify immediate action. While the decision to hold was unanimous, the minutes made clear that unanimity on the vote masked a much more divided discussion beneath the surface. Markets responded by increasing the probability of a September rate hike to around 70%, up from roughly 63% before the release, reflecting growing confidence that the Fed's tightening cycle may not yet be over.
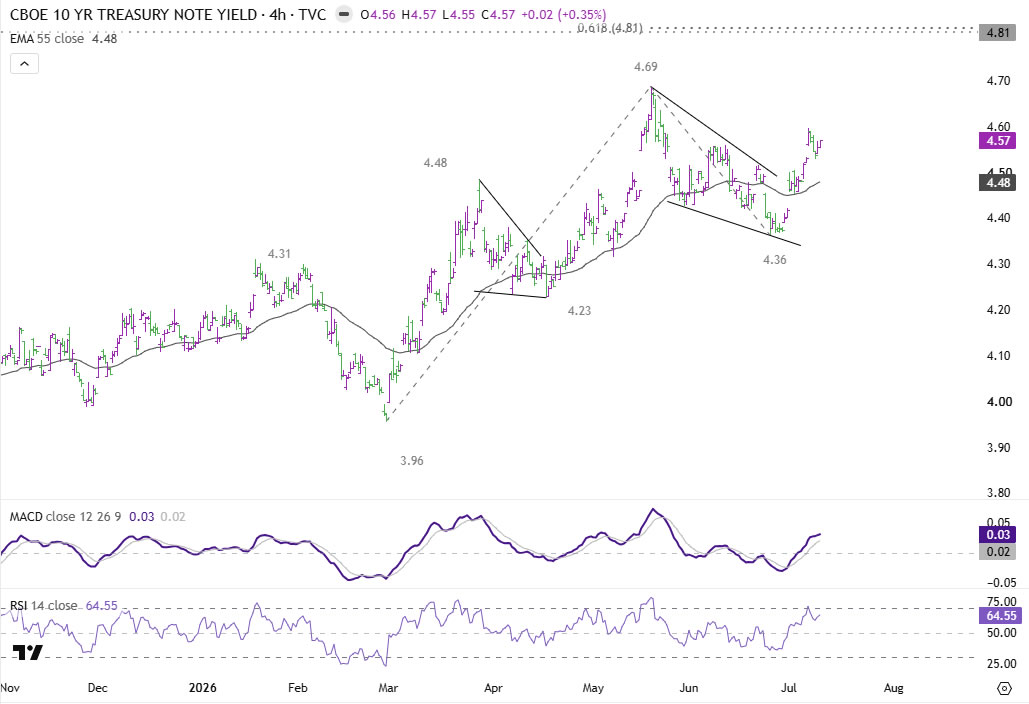
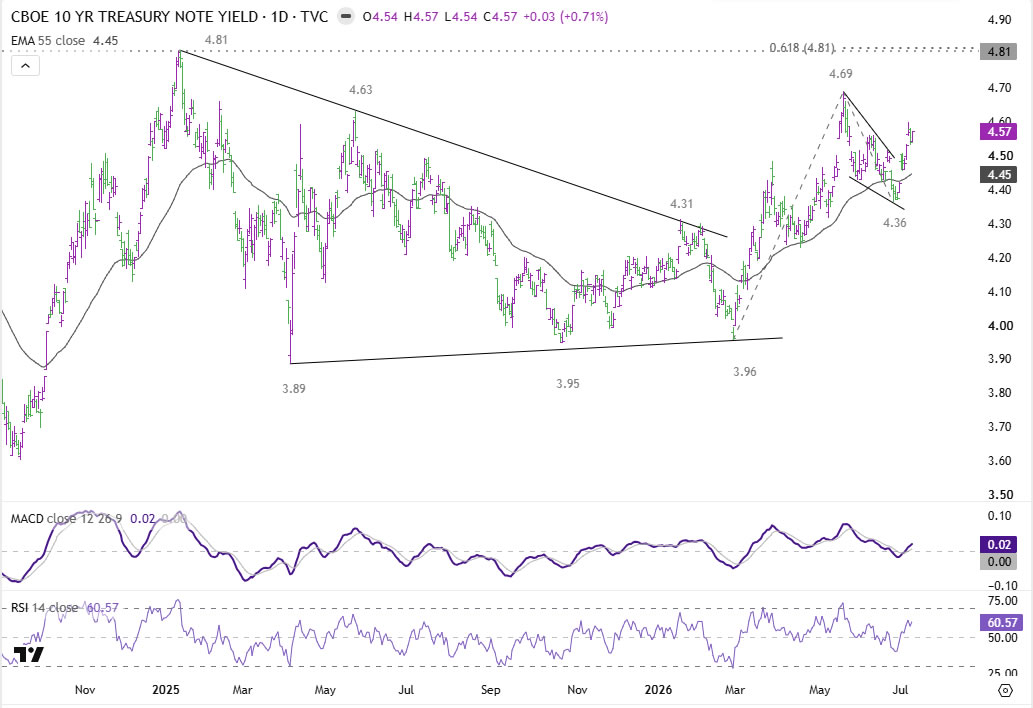
10-Year Treasury Yield Breakout Could Be the Week's Most Important Signal
While most major asset classes spent last week oscillating between competing narratives, the US Treasury market delivered a much cleaner message. The benchmark 10-year yield climbed from 4.49% to 4.57%, breaking above the important near-term resistance at 4.56% before closing the week keep much of the gains. Unlike moves in equities, commodities or foreign exchange—which were repeatedly influenced by changing headlines surrounding Iran and shifting risk sentiment—the rise in yields can be explained largely by one factor: markets increasingly repricing the prospect that the Federal Reserve may not yet be finished tightening.
Technically, the picture has improved noticeably for Treasury yields. The decisive break above 4.56 strongly suggests that the pullback from May's 4.69 high was merely a correction within the broader advance from March's 3.96% low. As long as the 55 4H EMA, now near 4.48, continues to provide support, further gains remain favored. The first objective is a retest of the 4.69 peak. Decisive break there will resume whole rally from 3.96 to 61.8% projection of 3.96 to 4.69 from 4.36 at 4.81. That is close to 2025 high at 4.81.
Dollar Index Awaits Yield Confirmation to Break Higher
Unlike Treasury yields, Dollar Index ended the week without delivering a decisive technical breakout. Despite increasingly hawkish Fed expectations and a meaningful rise in US yields, the greenback spent another week consolidating below the 101.80 resistance level. That restrained performance suggests currency markets remain reluctant to fully embrace another leg of Dollar strength until incoming inflation data provide clearer evidence that the Federal Reserve will indeed need to tighten policy further.
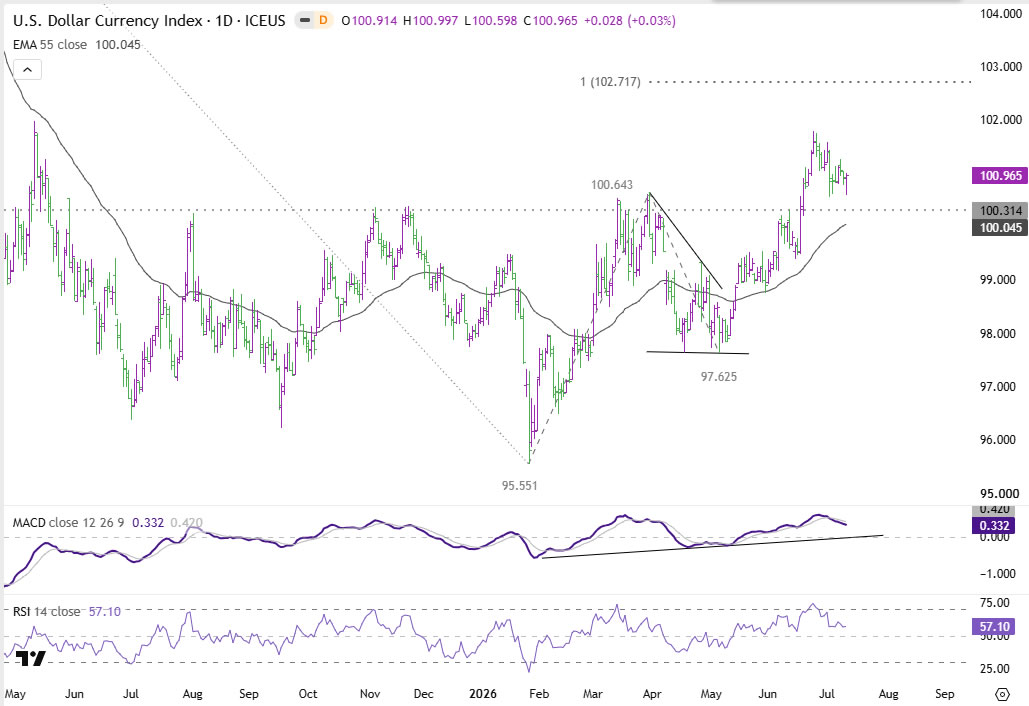
Technically, the broader outlook remains bullish despite the recent consolidation. Price action from 101.80 continues to be viewed as a pause within the larger advance from this year's 95.55 low rather than the beginning of a reversal. As long as the important 100.20-100.31 support zone—comprising the 38.2% retracement of the 97.62-101.80 rally and nearby structural support—holds, the bullish bias remains intact.
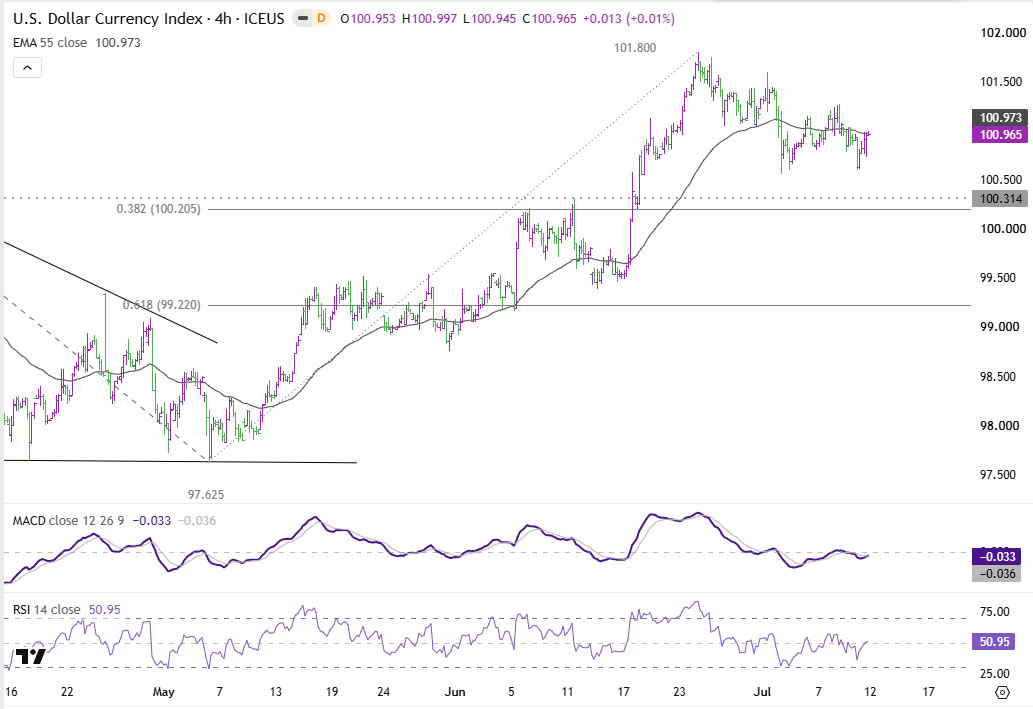
Decisive break above 101.80 would confirm the resumption of the broader uptrend and target 100% projection of 95.55 to 100.64 from 97.62 at 102.71. On the downside, however, sustained break below the 100.20/31 support area would significantly weaken the bullish case, opening the door for a deeper correction toward 55 D EMA, now near 100.04, and potentially beyond.
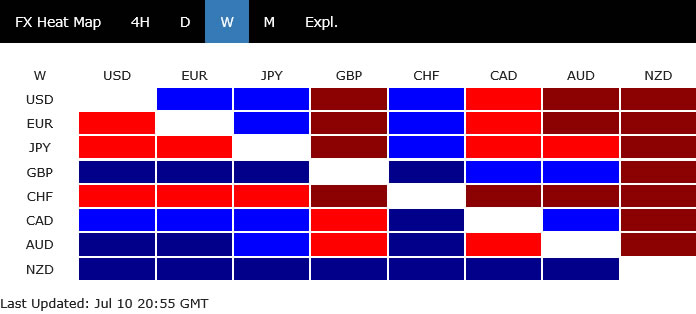
Kiwi Leads as Domestic Fundamentals Outshine Global Uncertainty
Currency performance last week was driven less by broad shifts in risk sentiment than by diverging domestic fundamentals. New Zealand Dollar emerged as the week's strongest major currency after the Reserve Bank of New Zealand delivered a 25 basis point rate hike that caught part of the market off guard. While opinions had been divided ahead of the meeting, the decision was quickly reinforced by a surprisingly strong June manufacturing PMI, which surged to its highest level since mid-2021.
Sterling ranked as the second-best performer, with gains continuing to be driven primarily by domestic developments rather than changes in global risk appetite. The fading of political uncertainty following the resolution of the Labour leadership transition continued to fuel the unwinding of sizeable speculative short positions accumulated before Prime Minister Keir Starmer's resignation.
Canadian Dollar finished third despite persistent uncertainty surrounding the future of the USMCA following Washington's decision not to extend the trade agreement automatically. Support instead came from stronger-than-expected employment data, which largely removed residual speculation that the Bank of Canada might eventually need to consider easing policy later this year.
At the opposite end of the rankings, Swiss Franc underperformed as rising US and European bond yields reduced demand for low-yielding defensive currencies. Yen also finished among the weakest performers. While Finance Minister Katayama's proposal to encourage greater domestic pension-fund investment briefly lifted the currency, the absence of concrete policy measures and the still-wide US-Japan interest-rate differential limited follow-through buying.
Dollar, Euro and Australian Dollar ended the week in the middle of the performance table, reflecting the broader market's reluctance to establish strong directional positions ahead of next week's US CPI report.
EUR/USD Weekly Outlook
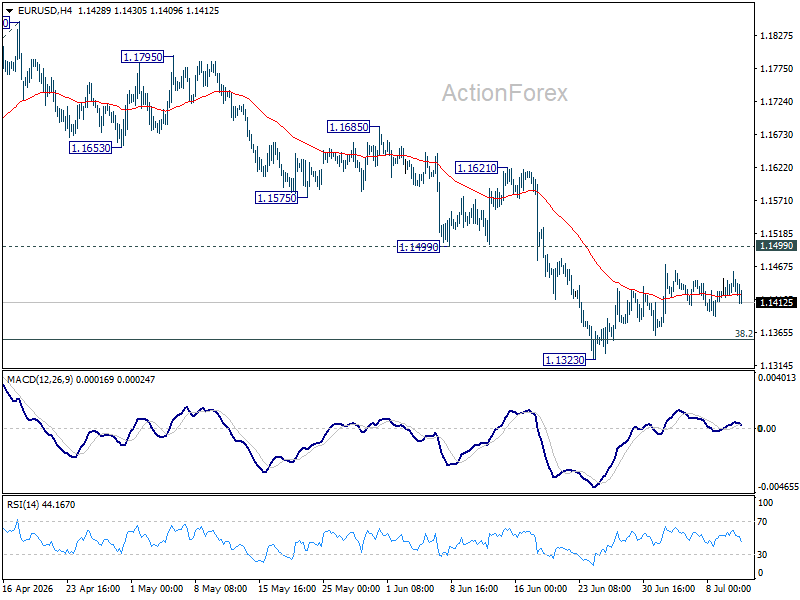
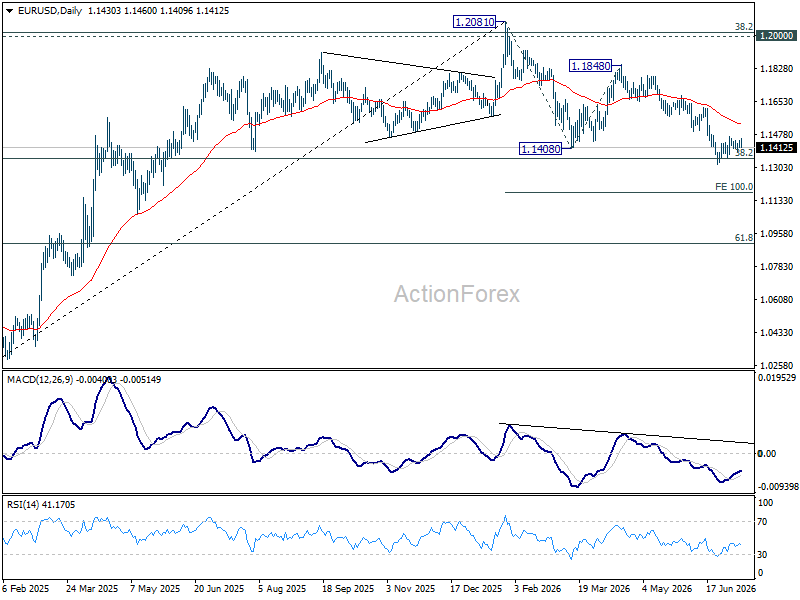
EUR/USD's consolidation from 1.1323 continued last week and outlook is unchanged. Initial bias remains neutral this week. With 1.1499 support turned resistance intact, further decline is expected. On the downside, break of 1.1323 will resume the fall from 1.2081 to 100% projection of 1.2081 to 1.1408 from 1.1848 at 1.1175. However, decisive break of 1.1499 will turn bias back to the upside for 1.1621 resistance.
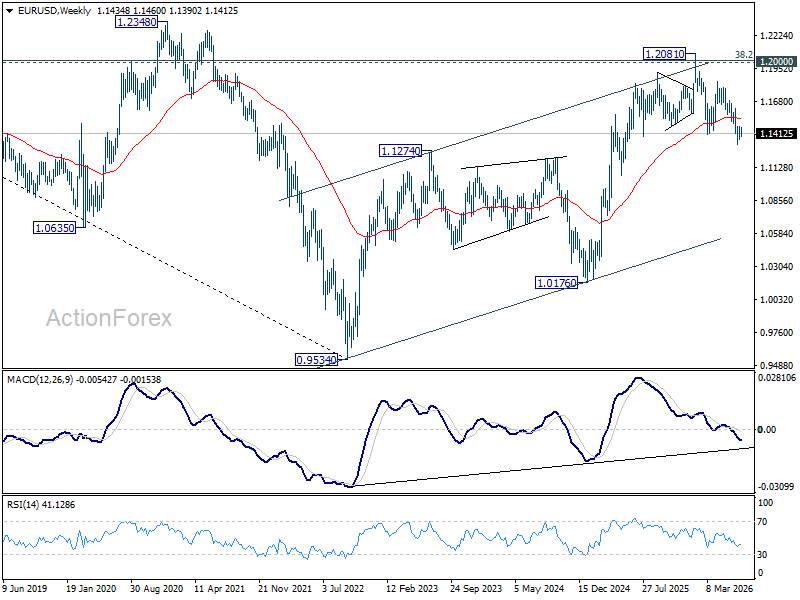
In the bigger picture, focus is back on 38.2% retracement of 1.0176 to 1.2081 at 1.1353. Decisive break there will revive the case of medium term bearish trend reversal after rejection by 1.2 key cluster resistance level. Further fall should be seen to 61.8% retracement at 1.0904. Nevertheless, strong rebound from 1.1353, followed by break of 1.1621 resistance, will retain medium term bullishness.
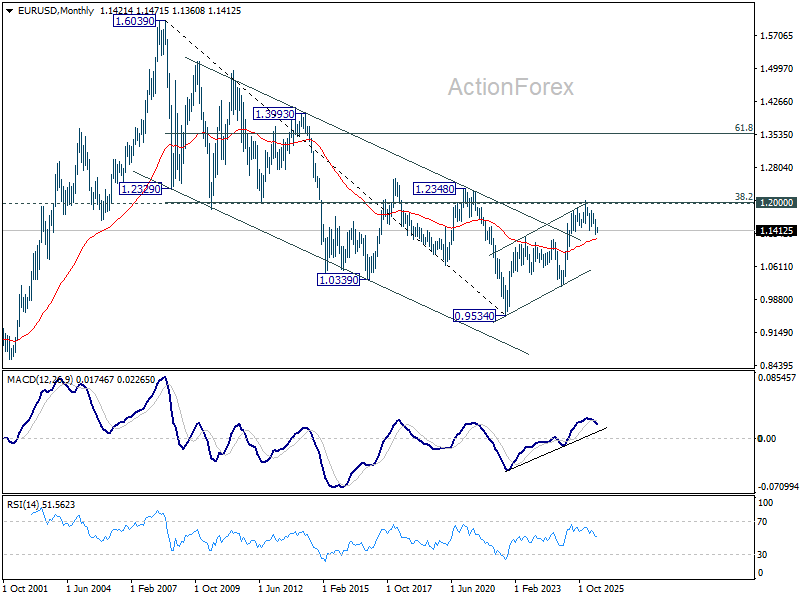
In the long term picture, 38.2% retracement of 1.6039 to 0.9534 at 1.2019, which is close to 1.2000 psychological level is the key for the outlook. Rejection by this level will keep the multi decade down trend from 1.6039 (2008 high) intact, and keep outlook neutral at best. However, decisive break of 1.2000/19, will suggest long term bullish trend reversal, and target 61.8% retracement at 1.3554.
EUR/USD Weekly Outlook
EUR/USD's consolidation from 1.1323 continued last week and outlook is unchanged. Initial bias remains neutral this week. With 1.1499 support turned resistance intact, further decline is expected. On the downside, break of 1.1323 will resume the fall from 1.2081 to 100% projection of 1.2081 to 1.1408 from 1.1848 at 1.1175. However, decisive break of 1.1499 will turn bias back to the upside for 1.1621 resistance.
In the bigger picture, focus is back on 38.2% retracement of 1.0176 to 1.2081 at 1.1353. Decisive break there will revive the case of medium term bearish trend reversal after rejection by 1.2 key cluster resistance level. Further fall should be seen to 61.8% retracement at 1.0904. Nevertheless, strong rebound from 1.1353, followed by break of 1.1621 resistance, will retain medium term bullishness.
In the long term picture, 38.2% retracement of 1.6039 to 0.9534 at 1.2019, which is close to 1.2000 psychological level is the key for the outlook. Rejection by this level will keep the multi decade down trend from 1.6039 (2008 high) intact, and keep outlook neutral at best. However, decisive break of 1.2000/19, will suggest long term bullish trend reversal, and target 61.8% retracement at 1.3554.
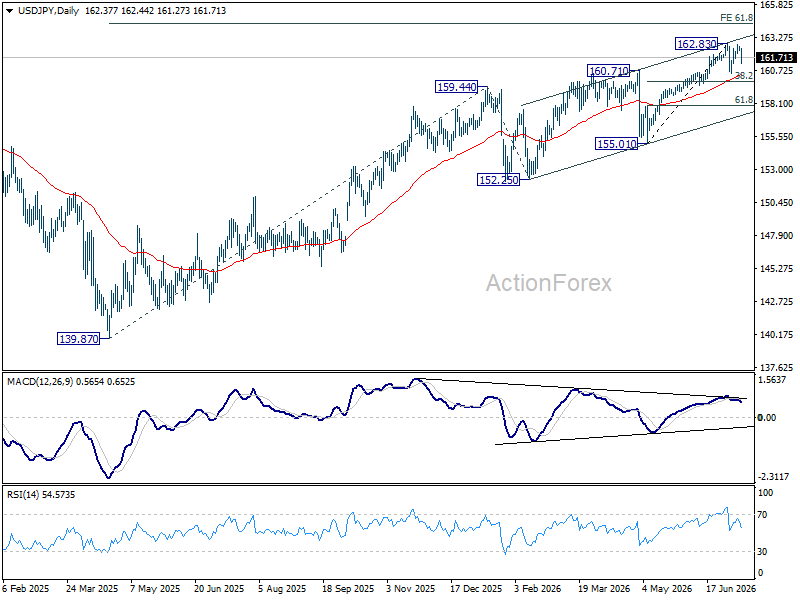
USD/JPY Weekly Outlook
USD/JPY extended the consolidation pattern from 162.83 with another falling leg last week. Overall outlook is unchanged and initial bias remains neutral first. While deeper decline cannot be ruled out, downside should be contained by 38.2% retracement of 155.01 to 162.83 at 159.84. On the upside, above 161.63 minor resistance will turn intraday bias neutral. Overall, consolidations should continue below 162.83 for a while.
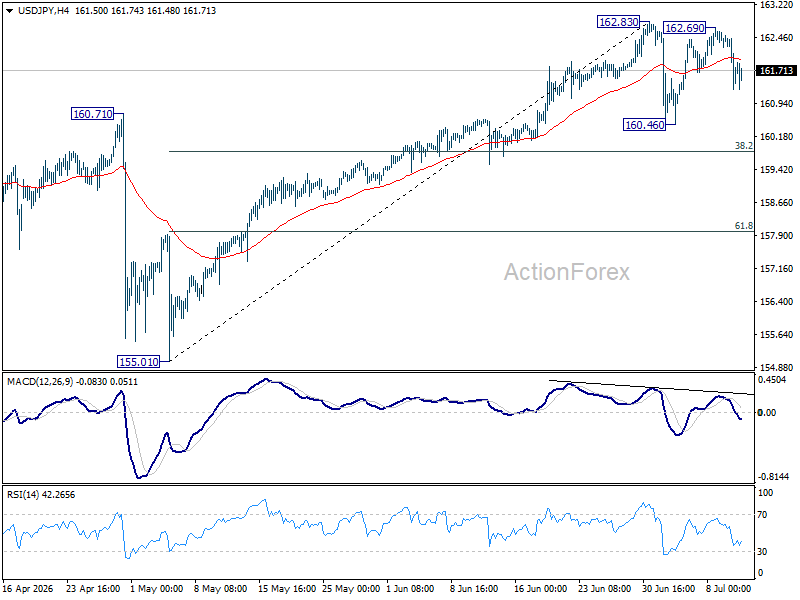
In the bigger picture, rise from 139.87 (2025 low) is seen as another rising leg of the long term up trend. Next target is 61.8% projection of 139.87 to 159.44 from 152.25 at 164.34. For now, outlook will remain bullish as long as 155.01 support holds, even in case of deep pullback.
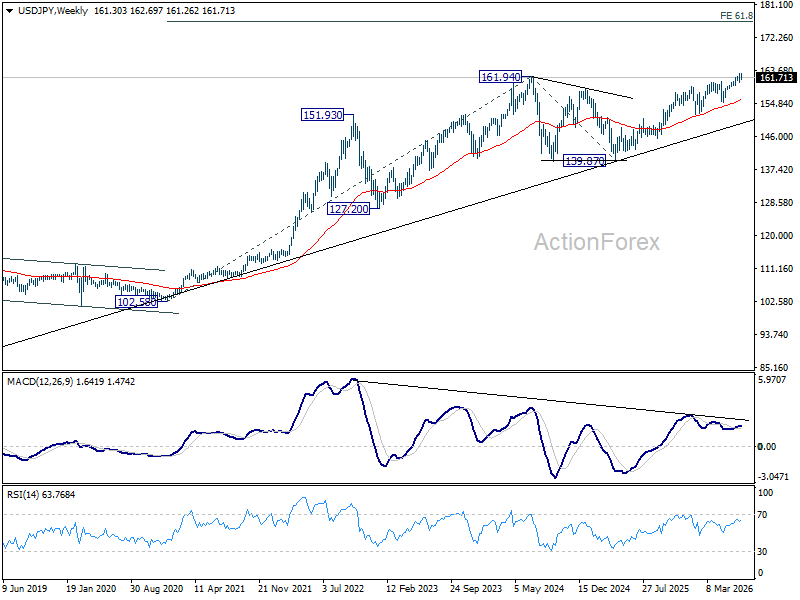
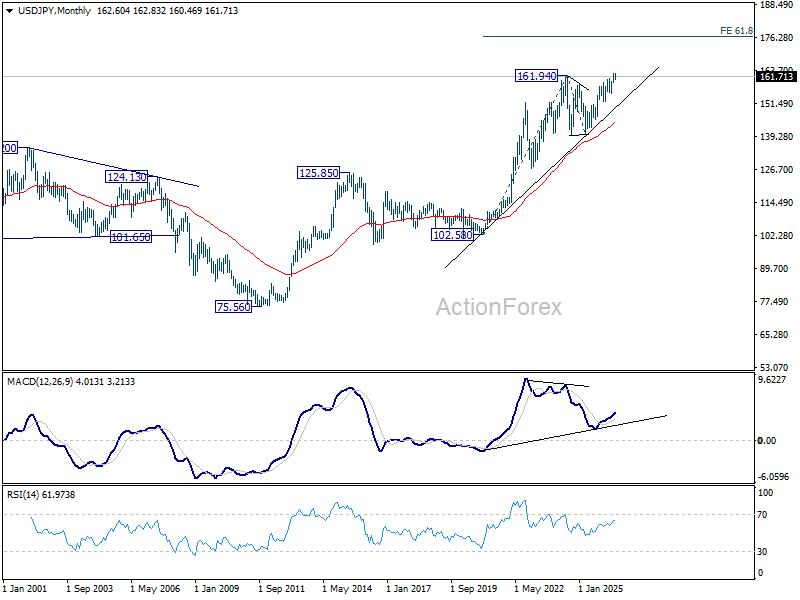
In the long term picture, up trend from 75.56 (2011 low) is still in progress and might be ready to resume. Firm break of 161.94 will target 61.8% projection of 102.58 (2020 low) to 161.94 (2024 high) from 139.87 at 176.55 in the medium term. Long term outlook will stay bullish as long as 139.87 support holds, even in case of deep pullback.
GBP/USD Weekly Outlook
GBP/USD's rise from 1.3139 continued last week. Initial bias stays on the upside this week for 1.3459 resistance. Firm break there will argue that whole correction from 1.3867 has completed, and target 1.3657 resistance for confirmation. On the downside, below 1.3321 minor support will turn intraday bias neutral again first.
In the bigger picture, price actions from 1.3867 are a corrective pattern within the broader up trend from 1.0351 (2022 low). With 1.3008 support intact, medium term bullishness is maintained and break of 1.3867 is in favor for a later stage, towards 1.4248 key resistance (2021 high). However, firm break of 1.3008 will at least bring deeper fall to 38.2% retracement of 1.0351 to 1.3867 at 1.2524, with increased risk of bearish reversal.
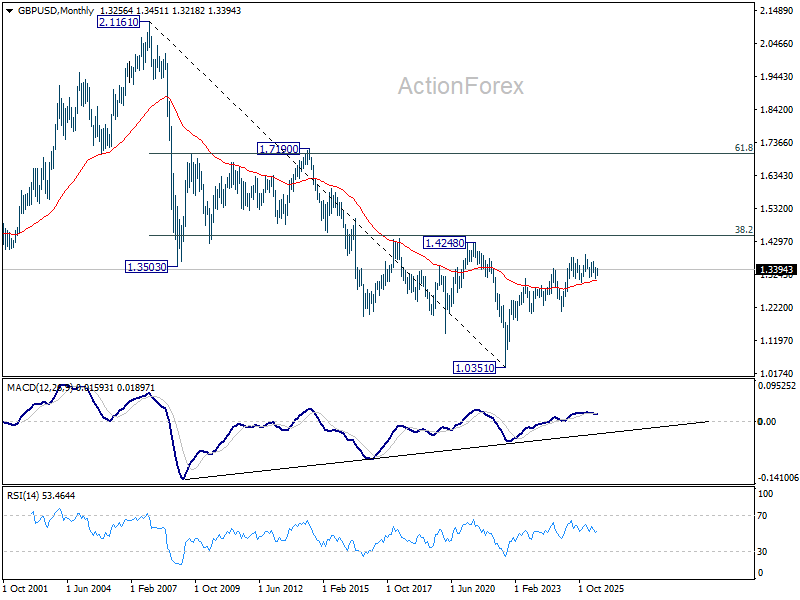
In the long term picture, as long as 1.4248/4480 resistance zone holds (38.2% retracement of 2.1161 to 1.0351 at 1.4480), the long term outlook will remain bearish. That is, price actions from 1.0351 are seen as a corrective pattern to down trend from 2.1161 (2007 high) only. Nevertheless, decisive break of 1.4248/4480 will be a strong sign of long term bullish reversal.
USD/CHF Weekly Outlook
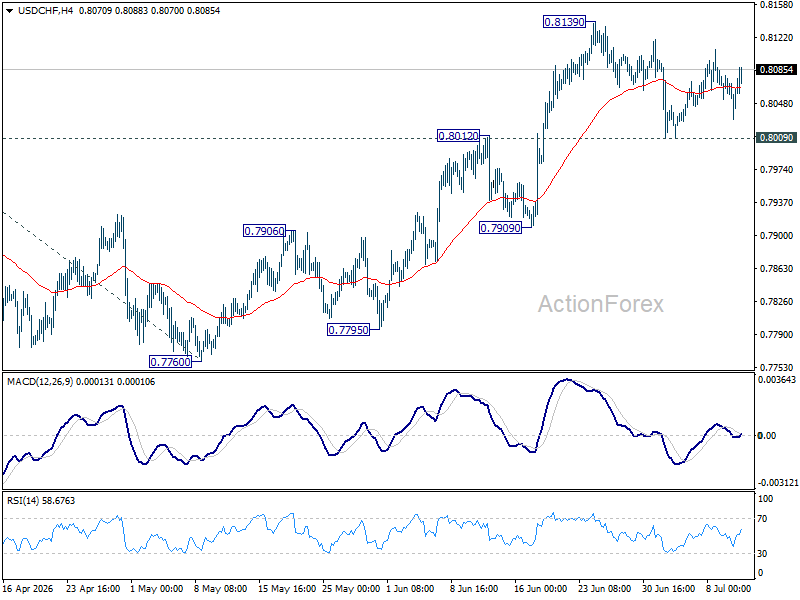
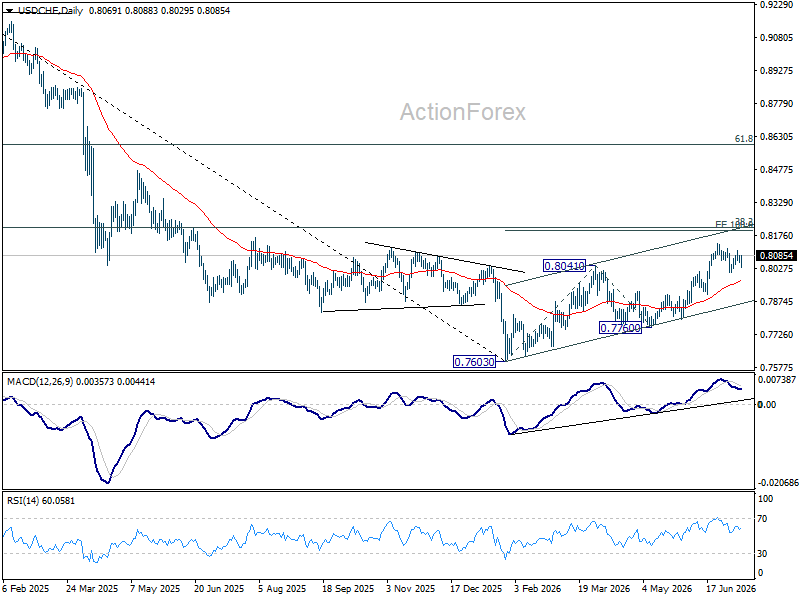
USD/CHF stayed in consolidations below 0.8139 last week and outlook is unchanged. Initial bias stays neutral this week first. With 0.8009 support intact, further rise is expected. On the upside, above 0.8139 will extend the rally from 0.7760 to 100% projection 0.7603 to 0.8041 from 0.7600 at 0.8198 next. However, sustained break of 0.8012 will bring deeper fall to 0.7909 support instead.
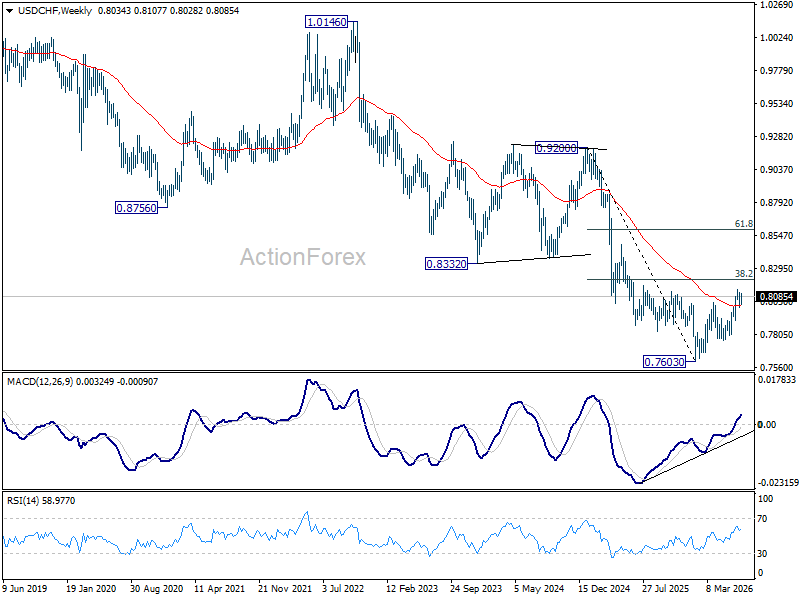
In the bigger picture, while a medium term bottom was formed at 0.7603, it's still early to call for bullish trend reversal. As long as 38.2% retracement of 0.9200 (2025 high) to 0.7603 at 0.8213 holds, the larger down trend could still continue through 0.7603 at a later stage. However, firm break of 0.7603 will argue that the trend has reversed and turn focus to 0.8332 support turned resistance (2023 low) for confirmation.
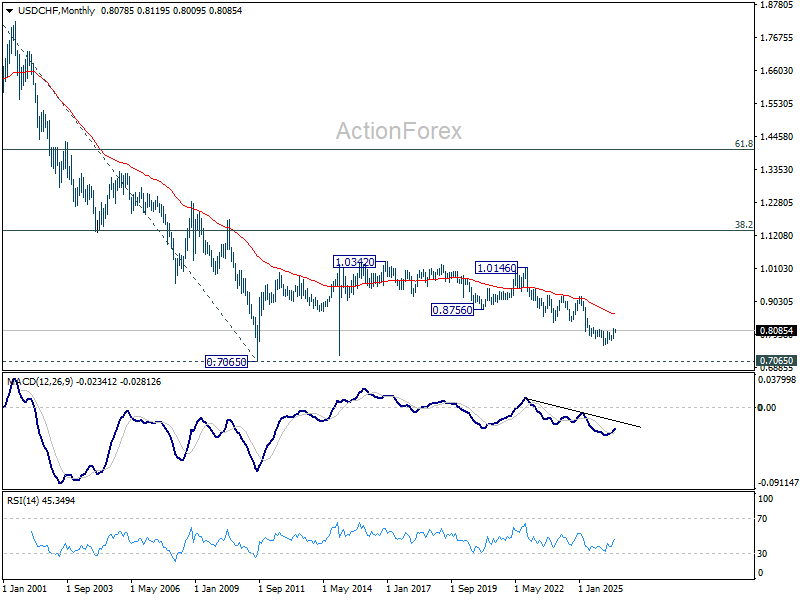
In the long term picture, price action from 0.7065 (2011 low) are seen as a corrective pattern to the multi-decade down trend from 1.8305 (2000 high). It's uncertain if the fall from 1.0342 is the second leg of the pattern, or resumption of the downtrend. But in either case, outlook will stay bearish as long as 0.8756 support turned resistance holds (2021 low). Retest of 0.7065 should be seen next.
AUD/USD Weekly Report
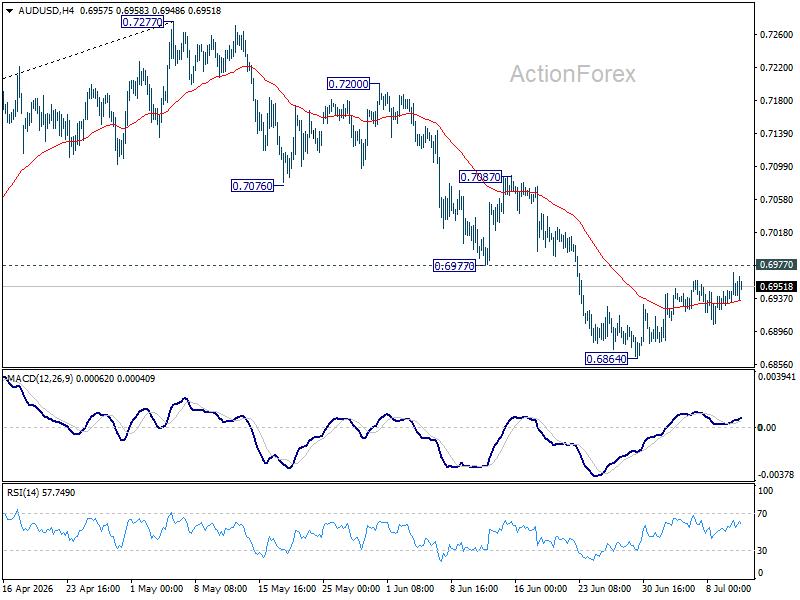
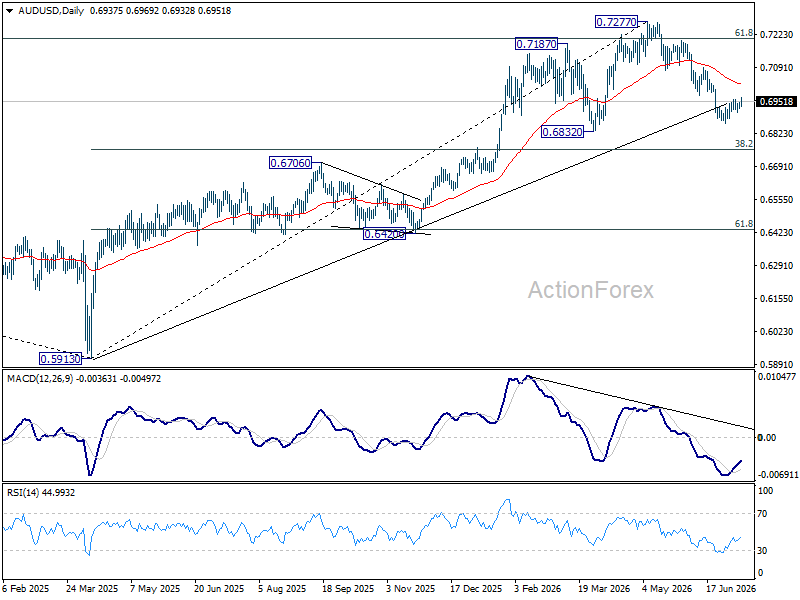
AUD/USD stayed in consolidations above 0.6864 last week and outlook is unchanged. Initial bias remains neutral this week first. Further fall is expected as long as 0.6977 support turned resistance holds. Below 0.6864 will target 0.6832 support. Firm break there will target 0.6756 fibonacci level. However, sustained break of 0.6977 will bring stronger rebound to 0.7087 resistance instead.
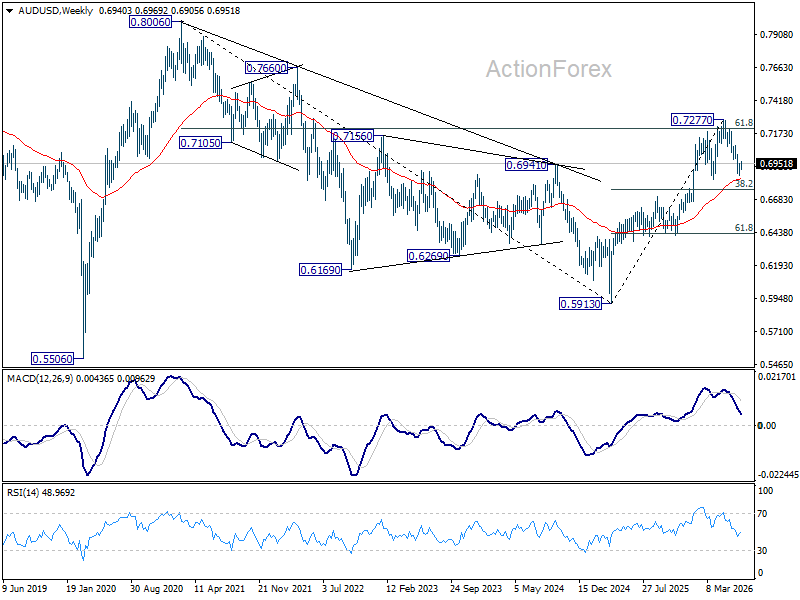
In the bigger picture, considering bearish divergence condition in D MACD, a medium term top could be formed at 0.7277 after failing to sustain above 61.8% retracement of 0.8006 (2021 high) to 0.5913 (2024 low) at 0.7206. Deeper fall could be seen to 38.2% retracement of 0.5913 to 0.7277 at 0.6756 as a correction. But strong support should be seen there to bring rebound. Consolidations would continue below 0.7277 for a while.
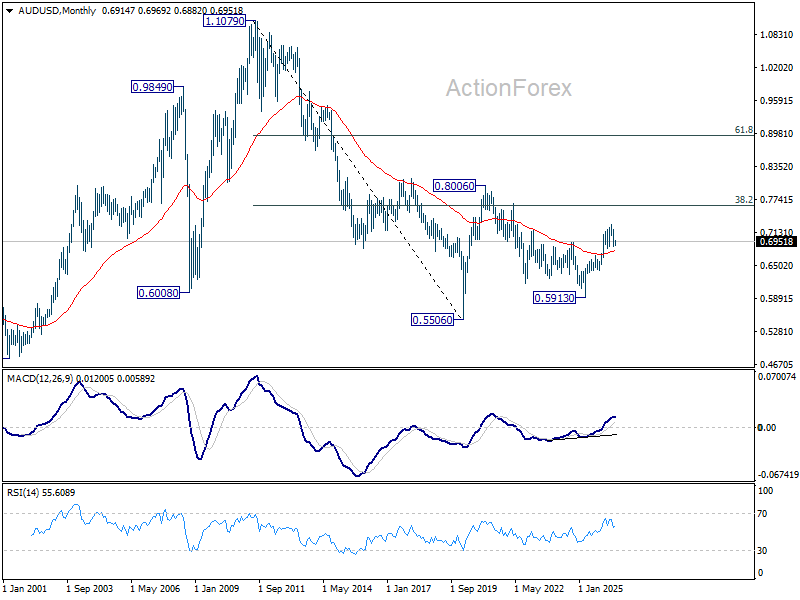
In the long term picture, rise from 0.5913 is seen as the third leg of the whole pattern from 0.5506 (2020 low). It's still early to judge if this is an impulsive or corrective pattern. But in either case, further rise should be seen back to 0.8006 and possibly above. This will remain the favored case as long as 55 W EMA (now at 0.6838) holds.
USD/CAD Weekly Outlook
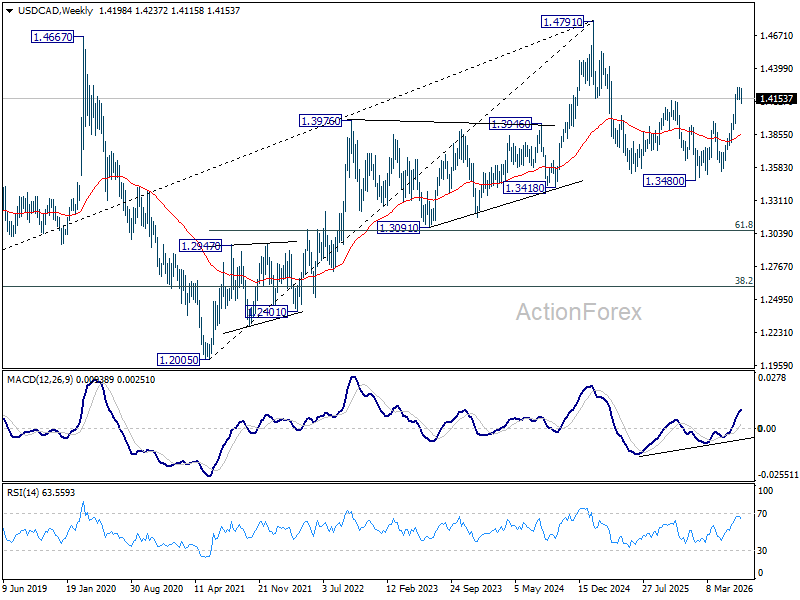
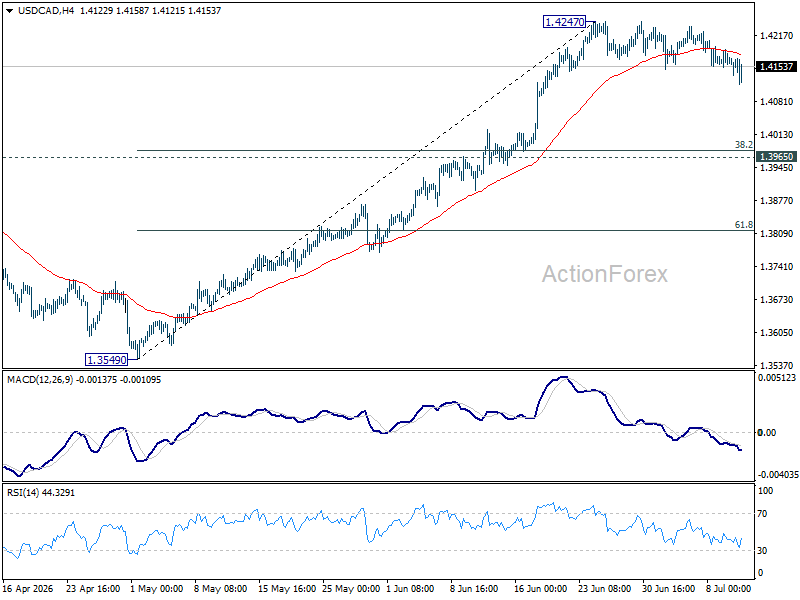
USD/CAD's consolidations from 1.4247 continued last week and outlook is unchanged. Initial bias remains neutral this week first. Deeper pullback cannot be ruled out. But downside should be contained above 1.3965 resistance turned support. Above 1.4247 will resume the rally from 1.3480 to 61.8% retracement of 1.4791 to 1.3480 at 1.4290. Firm break there will pave the way back to 1.4791 high.
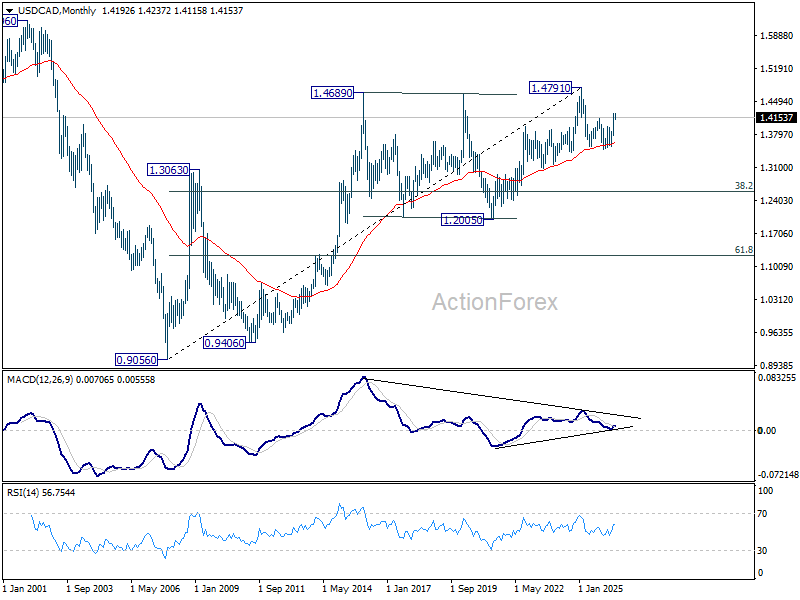
In the bigger picture, current development suggests that fall from 1.4791 has completed as a three wave correction to 1.3480. It's still early to judge if rise from there a corrective bounce, or resumption of the larger up trend from 1.2005 (2021 low). But in either case, retest of 1.4791 high should be seen next.
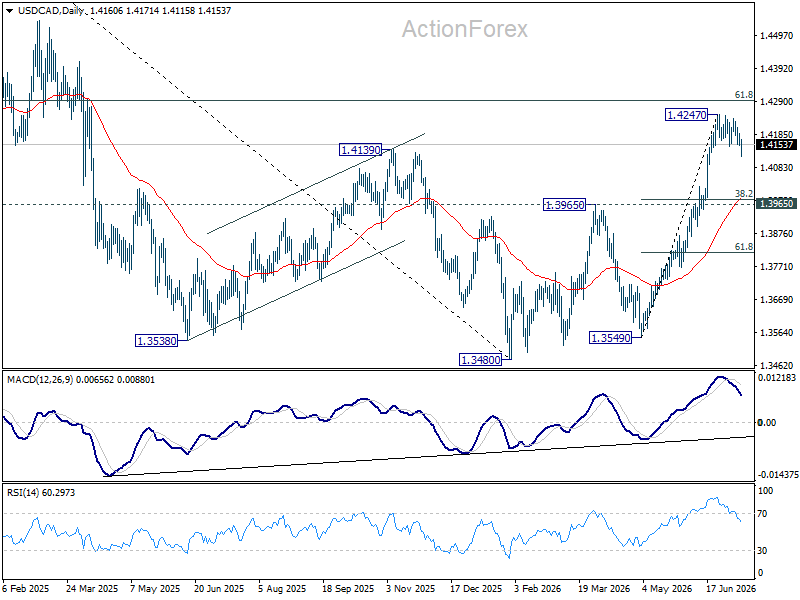
In the long term picture, rising 55 M EMA (now at 1.3631) remains intact. Thus, up trend from 0.9056 (2007 low) could still be in progress. However, considering bearish divergence condition M MACD, sustained trading below 55 M EMA will argue that the up trend has completed with five waves up to 1.4791, and turn medium term outlook bearish for correction to 38.2% retracement of 0.9056 to 1.4791 at 1.2600.