
Sample Category Title
USD/CAD Daily Outlook
Daily Pivots: (S1) 1.3103; (P) 1.3127; (R1) 1.3175; More...
Intraday bias in USD/CAD remains neutral for the moment. We're holding on to the view that consolidation from 1.3588 has completed at 1.3017. Break of 1.3598 will extend the whole choppy rise from 1.2460 to next fibonacci level at 1.3838 and possibly above. Meanwhile, sustained break of 1.3017 will invalidate our view and indicate that rise from 1.2460 has completed and turn outlook bearish for 1.2460.
In the bigger picture, price actions from 1.4689 medium term top are seen as a correction pattern. The first leg has completed at 1.2460. The second leg is still in progress and could target 61.8% retracement of 1.4689 to 1.2460 at 1.3838. As rise from 1.2460 is seen as a corrective move, we'd look for reversal signal above 1.3838. Meanwhile, break of 1.3017 will likely start the third leg to 1.2460 and below.
Subscribe to our daily and mid-day newsletter to get this report delivered to your mail box
Asian Market Update: Trump’s Executive Order On Immigration Sparks Protests And Investor Caution
Trump's executive order on immigration sparks protests and investor caution
Friday US markets on close: Dow flat, S&P500 -0.1%, Nasdaq +0.1%
Best Sector in S&P500: Healthcare
Worst Sector in S&P500: Basic Materials
Biggest gainers: WYNN +7.9; BCR +5.2%; GD +4.4%
Biggest losers: RHI -7.3%; GPS -5.4%; AAL -5.3%
At the close: VIX 10.6 (-0.1pts); Treasuries: 2-yr 1.21% (-1bps), 10-yr 2.48% (-3bps), 30-yr 3.06% (-3bps)
Weekend US/EU Corporate Headlines
XXIA: Keysight Technologies said to be close to finalizing acquisition of Ixia for over $1.6B - press
CSX: Said to be in settlement talks with former CP CEO Hunter Harrison and activist investor Mantle Ridge; May result in Harrison being named CEO - press
DHT: Receives non-binding proposal from Frontline Ltd at $5.09/shr; Adopts One-Year shareholder rights plan
VRX: CVC and Advent buyout firms said to be interested in certain Valeant assets, which could yield as much as $1B in a sale - press
FIT: To announce job cuts of 5-10% of workforce while reporting Q4 results that are below expectations - press
Politics
(US) Pres Trump: Immigration order is not a "Muslim ban"
(DE) German chancellor Merkel: Told US pres Trump that the fight against terrorism does not justify Muslim travel ban - press
(FR) According to the latest survey by Le Figaro, frontrunner Fillon has 21-22% approval rating ahead of first round of elections in April, while centrist Macron has 20-21%
(JP) Japan cabinet approval rating remains unchanged at 61% - Yomiuri
(US) State of California considering options to suspend financial transfers to Washington following threats from Trump administration to withhold funds from sanctuary cities - US press
Key economic data:
(NZ) NEW ZEALAND DEC TRADE BALANCE (NZ$): -41M (6TH STRAIGHT DEFICIT, smallest deficit in 6 months) V -98ME; 12-MONTH TRADE BALANCE: -3.20B V -3.20BE
(JP) JAPAN DEC RETAIL SALES M/M: -1.7% (biggest decline in 10 months) V -0.5%E; RETAIL TRADE Y/Y: 0.6% (2nd straight increase) V 1.7%E
Asia Session Notable Observations, Speakers and Press
Despite the Lunar New Year holiday in much of Asia, there was pronounced weakness in equity indices of Japan and Australia as well as safe haven bid for Treasuries and JPY. Investors are closely watching the fallout from US President Trump's immigration decree banning travel to the US by citizens of Iraq, Syria, Iran, Sudan, Libya, Somalia or Yemen, as well as a 120-day suspension of the US refugee program. The move sparked protests at airports across the US and words of disapproval from European leaders. Another US press report indicated the Trump administration may be headed for a showdown over money transfers with the State of California if it decides to pull funding from "sanctuary cities".
New Zealand put out its 6th straight trade deficit, though this was also its smallest in 6 months, with both exports and imports rising more than expected. Shipments to China were up 13%, while exports to Australia and US down in high single digits. Analysts noted the strong trade is not unusual this time of year given the external demand for agricultural products.
Ahead of tomorrow's BOJ decision, a Nikkei report speculated that the central bank will heed improving trade and consumption data with an increase in its accompanying projections for growth. Today's retail trade data for Japan were mixed, with 2nd straight annualized increase but also the biggest sequential decline in 10 months.
Japan:
(JP) BOJ expected to upgrade its GDP forecasts in this week's policy meeting - Nikkei
(JP) BOJ adviser Kawai: BoJ to avoid raising rates until inflation rises to about 2%
Australia/New Zealand:
(AU) Macquarie: Australia H1 corporate earnings growth to show "broad improvement" - press
(AU) NAB chief economist maintaining forecast for RBA to cut rates twice this year - Australian press
(NZ) JPMorgan: Latest narrowing of trade deficit is normal since agricultural exports rise into year-end - press
(NZ) RBNZ: Dec mortgage lending slowed to NZ$5.86B v NZ$6.00B y/y and NZ$6.35B m/m
Asian Equity Indices/Futures (00:00ET)
Nikkei -0.6%, Hang Seng closed, Shanghai Composite closed, ASX200 -0.9%, Kospi closed
Equity Futures: S&P500 -0.3%; Nasdaq -0.3%, Dax -0.3%, FTSE100 -0.2%
FX ranges/Commodities/Fixed Income (00:00ET)
EUR 1.0705-1.0740; JPY 114.25-114.95; AUD 0.7550-0.7560; NZD 0.7260-0.7275; GBP 1.2560-1.2600
Feb Gold +0.4% at 1,196/oz; Mar Crude Oil -0.4% at $52.96/brl; Mar Copper -0.2% at $2.69/lb
SLV iShares Silver Trust ETF daily holdings rise to 10,444 tonnes from 10,420 tonnes prior; first rise since Dec 2016
(SA) Saudi Aramco said to consider investment of as much as $5B in renewable energy to diversify away from crude oil production - press
(JP) Japan MoF sells ¥2.09T v ¥2.3T indicated in 2-yr 0.1% JGBs; Avg yield: -0.173 v -0.157% prior; bid to cover: 5.19 (highest since May) v 4.51x prior
Asia equities / Notables / movers
Consumer discretionary: 4185.JP JSR Corp -3.3% (9-month result speculation); 9201.JP Japan Airlines Corp -0.6% (9-month result speculation); 6770.JP Alps Electric Co +2.5% (9-month result); 7278.JP Exedy Corp -5.9% (9-month result)
Consumer staples: WCB.AU Warrnambool Cheese & Butter +23.8% (acquisition); WOW.AU Woolworths Limited -0.9% (Morningstar cuts rating)
Financials: QBE.AU QBE Insurance Group +1.4% (not in discussion with any buyer); SRV.AU Servcorp Ltd -19.5% (adjusts guidance); 3003.JP Hulic Co +4.5% (FY16 result); 8316.JP Sumitomo Mitsui Financial Group -1.9% (9-month result)
Industrials: AJX.AU Alexium International Group +2.2% (Q3 result); 7729.JP Tokyo Seimitsu -1.2% (9-month result speculation); 7211.JP Mitsubishi Motors -0.6% (outlook speculation)
Technology: ACX.AU Aconex -41.9% (cuts guidance); 6502.JP Toshiba Corporation -4.7% (some trust banks are preparing a lawsuit); 6816.JP Alpine Electronics +4.9% (9-month result); 8036.JP Hitachi High-Technologies +5.1% (9-month result)
Materials: ORE.AU Orocobre -6.1% (Q4 result); PRU.AU Perseus Mining -5.0% (Q4 result); BDR.AU Beadell Resources +1.7% (Q4 result); OZL.AU OZ Minerals -0.8% (Q4 result); 5727.JP Toho Titanium +10.6% (9-month result); 4063.JP Shin-Etsu Chemical Co -1.1% (9-month result)
Sentiments Weighed Down as Trump’s Immigration Ban Develops into Chaos
Asian markets trade lower as the week starts on concerns of unrests and geopolitical tensions caused by US president Donald Trump's executive order regarding immigration ban. Trump signed an executive order last Friday, suspending entry of people from seven Muslim-majority countries for 90 days and suspending the refugee program for 120 days. The situation has then developed into a chaotic one as a federal judge in Brooklyn temporarily blocked part of the executive order. And there were waves of protests with ten of thousands of people rallied in US cities to voice the opposition of the order. The uncertainties over the situation weighed down on market sentiments As Nikkei lost -0.51%. In the currency markets, Dollar trades broadly lower except versus Kiwi. Yen surges on risk aversion. The uncertainties might take some time to clear.
On the data front, New Zealand trade deficit narrowed to NZD -41m in December. Japan retail sales rose 0.6% yoy in December, below expectation of 1.6% yoy. Swiss KOF leading indicator will be featured in European session. Eurozone will also release confidence indicators and German CPI. US personal income and spending will be the main focus of the day. In particular, core PCE is expected to accelerate to 1.7% yoy in December. And upside surprise there will solidify the case for Fed to hike rates three times this year. US will also release pending home sales.
Looking ahead, one focus of the week is the 2-day FOMC meeting on January 31 and February 1. We do not expect any change in the policy rate as a rate hike was announced in December. Yet, we would focus on the central bank's tone on the economic outlook after Donald Trump's inauguration and his signing of a number of executive orders. In addition, US will release ISM indices and non-farm payroll report.
The BoE meeting scheduled on Thursday is also closely watched. We expect policymakers to stay cautious as PM Theresa May indicated a hard Brexit earlier this month. In addition, BoE will release the latest inflation report. Upgrade in growth and inflation forecast could give Sterling a lift. BOJ meeting would be held on Tuesday. Yet, we expect it would be a non-event as the central bank has announced to increase purchases of 5-10 years bonds to JPY 450b, from JPY 410b previously, last week.
Here are some highlights for the week ahead:
- Tuesday: BoJ, Japan household spending, unemployment rate, industrial production; Australia NAB business confidence; France GDP, German retail sales, unemployment, Eurozone CPI, GDP, unemployment rate; UK mortgage approvals; Canada GDP, IPPI and RMPI; US employment cost index, S&P Case Shiller house price, Chicago PMI, consumer confidence
- Wednesday: New Zealand employment; China PMI manufacturing; UK PMI manufacturing; Eurozone PMI manufacturing final; US ADP employment, ISM manufacturing, FOMC rate decision
- Thursday: Australia building approvals, trade balance; Japan consumer confidence; Swiss retail sales; UK construction PMI, BoE rate decision and inflation report; Eurozone PPI; US jobless claims, non-farm productivity
- Friday: China Caixin PMI manufacturing; Eurozone PMI services final, retail sales; UK PMI services; US non-farm payroll, ISM non-manufacturing, factory orders
USD/CAD Daily Outlook
Daily Pivots: (S1) 1.3103; (P) 1.3127; (R1) 1.3175; More...
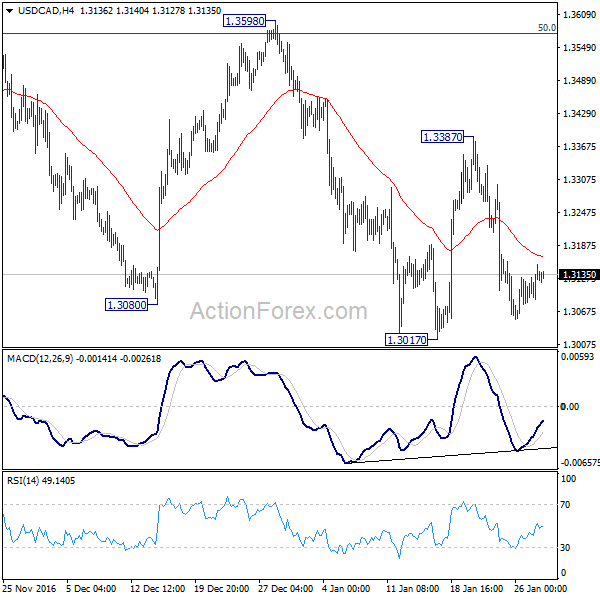
Intraday bias in USD/CAD remains neutral for the moment. We're holding on to the view that consolidation from 1.3588 has completed at 1.3017. Break of 1.3598 will extend the whole choppy rise from 1.2460 to next fibonacci level at 1.3838 and possibly above. Meanwhile, sustained break of 1.3017 will invalidate our view and indicate that rise from 1.2460 has completed and turn outlook bearish for 1.2460.
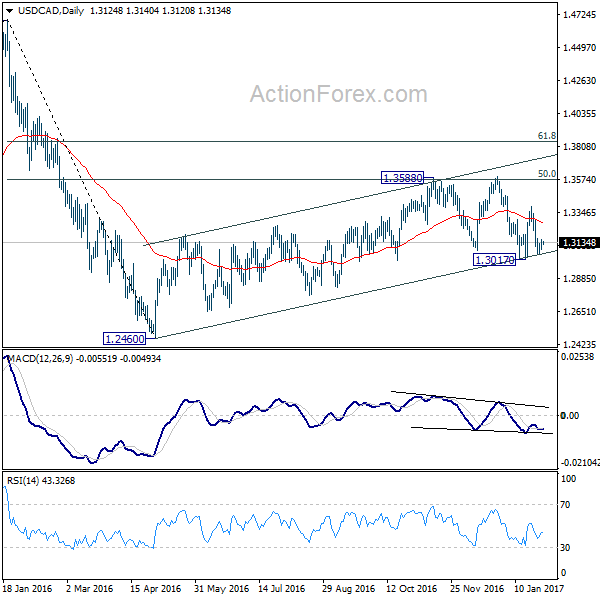
In the bigger picture, price actions from 1.4689 medium term top are seen as a correction pattern. The first leg has completed at 1.2460. The second leg is still in progress and could target 61.8% retracement of 1.4689 to 1.2460 at 1.3838. As rise from 1.2460 is seen as a corrective move, we'd look for reversal signal above 1.3838. Meanwhile, break of 1.3017 will likely start the third leg to 1.2460 and below.
Economic Indicators Update
| GMT | Ccy | Events | Actual | Consensus | Previous | Revised |
|---|---|---|---|---|---|---|
| 21:45 | NZD | Trade Balance (NZD) Dec | -41M | -95M | -705M | -746M |
| 23:50 | JPY | Retail Trade Y/Y Dec | 0.60% | 1.60% | 1.70% | |
| 8:00 | CHF | KOF Leading Indicator Jan | 102.9 | 102.2 | ||
| 10:00 | EUR | Eurozone Business Climate Indicator Jan | 0.8 | 0.79 | ||
| 10:00 | EUR | Eurozone Economic Confidence Jan | 107.8 | 107.8 | ||
| 10:00 | EUR | Eurozone Industrial Confidence Jan | 0.2 | 0.1 | ||
| 10:00 | EUR | Eurozone Services Confidence Jan | 12.7 | 12.9 | ||
| 10:00 | EUR | Eurozone Consumer Confidence Jan F | -4.9 | -4.9 | ||
| 13:00 | EUR | German CPI M/M Jan P | -0.50% | 0.70% | ||
| 13:00 | EUR | German CPI Y/Y Jan P | 2.00% | 1.70% | ||
| 13:30 | USD | Personal Income Dec | 0.40% | 0.00% | ||
| 13:30 | USD | Personal Spending Dec | 0.50% | 0.20% | ||
| 13:30 | USD | PCE Deflator M/M Dec | 0.20% | 0.00% | ||
| 13:30 | USD | PCE Deflator Y/Y Dec | 1.70% | 1.40% | ||
| 13:30 | USD | PCE Core M/M Dec | 0.10% | 0.00% | ||
| 13:30 | USD | PCE Core Y/Y Dec | 1.70% | 1.60% | ||
| 15:00 | USD | Pending Home Sales M/M Dec | 1.10% | -2.50% |
Subscribe to our daily and mid-day newsletter to get this report delivered to your mail box
AUD/USD: Aussie Trading A Tad Lower In The Morning Session
For the 24 hours to 23:00 GMT, the AUD rose 0.35% against the USD and closed at 0.7551 on Friday.
LME Copper prices declined 0.7% or $43.0/MT to $5847.0/MT. Aluminium prices declined 0.5% or $10.0/MT to $1827.5/MT.
In the Asian session, at GMT0400, the pair is trading at 0.7548, with the AUD trading marginally lower against the USD from Friday's close.
The pair is expected to find support at 0.7513, and a fall through could take it to the next support level of 0.7477. The pair is expected to find its first resistance at 0.7578, and a rise through could take it to the next resistance level of 0.7607.
Moving ahead, Australia's NAB business confidence index for December, scheduled to release in the early hours of tomorrow, will be on investor's radar.
The currency pair is showing convergence with its 20 Hr and 50 Hr moving averages.

EUR/USD: Euro Trading Higher In The Asian Session, Ahead Of Germany’s Inflation Data
For the 24 hours to 23:00 GMT, the EUR rose 0.19% against the USD and closed at 1.0697 on Friday.
On the data front, Germany's import price index climbed 1.9% on a monthly basis in December, compared to an advance of 0.7% in the prior month, while markets were expecting the index to rise 1.3%.
Macroeconomic data indicated that the US flash annualised gross domestic product (GDP) expanded less-than-expected by 1.9% QoQ in 4Q 2016, pressured by a wider trade deficit. Meanwhile, markets expected the nation's GDP to advance 2.2%, following a rise of 3.5% in the prior quarter. Additionally, the nation's preliminary durable goods orders unexpectedly dropped 0.4% in December, dragged by a steep drop in demand for defence-related goods. Markets anticipated durable goods orders to gain 2.5%, following a decline of 4.5% in the previous month. On the other hand, the nation's final Reuters/Michigan consumer sentiment index surprisingly jumped to a level of 98.5 in January, surging to a 13-year high level, as consumers remained more optimistic about the nation's economy and job growth. Investors had envisaged the index to remain steady at a level of 98.1, recorded in the preliminary print and after registering a reading of 98.2 in the previous month.
In the Asian session, at GMT0400, the pair is trading at 1.0730, with the EUR trading 0.31% higher against the USD from Friday's close.
The pair is expected to find support at 1.0677, and a fall through could take it to the next support level of 1.0625. The pair is expected to find its first resistance at 1.0761, and a rise through could take it to the next resistance level of 1.0793.
Trading trend in the Euro today is expected to be determined by Germany's flash consumer price index for January, scheduled to release later in the day. Also, the Euro-zone's final consumer confidence index for January, due to release in a few hours, will be keenly watched by investors. Elsewhere, in the US, traders will eye pending home sales, personal income and spending data, all for December, scheduled to release later in the day.
The currency pair is trading above its 20 Hr and 50 Hr moving averages.

GBP/USD: Pound Trading On A Stronger Footing This Morning
For the 24 hours to 23:00 GMT, the GBP declined 0.25% against the USD and closed at 1.2558 on Friday.
In the Asian session, at GMT0400, the pair is trading at 1.2580, with the GBP trading 0.18% higher against the USD from Friday’s close.
The pair is expected to find support at 1.2529, and a fall through could take it to the next support level of 1.2479. The pair is expected to find its first resistance at 1.2615, and a rise through could take it to the next resistance level of 1.2651.
Going ahead, investors look forward to UK’s GfK consumer confidence index for January, scheduled to release overnight.
The currency pair is trading above its 20 Hr moving average and showing convergence with its 50 Hr moving average.

USD/JPY: Japan’s Retail Trade Fell In December
For the 24 hours to 23:00 GMT, the USD rose 0.48% against the JPY and closed at 115.03 on Friday.
In the Asian session, at GMT0400, the pair is trading at 114.39, with the USD trading 0.56% lower against the JPY from Friday's close.
Overnight data showed that Japan's seasonally adjusted retail trade eased more-than-expected by 1.7% MoM in December, compared to market expectations for a fall of 0.5% and following a gain of 0.2% in the preceding month. Further, the nation's larger retailers' sales declined 1.3% in December, higher than market consensus for a drop of 1.0% and after registering a fall of 0.3% in the preceding month.
The pair is expected to find support at 113.96, and a fall through could take it to the next support level of 113.54. The pair is expected to find its first resistance at 115.09, and a rise through could take it to the next resistance level of 115.80.
Moving ahead, investors will closely monitor Japan's jobless rate and flash industrial production data, both for December, scheduled to release overnight.
The currency pair is trading below its 20 Hr and 50 Hr moving averages.

USD/CHF: Swiss Franc Trading Higher, Ahead Of Switzerland’s KOF Leading Indicator Data
For the 24 hours to 23:00 GMT, the USD declined 0.11% against the CHF and closed at 0.9986 on Friday.
In the Asian session, at GMT0400, the pair is trading at 0.9964, with the USD trading 0.22% lower against the CHF from Friday's close.
The pair is expected to find support at 0.9938, and a fall through could take it to the next support level of 0.9911. The pair is expected to find its first resistance at 1.0009, and a rise through could take it to the next resistance level of 1.0053.
Ahead in the day, traders will focus on Switzerland's KOF leading indicator for January and total sight deposits for the last week.
The currency pair is trading below its 20 Hr and 50 Hr moving averages.

USD/CAD: Loonie Trading Marginally Higher In The Asian Session
For the 24 hours to 23:00 GMT, the USD rose 0.31% against the CAD and closed at 1.3132 on Friday.
In the Asian session, at GMT0400, the pair is trading at 1.3130, with the USD trading a tad lower against the CAD from Friday’s close.
The pair is expected to find support at 1.3094, and a fall through could take it to the next support level of 1.3059. The pair is expected to find its first resistance at 1.3158, and a rise through could take it to the next resistance level of 1.3187.
With no economic releases in Canada today, investor sentiment will be governed by global macroeconomic factors.
The currency pair is showing convergence with its 20 Hr moving average and trading above its 50 Hr moving average.

Weekly Technical Outlook And Review
A note on lower timeframe confirming price action…
Waiting for lower timeframe confirmation is our main tool to confirm strength within higher timeframe zones, and has really been the key to our trading success. It takes a little time to understand the subtle nuances, however, as each trade is never the same, but once you master the rhythm so to speak, you will be saved from countless unnecessary losing trades. The following is a list of what we look for:
- A break/retest of supply or demand dependent on which way you're trading.
- A trendline break/retest.
- Buying/selling tails – essentially we look for a cluster of very obvious spikes off of lower timeframe support and resistance levels within the higher timeframe zone.
- Candlestick patterns. We tend to only stick with pin bars and engulfing bars as these have proven to be the most effective.
EUR/USD
Weekly gain/loss: – 8 pips
Weekly closing price: 1.0690
Weekly opening price: 1.0721
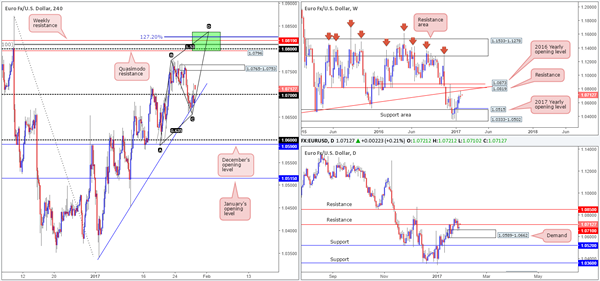
Despite the pair ranging over 100 pips last week, EUR/USD prices are little changed. What is notable from a technical perspective, nevertheless, is the reaction seen from the long-term weekly trendline resistance (stretched from the low 0.8231), which consequently formed a strong-looking weekly selling wick. Providing that the bears remain in the driving seat here, the next downside objective on the weekly timeframe comes in at 1.0333-1.0502: a weekly support area that's positioned directly below the 2017 yearly opening level at 1.0515.
While the weekly bears look to be in a good place right now, daily demand at 1.0589-1.0662 was brought into the picture on Thursday and remained balanced going into the week's close. Be that as it may, it will take a decisive (daily) close above the nearby daily resistance at 1.0710 before our desk reports that the bulls may be gaining the upper hand.
A quick recap of Friday's trade on the H4 shows that the bulls attempted to breach the 1.07 handle, following a lower-than-expected US advance GDP report. However, as you can see, price failed to sustain gains beyond this point and ended the day back below 1.07.
Our suggestions: In a nutshell, the nuts and bolts of this pair's structure can be summed up as follows:
- Weekly action suggesting lower prices ahead.
- Daily flow reacting from demand, but has yet to prove itself by closing above neighboring daily resistance at 1.0710.
Taking into account that the this morning's open gapped over 30 pips north this morning, bringing price back above the 1.07 boundary, we'll likely see 1.07 tested as support in the next hour as the weekend gap looks to be filled. Levels of interest above 1.07 today are the H4 supply at 1.0765-1.0753 and the H4 Quasimodo resistance at 1.0796.
One could look for an intraday bounce from the H4 supply today, but be aware that the more attractive area for sells is seen around the H4 Quasimodo. Backing this level we have the 1.08 handle, a deep H4 88.6% Fib resistance at 1.0810, weekly resistance at 1.0819 (sits just above the aforementioned weekly trendline resistance) and finally there's also a possible H4 AB=CD bearish pattern that tops out around 1.0838 which sports a converging 127.2% Fib extension.
With the above points in mind, buying right now is something we'd feel comfortable participating in. Neither would we feel all that great above selling from the aforementioned H4 supply. We will, nevertheless, keep a close eye on the above noted 1.08 region due to its connection with the higher timeframes.
Data points to consider: German prelim CPI. US personal spending and income (PCE index) figures set for release at 1.30pm and pending home sales at 3pm GMT.
Levels to watch/live orders:
- Buys: Flat (stop loss: N/A).
- Sells: 1.08 region ([possible area to look at selling from without the need for additional confirmation] stop loss: 1.0840).
GBP/USD:
Weekly gain/loss: + 170 pips
Weekly closing price: 1.2543
Weekly opening price: 1.2581
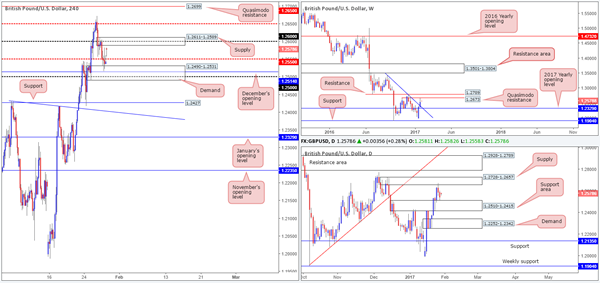
Following the prior week's bullish engulfing candle that formed just ahead of weekly support at 1.1904, the pair drove north last week. Munching through a weekly trendline resistance (now acting support) taken from the high 1.3445, we can see that price ended the week crossing swords with a weekly Quasimodo resistance level at 1.2673, and printed a moderate end-of-week correction.
As is evident from the daily chart, daily supply at 1.2728-1.2657 bolstered last week's correction off the weekly Quasimodo. Before we all begin searching for the sell button mind you, traders may want to note that the daily candles also closed the week a few pips ahead of a daily support area coming in at 1.2510-1.2415. A breakdown through this zone would place the daily demand base at 1.2252-1.2342 in sight, and this, as you can probably see, beautifully converges with the above noted weekly trendline support and the 2017 yearly opening level at 1.2329.
The unit, as can be seen on the H4 chart, gapped close to 40 pips north at this morning's open, lifting price above the H4 mid-way resistance at 1.2550. This comes after a rather sluggish Friday (despite the US reporting a weak 4th quarter Advance GDP) where the candles remained capped between the above noted mid-level number and a H4 demand zone penciled in at 1.2490-1.2531.
Our suggestions: As of this moment, we do not see much to hang our hat on. H4 supply at 1.2611-1.2589, which encapsulates the 1.26 handle, may be something to pay attention to given where the weekly flow is currently positioned (see above). However, trading here without waiting for further confirmation is risky (see the top of this report for ideas on how to confirm an area using price action), since price will likely want to tag the H4 mid-way resistance point at 1.2650 due to the daily supply mentioned above at 1.2728-1.2657.
The better area, in our view, comes in at 1.2699: a H4 Quasimodo resistance that fuses beautifully with the 1.27 handle and is housed within the said daily supply as well as sitting only 25 or so pips above the aforementioned weekly Quasimodo resistance.
Data points to consider: US personal spending and income (PCE index) figures set for release at 1.30pm and pending home sales at 3pm GMT.
Levels to watch/live orders:
- Buys: Flat (stop loss: N/A).
- Sells: 1.2611-1.2589 ([wait for a lower-timeframe confirming setup to form before looking to execute a trade] stop loss: dependent on where one confirms this area). 1.27 region ([possible area to look at selling from without the need for additional confirmation] stop loss: 1.2730 – 2 pips above daily supply).
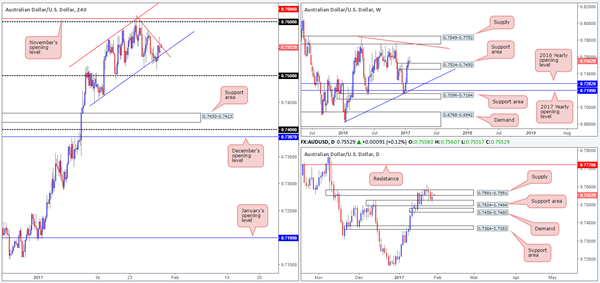
AUD/USD:
Weekly gain/loss: – 8 pips
Weekly closing price: 0.7543
Weekly opening price: 0.7558
After witnessing four uninterrupted weekly bullish candles take shape, the commodity currency finished last week marginally in the red. While this may be true, the weekly support area at 0.7524-0.7450 is very much in play and could effectively force the unit higher this week. The next notable zone to the upside falls in at 0.7849-0.7752: a weekly supply area that merges with a weekly trendline resistance coming in from the high 0.7835. On a side note, zooming out one can also see a possible large-scale weekly bearish pennant forming between two converging weekly trendlines (0.6827/0.7835).
Strengthening the aforementioned weekly support area is a daily support area drawn in at 0.7524-0.7494 that held firm from Wednesday onwards last week. From this, we agree that the pendulum does indeed look to be swinging toward a rally higher. We would, nonetheless, prefer to see the nearby daily supply zone at 0.7581-0.7551 engulfed beforehand. The next area of importance beyond here sits at 0.7720, conveniently located 30 or so pips below the above mentioned weekly supply area.
Buoyed by Friday's disappointing 4th quarter Advance GDP print from the US, the H4 candles managed to recover relatively quickly after breaking through the H4 channel support line taken from the low 0.7449. Yet, in spite of this, the bulls failed to maintain this pressure beyond the immediate H4 trendline resistance extended from the high 0.7603.
Our suggestions: In the event that a H4 bullish close is seen above the current H4 trendline resistance, an intraday long up to the 0.76 handle and its partner level (the December open at 0.7606) could be an option. It would only be once daily price has CLOSED above daily supply at 0.7581-0.7551, would we advise looking to go long on a break above 0.76/0.7606, preferably on a confirmed retest as support (see the top of this report for info on confirmation).
Data points to consider: RBA Assistant Gov. Debelle speaks at 7.45am. US personal spending and income (PCE index) figures set for release at 1.30pm and pending home sales at 3pm GMT.
Levels to watch/live orders:
- Buys: A break above/retest of the H4 trendline resistance could signal a potential long opportunity ([wait for a lower-timeframe confirming setup to form following the retest before looking to execute a trade] stop loss: dependent on where one confirms this area).
- Sells: Flat (stop loss: N/A).
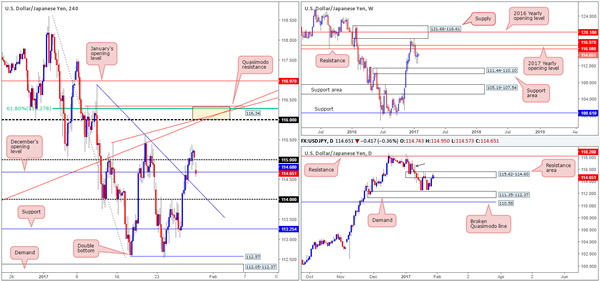
USD/JPY:
Weekly gain/loss: + 50 pips
Weekly closing price: 115.06
Weekly opening price: 114.74
Over the last week, we can see that weekly price chalked in its second consecutive weekly bullish tail and now looks to be heading north to shake hands with weekly resistance at 116.08, followed closely by the 2017 yearly opening level at 116.97. With that being said, the weekly buyers will have to contend with daily sellers at a daily resistance area drawn in from 115.62-114.60 beforehand. Supposing that a daily close above this zone is seen, there's little, as far as we can see on this timeframe, standing in the way of price challenging daily resistance at 118.20. The daily wick marked with a black arrow at 116.87 is, what we like to call, a supply consumption wick. It simply means that we believe this wick consumed the majority of supply above the current daily resistance area.
Weighed on heavily by Friday's poor GDP print from the US, the USD/JPY struggled to advance from the 115 handle. The pair, however, started this week at 114.74, 32 pips lower than Friday's closing point, resulting in price testing December's opening level at 114.68. Attempting to go long from this monthly level would not be something we'd encourage. Not only is the 115 handle sitting a few pips above here, there's also the fact that the daily candles remain within a daily resistance area at present (see above)!
Our suggestions: While a long from current price is discouraged, a H4 close above the 115 barrier would be attractive. This – coupled with a daily close above the daily resistance area would very likely open the trapdoor up to 116, which as we're sure you already know, sits just 8 pips below the weekly resistance discussed above.
116 would not only make for a strong take-profit zone, but it is also a base in which shorts could be considered. Building a case for entry here we have the following: two H4 trendline resistances (115.44/112.86), a H4 61.8% Fib resistance at 116.27 and a H4 Quasimodo resistance at 116.34.
Data points to consider: US personal spending and income (PCE index) figures set for release at 1.30pm and pending home sales at 3pm GMT.
Levels to watch/live orders:
- Buys: Watch for a H4 close to be seen above the 115 threshold and then look to trade any retest seen thereafter ([wait for a lower-timeframe confirming setup to form [see the top of this report] following the retest before looking to execute a trade] stop loss: dependent on where one confirms this area).
- Sells: 116.34/116 ([possible area to look at selling from without the need for additional confirmation] stop loss: 116.36).
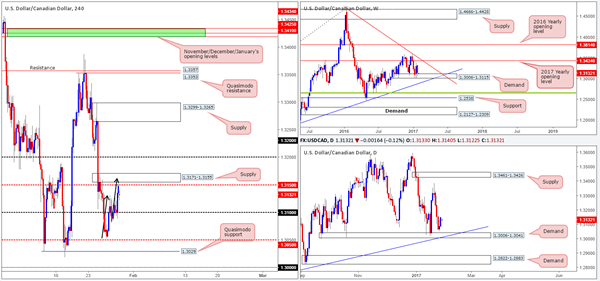
USD/CAD:
Weekly gain/loss: – 160 pips
Weekly closing price: 1.3148
Weekly opening price: 1.3133
Last week's sharp run to the downside erased the bulk of the prior week's gains, but did, however, succeed in holding firm above the weekly demand area at 1.3006-1.3115. Ahead of this angle is the 2017 yearly opening level at 1.3434 which blends with a weekly trendline resistance taken from the high 1.4689. Directly below, nonetheless, sits a weekly trendline support extended from the high 1.1278.
Bolstering the current weekly demand zone is a daily demand coming in at 1.3006-1.3041 (located around the lower edge of the above noted weekly demand) that happens to fuse with a daily trendline support taken from the low 1.2654.
On the back of Friday's decline in crude oil prices, the USD/CAD gravitated north following a successful retest off 1.31, concluding the trading week by tapping the underside of a H4 mid-way resistance at 1.3150. Playing the long card today could be tricky given this H4 level and the nearby H4 supply at 1.3171-1.3155. There is also a H4 AB=CD approach forming (see black arrows) which does in fact terminate within the said H4 supply around the 1.3161 neighborhood. Therefore, a reaction may very well be seen from here this week.
Our suggestions: Although the H4 supply boasts a reasonable amount of confluence, there's little support coming in from the bigger picture. As a result, waiting for the lower timeframes to prove seller interest exists before pulling the trigger may be the better path to take if one is interested in selling from here (see the top of this report for info on how to enter using lower-timeframe structure).
Data points to consider: US personal spending and income (PCE index) figures set for release at 1.30pm and pending home sales at 3pm GMT.
Levels to watch/live orders:
- Buys: 1.3029 region ([a reasonably sized H4 bull candle will need to be seen from here before a trade can be executed] stop loss: ideally beyond the trigger candle).
- Sells: Flat (stop loss: N/A).
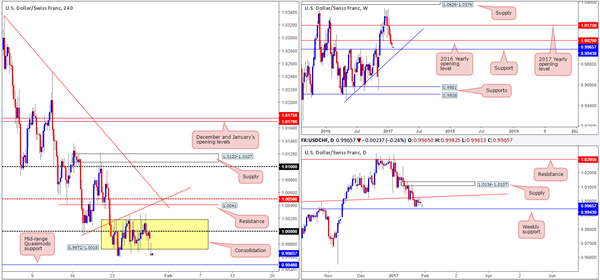
USD/CHF
Since the beginning of the week, the H4 candles have been chiseling out a H4 consolidation zone fixed at 0.9972/1.0018, which, as you can see, also houses parity (1.0000). Beyond the top edge of this range sits a H4 resistance at 1.0041, shadowed closely by the H4 mid-way resistance at 1.0050. A breakout south of this consolidation, however, will place the H4 mid-range Quasimodo support at 0.9948 in the firing range.
Over on the weekly chart, price is seen hovering just ahead of the 2016 yearly opening level at 1.0029. Providing that this line is stable, the next area of interest can be seen at 0.9943: a weekly support level positioned just a few pips beneath the above said H4 mid-range Quasimodo support. Turning our attention to the daily candles, the daily trendline resistance taken from the high 0.9956 continues to cap upside, which could eventually lead to a decline down to the aforementioned weekly support level.
Our suggestions: Should the market decide to pierce through the lower edge of the current H4 consolidation today, one could look to enter long at the mid-range H4 Quasimodo support level at market (given its relationship with weekly price) since stops can comfortably be placed beyond the apex low (0.9929) at 0.9927.
In addition to this, shorts could also be considered from the H4 resistance 1.0041, as it's located nearby both the 2016 yearly opening level and daily trendline resistance. Be that as it may, there's a good chance that price could whipsaw through this H4 level and quite possibly the H4 1.0050 level as well. With that, we would not advise entering at market from here. Instead, wait for a lower-timeframe confirming sell setup to form. This could be either a break of demand followed by a retest as supply, a trendline break/retest or simply a collection of well-defined selling wicks seen positioned around the H4 level. We typically search for lower-timeframe confirmation between the M15 and H1 timeframes, since most of our higher-timeframe areas begin with the H4. Stops are usually placed 3-5 pips beyond confirming structures.
Data points to consider: 4th quarter Advance GDP print from the US, along with US durable goods orders at 1.30pm GMT.
Levels to watch/live orders:
- Buys: 0.9949 ([possible level to look at buying from without the need for additional confirmation] stop loss: 0.9927).
- Sells: Flat (stop loss: N/A).
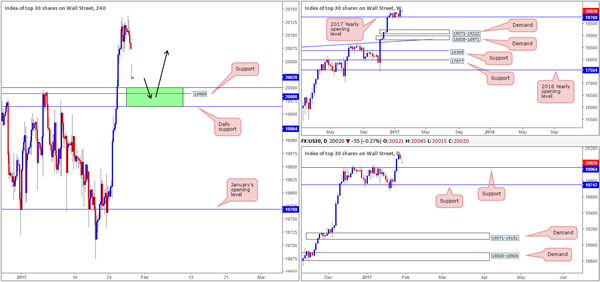
DOW 30:
Weekly gain/loss: + 257 points
Weekly closing price: 20075
Weekly opening price: 20021
After spending over a month hovering below the 20000 mark, US equities rose beyond this number last week finishing off tapping a high of 20138! In view of this, there are absolutely no resistance levels in this market right now. Therefore, to our way of seeing things, the best we can do for the time being is look to ‘buy the dips'.
As you can see on both the daily and H4 charts, the DOW gapped over 50 points south this morning, planting the market within reaching distance of the 20000 mark, the H4 support at 19989 and the daily support hurdle coming in at 19964.
Our suggestions: Between 19964 and 20000 (green area on the H4 chart) is a zone where we expect stocks to correct from today should price reach this low. Waiting for at least a H4 bull candle to form within the walls of this zone would, in our humble opinion, be the safer, and quite frankly, more logical route to take if one is contemplating a buy from here. As for targets, we would personally be looking to join the trend here and hold medium/long term. However, looking to reduce risk to breakeven and take partial profits off the table once the weekend gap has been filled is something we'll very likely look to implement.
Data points to consider: US personal spending and income (PCE index) figures set for release at 1.30pm and pending home sales at 3pm GMT.
Levels to watch/live orders:
- Buys: 19964/20000 ([wait for a H4 bull candle to form before looking to execute a trade] stop loss: ideally beyond the trigger candle).
- Sells: Flat (stop loss: N/A).
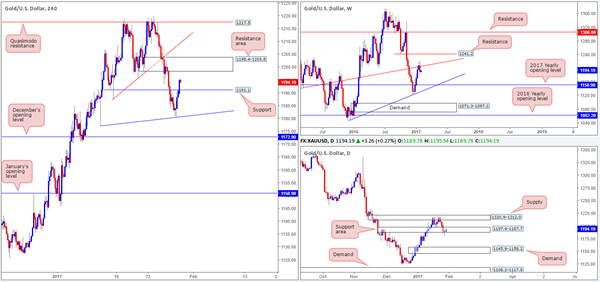
GOLD
Weekly gain/loss: – $17.5
Weekly closing price: 1190.9
Weekly opening price: 1189.7
Managing to break a four-week bullish phase, last week's action printed a strong-looking weekly bearish engulfing candle around the weekly trendline resistance taken from the low 1130.1. On the condition that the bears are able to maintain this momentum this week, it's possible that we could see further downside given that the next support target does not come into view until the 2017 yearly opening level at 1150.9.
The story on the daily chart shows that Friday's session chalked in a picture-perfect buying tail that pierced through the lower edge of a daily support area at 1197.4-1187.7. This could, despite what we've noted on the weekly timeframe, encourage buyers into the market today/early this week, and potentially pull prices up to daily supply fixed at 1220.9-1212.0.
The H4 candles, however, have begun the week strongly, already breaking through a ceiling of offers around a H4 resistance level at 1191.1. Right now, there's very little seen stopping price from connecting with the H4 resistance area registered at 1198.4-1203.8.
Our suggestions: As of this moment, we do not see much on offer. Yes, we could look to short from the aforementioned H4 resistance base, but risk an unnecessary loss, since although we'd be selling alongside weekly flow, we'd also be selling into potential daily buyers (see above). As such, our team's position will remain flat going into today's segment.
Levels to watch/live orders:
- Buys: Flat (stop loss: N/A).
- Sells: Flat (stop loss: N/A).