
Sample Category Title
European Open Briefing
Global Markets:
- Asian stock markets: Nikkei down 0.65 %, ASX 200 lost 0.80 %, Shanghai & Hang Seng closed for holiday
- Commodities: Gold at $1196 (+0.45 %), Silver at $17.18 (+0.25 %), WTI Oil at $52.90 (-0.50 %), Brent Oil at $55.40 (-0.60 %)
- Rates: US 10-year yield at 2.47, UK 10-year yield at 1.47, German 10-year yield at 0.46
News & Data:
- Japan Retail Trade (YoY) Dec: 0.6% (est. 1.7%, prev. 1.7%)
- Japan Retail Sales (MoM) Dec: -1.7% (est. -0.5%, prev. 0.2%)
- Global shares, dollar retreat on Trump travel ban, weak U.S. GDP – RTRS
- Oil extends decline as rising U.S. output weighs – RTRS
- Dollar slips on lacklustre U.S. data, concerns over Trump trade policy – RTRS
CFTC Positioning Data:
- EUR short 52K vs. 67K short last week. Shorts trimmed by 15K
- GBP short 66K vs. 66K short bus week. Unchanged
- JPY short 67K vs. 78K short last week. Shorts trimmed by 11K
- CHF short 14K vs. 14K short last week. Unchanged
- CAD long 3K vs. 5K short last week. Position flips to long with change of 8K
- AUD long 10K vs 5K long last week. Longs increase by 5K
- NZD short 10K vs 12K short last week. Shorts trimmed by 2K
Markets Update:
The Asian stock markets reacted negatively to the political developments in the United States over the weekend, with both the Nikkei and ASX down more than 0.50 % on the day. Chinese and HK markets are closed for the Lunar New Year holiday.
In FX, the Dollar weakened against most other major currencies. EUR/USD opened with a 20 pips gap higher and rallied to 1.0740, while GBP/USD rose from 1.2540 to 1.26. Meanwhile, USD/JPY came under pressure and fell from 115.00 to 114.30. Support is seen at 114.10, followed by 113.05/10.
While the focus has been on politics in the past few days, the weak US GDP print certainly also has weighed on the US Dollar. The economy grew only 1.9 % quarter-on-quarter, while the market expected a 2.2 % increase. Given the crowded positioning, the Dollar could remain under pressure in the near-term.
Upcoming Events:
- 07:45 GMT – RBA Assistant Governor Debelle speaks
- 09:00 GMT – ECB Member Nowotny speaks
- 10:00 GMT – Euro Zone Consumer Confidence
- 13:00 GMT – German CPI
- 13:30 GMT – US Pending Home Sales
- 13:30 GMT – US Core PCE Price Index
- 23:30 GMT – Japanese Unemployment Rate
- 23:30 GMT – Japanese Household Spending
- 23:50 GMT – Japanese Industrial Production
The Week Ahead:
Tuesday, January 31st
- 00:30 GMT – Australian NAB Business Confidence
- 03:00 GMT – Bank of Japan Interest Rate Decision
- 06:30 GMT – Bank of Japan Press Conference
- 07:00 GMT – German Retail Sales
- 07:45 GMT – French CPI
- 08:00 GMT – Spanish CPI
- 08:00 GMT – ECB President Draghi speaks
- 08:55 GMT – German Unemployment Rate
- 10:00 GMT – Euro Zone GDP
- 10:00 GMT – Euro Zone CPI
- 13:30 GMT – Canadian GDP
- 14:45 GMT – US Chicago PMI
- 15:00 GMT – US CB Consumer Confidence
- 21:45 GMT – New Zealand Unemployment Rate
- 22:30 GMT – Australian AIG Manufacturing Index
- 22:35 GMT – Bank of Canada Governor Poloz speaks
Wednesday, February 1st
- 01:00 GMT – Chinese Manufacturing PMI
- 01:00 GMT – Chinese Non-Manufacturing PMI
- 08:45 GMT – Italian Manufacturing PMI
- 08:50 GMT – French Manufacturing PMI
- 08:55 GMT – German Manufacturing PMI
- 09:00 GMT – Euro Zone Manufacturing PMI
- 09:30 GMT – UK Manufacturing PMI
- 13:15 GMT – US ADP Nonfarm Employment Change
- 15:00 GMT – US ISM Manufacturing PMI
- 15:30 GMT – US Crude Oil Inventories
- 19:00 GMT – Federal Reserve Interest Rate Decision
- 19:00 GMT – FOMC Statement
Thursday, February 2nd
- 00:30 GMT – Australian Trade Balance
- 08:15 GMT – Swiss Retail Sales
- 09:30 GMT – UK Construction PMI
- 12:00 GMT – Bank of England Interest Rate Decision
- 12:00 GMT – BoE Meeting Minutes
- 12:30 GMT – Bank of England Governor Carney speaks
- 13:30 GMT – US Initial Jobless Claims
Friday, February 3rd
- 01:45 GMT – Chinese Caixin Manufacturing PMI
- 08:45 GMT – French Services PMI
- 08:50 GMT – Italian Services PMI
- 08:55 GMT – German Services PMI
- 09:00 GMT – Euro Zone Services PMI
- 09:30 GMT – UK Services PMI
- 10:00 GMT – Euro Zone Retail Sales
- 13:30 GMT – US NFP
- 13:30 GMT – US Unemployment Rate
- 13:30 GMT – US Average Hourly Earnings
- 13:45 GMT – US Services PMI
- 15:00 GMT – US Factory Orders
- 15:00 GMT – US ISM Non-Manufacturing PMI
Foreign Exchange Market Commentary
EUR/USD
The common currency lost its January momentum by the end of the month, closing the week against the greenback flat a few pips below the 1.0700 level. Much of the so far modest dollar's recovery came from US indexes soaring to all-time highs on renewed hopes that US President Trump, will boost growth and inflation. The measures announced during his first week at the office indicate that he is serious about implementing protectionist trade policies, as among other decisions, the withdraw the US definitively from the TPP deal. US data released on Friday indicated that confidence in the future is somehow stronger than economic growth, as the most positive figure was the final reading of the Michigan Consumer Sentiment index for January, up to 98.5 from previous estimate of 98.1 the highest since 2004. The Q4 GDP disappointed, give a 1.9% real growth in the three months to December, below the 2.2% expected and previous 3.5%. December Durable Goods orders drop 0.4% amid a surprising transportation orders decline, with the core reading, ex-transportation, up 0.5%, in line with market's expectations.
During this week, attention will center on the FED's meeting, although the BOJ, and the BOE will also have monetary policy meetings. As for the US Central Bank, no changes to the current rate of 0.50%-0.75% are expected, and given that there won't be economic projections or a press conference, attention will focus in the statement, and clue it may offer on upcoming rate hikes. Also, the US will release its monthly job's report on Friday.
From a technical point of view, the daily chart shows that the price retreated from a major resistance, the 100 SMA in the daily chart. Additionally, the pair closed the day a few pips below the 38.2% retracement of the November/January decline at 1.0710, but held above a bullish 20 SMA, whilst technical indicators in the mentioned chart retreated within positive territory, but so far give no signs of a downward continuation. In the 4 hours chart, the downward potential seems to be increasing, given that the price is now contained by a bearish 20 SMA, whilst indicators head modestly lower within bearish territory. Still, the pair is holding around a daily ascendant trend line coming from this month multi-year low of 1.0340, unable to confirm a break lower. A downward acceleration through 1.0650, is what it takes to confirm further slides for this Monday, towards the next Fibonacci support at 1.0565.
Support levels: 1.0650 1.0610 1.0565
Resistance levels: 1.0710 1.0740 1.0770
USD/JPY
The USD/JPY pair closed the week a handful of pips above the 115.00 level, underpinned by a surprise move by the BOJ as the Central Bank increased its buying of 5 to 10-year bond yields from ¥410B to ¥450B. The 10-year JGB yield dropped to 0.075% from previous 0.09%, whilst the 5-year yield fell to -0.10%. Also, supporting the pair this past week was a strong rally in equities, although gains were limited on Friday by soft US data. The pair has set a strong floor in the 112.50 region, from where it recovered strongly in the past two weeks, yet given that the recovery stalled below the high within both lows, at 115.60, the upward potential remains limited. In the daily chart, technical indicators head higher, but are still unable to enter bullish territory, whilst the 100 DMA keeps heading north below the current level, indicating that a break above the mentioned resistance could indicate further gains for the upcoming days. In the 4 hours chart, however, technical indicators have lost upward strength, now consolidating within positive territory, whilst the price stands above a still bearish 100 SMA, but below its 200 SMA, this last around 116.00.
Support levels: 114.50 114.00 113.60
Resistance levels: 115.35 115.60 116.00
GBP/USD
After rallying to a fresh monthly high of 1.2673, the GBP/USD pair retreated on Thursday, despite resilient UK economic data. The economy grew by 0.6% in the last quarter or 2016, according to the GDP estimate, beating expectations of a 0.5% advance, even accelerating in the second half of the year when compared to the first half. The Supreme Court ruled against the government in the case of the Parliament's intervention in the Brexit date, but it was renewed dollar demand what weighed on the pair. The Bank of England will have a monetary policy meeting this week, mostly expected to be a non-event, as it seems too early for Carney to reverse the easing announced last August. Despite the retracement, the GBP/USD pair hasn't lost completely its latest upward potential, given that it held above 1.2510, the 23.6% retracement of its latest bullish run. In the daily chart, the 20 DMA maintains a modest bullish slope around 1.2330, converging with the 50% retracement of the same rally, whilst technical indicators retreated from overbought readings, but remain within bullish territory. In the shorter term, and according to the 4 hours chart, the risk has turned towards the downside, as the pair is currently developing below its 20 SMA, whilst the Momentum indicator entered bearish territory, maintaining its bearish slope, and the RSI indicator turned lower around 52.
Support levels: 1.2510 1.2470 1.2425
Resistance levels: 1.2595 1.2635 1.2680
GOLD
Spot gold closed the week sharply lower at $1,190.87 a troy ounce, undermined by a spike in risk-appetite as speculative interest resumed the "Trump-trade" mid last week. The commodity fell to a weekly low of 1,180.49 last Friday, paring losses on the back of soft US data. A market report, showing that physical demand for gold declined to a seven-year low during 2016, and that the during the last quarter of the year the commodity reached its largest levels of oversupply in over a decade, also weighed on the commodity. From a technical point of view, the daily chart shows that the price retreated from a key resistance, a bearish 100 SMA, while also settling by the end of the week below its 20 SMA, suggesting an increasing bearish potential. In the same chart, indicators have continued retreating from overbought readings, currently hovering around their mid-lines, leaving gold at risk of falling further. In the 4 hours chart, the 20 SMA heads south above the current level, and after crossing below the 100 SMA, whilst technical indicators bounced from oversold readings, but remain within negative territory, with the RSI turning lower around 42, also suggesting an increased downward potential.
Support levels: 1,181.20 1,173.15 1,162.10
Resistance levels: 1,196.00 1,204.50 1,214.60
WTI CRUDE
Crude oil prices remained flat for a second consecutive week, with West Texas Intermediate futures closing a few cents above $53.00 a barrel. A surprise build in US stockpiles offset news that the OPEC compiled with the production cut announced last November during the first month of the year. Overall, the commodity remains neutral, within a tight 52-55 range. From a technical point of view, WTI maintains a neutral stance, although with the downside limited according to the daily chart, as the price stands around a horizontal 20 SMA, but well above a bullish 100 SMA. Technical indicators in the mentioned chart have turned lower within neutral territory, unable to provide clear directional clues. In the 4 hours chart, the price is stuck within a congestion of moving averages, all together in a $1 range, whilst technical indicators are also around neutral territory, with modest bearish slopes.
Support levels: 53.00 52.55 52.00
Resistance levels: 53.65 54.30 55.00
DJIA
US major indexes closed little changed last Friday, with the DJIA down 7 points, to 20,093.78 and the S&P down by 2 points at 2,294.69. The Nasdaq Composite managed to gain some, up by 5 points or 0.10% to 5,660.78, with equities weighed by soft Q4 GDP growth. Nevertheless, indexes closed near record levels achieved earlier in the week. Earnings reports will keep on coming during the upcoming days, and will set the tone for stocks, beyond FOMC announcement or the NFP report. Within the Dow, Microsoft was the best performer, up 2.35%, followed by Caterpillar that added 1.82%. Chevron on the other hand, led losers' list down by 2.37%. In the daily chart, technical indicators have lost upward strength and turned lower, with the Momentum near its 100 level and the RSI barely retreating from overbought territory, whilst the benchmark remains well above a horizontal 20 SMA, indicating a limited downward potential. In the 4 hours chart, the Momentum indicator heads sharply lower, now nearing its mid-line, but the RSI indicator consolidates around 62 and the 20 SMA maintains a strong bullish slope, now providing an immediate dynamic support at 20,058.
Support levels: 20,058 19,999 19,950
Resistance levels: 20,106 20,150 20,200
FTSE 100
The FTSE 100 advanced 23 points on Friday, and settled at 7,184.49, not enough to enter positive territory weekly basis. The Footsie was held down by a strong Pound that rallied to fresh January highs this past week, with Friday's advance supported by Tesco that closed 9.29% higher after announcing it will restart paying dividends and announcing the company reached a deal to buy food wholesaler Booker Group for £3.7 billion. Pearson on the other hand was the worst performer, down 2.41%. Technically, the daily chart shows that there was not much action this past week, with the benchmark confined to a tight range, below its 20 DMA and with indicators flat within neutral territory, maintaining the risk towards the downside. The weekly low was set at 7,130, the key support for the upcoming days as a break below it should lead to further losses. In the 4 hours chart, the technical picture is also neutral, with the benchmark confined around its 20 and 100 SMA, and technical indicators lacking directional strength around their mid-lines.
Support levels: 7,130 7,085 7,025
Resistance levels: 7,183 7,241 7,288
DAX
The German DAX closed last Friday at its highest since May 2015 at 11,814.27, despite losing 0.29% or 34 points last Friday, amid a decline in auto makers and energy-related equities. ThyssenKrupp was the best performer, up by 1.56%, with Deutsche Bank leading losers' list, down by 1.53%, followed by Volkswagen that closed down 1.30% and Daimler that shed 1.20%. Solid earnings reports were behind the weekly gain, particularly after Spaniard Banco de Santander S.A.'s report. As for the DAX, the daily chart shows that the index holds well above its moving averages, with the shortest being the 20 DMA around 11,623, the Momentum indicator flat within positive territory, and the RSI indicator turning modestly lower around 69, not enough to confirm an upcoming downward move. In the shorter term, and according to the 4 hours chart, the bearish side is also limited, as the 20 SMA heads north around 11.724, whilst technical indicators consolidate well above their mid-lines.
Support levels: 11,796 11,757 11,694
Resistance levels: 11,833 11,891 11,945
Market Morning Briefing
STOCKS
Overall some correction is visible in global equities after some strength seen last week. Some sideways movement could be expected in the early sessions this week before the upward momentum takes force.
Dow (20093.78, -0.04%) could possibly see a sideways trade in the 20000-20150 region for a couple of sessions before moving higher towards 20500. While the support at 20000 holds, we keep the upside possibility of 20500-20700 open for the near term.
Dax (11814.27, -0.29%) is trading just below immediate resistance zone of 11920-11930 (within the broad 11900-12000 resistance levels) which could keep the index down for at least the next 2-3 sessions. We could possibly see a re-test of 11680 before seeing a sharp bounce back towards current levels.
The Chinese markets are closed today. But after the holiday session is over, we may expect Shanghai (3159.17, +0.31%) to rally towards 3175-85 levels. Note weekly resistance near 3200 which could hold in the near term.
Nikkei (19322.78, -0.74%) could remain range-bound in the next few sessions in the 19000-19620 region but could regain strength possibly by the end of the week to move up strongly towards 19620-19750 levels in case a sharp rise is seen in Dollar-Yen (114.38).
Nifty (8641.25, +0.45%) shot up moving above 8600 last week and could be headed towards 8740-8800 levels as mentioned earlier. But also note immediate resistance visible on the near term charts near 8650 which could push the index towards 8600 or lower just now.
COMMODITIES
Gold (1194.57) has moved up again on slight weakness in the Dollar Index. But note that immediate resistance is visible near 1200-1210 region which is likely to keep prices low in the near term. We may continue to target levels of 1160 while below 1210.
Silver (17.17) is trading below the 17.50 resistance and while that holds, it could come off towards 17.00-16.00 levels in the near term.
Brent (55.32) and WTI (53.02) have been range-bound in the broad 52.50-58.50 and 50-56 regions respectively and unless a sharp breakout on either side is seen, it is difficult to say how long this sideways consolidation would continue. While we keep the overall longterm bullish sentiment intact, we need to wait for confirmation in the near to medium term.
Copper (2.69) has risen and could re-test the previous highs of 2.75-2.78 levels in the near term. Also note that the 2.75-2.80 zone is a crucial resistance zone and could possibly hold for the medium term. Only a sustained break above 2.80 could ensure further bullishness on Copper.
FOREX
Dollar Index (100.20) was unable to sustain the rise of Thursday-Friday and trades lower today. But, it also has important Support in the 100.05-99.75 region. This week, the market will battle to see whether this Support is broken or not.
Maybe the curencies will consolidate/ move sideways for a while in the coming week or two. A biggish move could be in the offing after the consolidation. The markets will be keen to know the Fed's path for increase of interest rates after the FOMC meeting on Wednesday, especially in light of the weak Q4 GDP data in the USA. While further Dollar weakness is a possibility, confirmation is needed.
Should the Euro (1.0730), which has bounced from Friday's Suport levels, break above crucial near-term Resistance at current levels, it can rise to test 1.08. However, the Euro might not find more near term strength from rising European interest rates (see Interest Rates below).
Re-examining what we said on Friday, we find that Dollar-Yen (114.45) has important Resistance at 115 (5-week MA) this week, which could keep it pressured lower. If so, there could be danger of a break below 113.85-65 going into next week. Break above 115.00 is needed to bring up 115.60/ 116.30.
The Pound (1.2590) is potentially bullish but needs to break above the 21-week MA near current levels convincingly. Success can take it up towards 1.29. Medium/ long-term Support at 1.2400 now.
Like the Pound, the Aussie (0.7558) has potential to rise further towards 0.77, but faces Resistances on the Weekly charts. Failure to rise can push it down towards 0.74
Dollar-Rupee (68.04) trades near 68.06 on the NDF today. Likely to trade sideways for the next couple of days at least.
INTEREST RATES
Although Yellen's speech earlier in the month had indicated a 75bp hike in rates in 2017, the market will like to see what the FOMC says on Wednesday. How will it reconcile the recent dip in US Q4 GDP (http://kshitij.com/graph-gallery/fundamentals/usgdp)to 1.86%, compared to 3.47% in Q3 on the one hand and the concerns about Dollar strength on the other hand?
We see interest rates stabilising in the near term in both the USA and in Europe. While US interest rates have been rising again since mid-Jan, European rates have been rising through January as a whole. This is reflected in the rise in the German-US 2Yr Yield Spread (-1.92%), which remains in an uptrend for now.
But, we also keep in mind that the German 2Yr itself may find some Resistance near the current levels of -0.67%.
GOLD – Bearish, Declines On Correction
GOLD - The commodity closed lower the past week leaving risk of more weakness on the cards in the new week. On the downside, support comes in at the 1,180.00 level where a break will turn attention to the 1,170.00 level. Further down, a cut through here will open the door for a move lower towards the 1,160.00 level. Below here if seen could trigger further downside pressure targeting the 1,150.00 level. Conversely, resistance resides at the 1,200.00 level where a break will aim at the 1,210.00 level. A turn above there will expose the 1,220.00 level. Further out, resistance stands at the 1,230.00 level. All in all, GOLD looks to weaken further.
EURUSD – Risk Remains Lower On Further Weakness
EURUSD - With the pair closing flat the past week after rejecting higher prices the past week, further weakness is likely in the new week. On the down, support lies at the 1.0650 level where a violation will aim at the 1.0600 level. A break of here will aim at the 1.0550 level. Conversely, on the upside, resistance comes in at 1.0750 level with a cut through here opening the door for more upside towards the 1.0800 level. Further up, resistance lies at the 1.0850 level where a break will expose the 1.0900 level. All in all, EURUSD faces further downside pressure in the new week as long as it trades and holds below the 1.0774 zone.
NZD/USD Confluence Of Resistance
NZD/USD is sitting nicely at a confluence of resistance, capped by both a horizontal level tested by previous swing highs and the trend line drawn by connecting each lower high that we can clearly see on the daily chart.
NZD/USD Daily:
It's the three lower highs that are the most telling when it comes to displaying whether the bulls or bears are in control of the market. Each time that the bulls have bought the pair up, they haven't been able to sustain and with each failure to make a new high, you can see that the buyers are diminishing in numbers. When the buyers have been totally exhausted, all that remains are the sellers and this is where you see the big drops occur.
You can also see how important this horizontal level was back in May/June of last year, with some very strong rejections off the level shown on the chart by huge wicks followed by bearish candles. Yes price has chopped through the level since, but that doesn't make it any less significant, especially given the fact that it may be getting reactivated on that final rejection that we have marked on the chart above.
NZD/USD Hourly:
Zooming into the hourly chart on our MT4 platform to look for an entry, the problem is that there really isn't an obvious area of short term support that would turn to resistance and allow us to get in. I'm never one to advocate blindly shorting a higher time frame level, especially in the midst of the bullish momentum that is shown clearly on this hourly chart, so it's caution being shown by me.
The scenarios for here would be either short off a re-test of the lower blue level, or to wait for a 2nd test and hold of the daily zone and see if a new intraday entry level will form. For now we wait.
EUR/USD Weekly Outlook
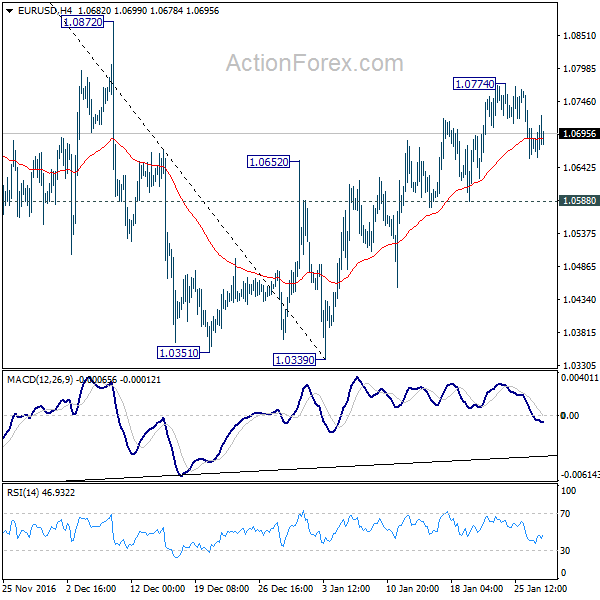
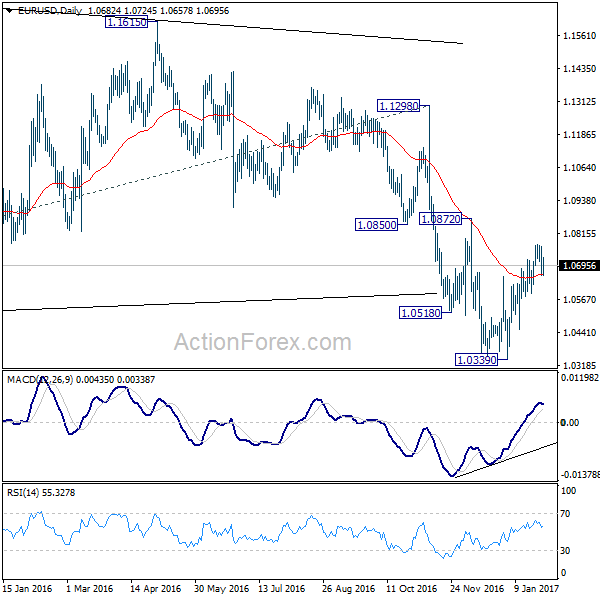
EUR/USD edged higher to 1.0774 last week but lost momentum since then. Initial bias is neutral this week first. Price actions from 1.0339 are seen as a corrective rise. In case of extension, upside should be limited by 1.0872 resistance. Break of 1.0588 will indicate that such rise is completed and turn bias to the downside for retesting 1.0339 low.
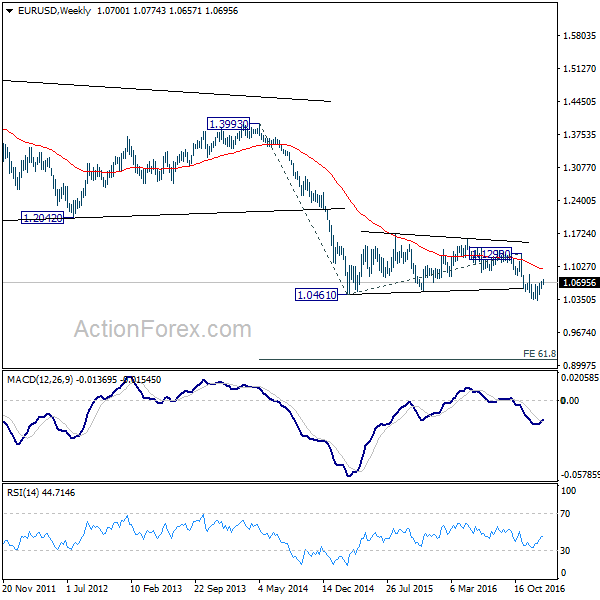
In the bigger picture, whole down trend from 1.6039 (2008 high) is in progress. Such down trend is expected to extend to 61.8% projection of 1.3993 to 1.0461 from 1.1298 at 0.9115. On the upside, break of 1.1298 resistance is needed to confirm medium term bottoming. Otherwise, outlook will stay bearish in case of rebound.
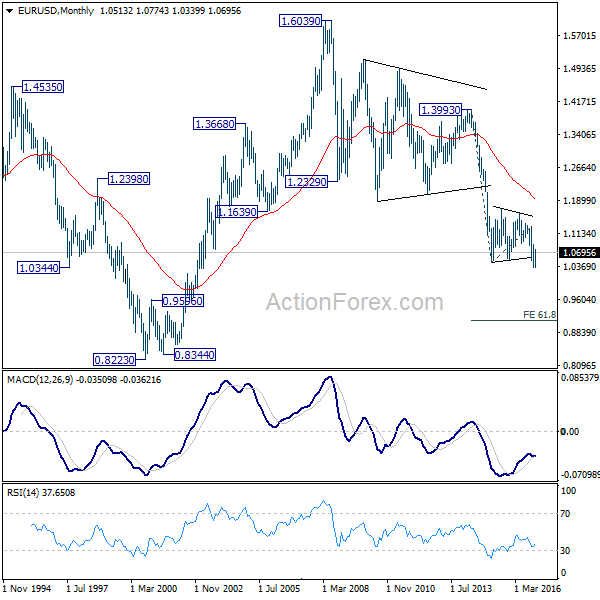
In the long term picture, the down trend from 1.6039 (2008 high) is still in progress and there is no clear sign of completion. We'd expect more downside towards 0.8223 (2000 low) as long as 1.1298 resistance holds.
Subscribe to our daily and mid-day newsletter to get this report delivered to your mail box
Risk Appetite Dominated the Week, Sterling Shone While Yen Pressured
The financial markets traded with solid risk appetite last week and the three major US equity indices surged to new record highs in US president Donald Trump's first week in White House. Markets took Trump's signing of some executive orders, include trade and immigration, as sign that he will deliver his election promise and push an expansive fiscal policy. Nonetheless, the rally in stocks and yields lost some steam towards the end of the week after disappointing Q4 GDP data. And Dollar ended mixed. Meanwhile, Sterling ended as the strongest major currency as Supreme Court ruled that prime minister Theresa May's Brexit plan must seek parliament approval. The sale of a new 40 year government bond in UK also attracted record demand, showing appetite for UK assets. Meanwhile, Yen ended as the weakest one as BoJ stepped up its asset purchases to cap the rally in JGB yields.
FOMC rate decision, US non-farm payroll and BoE rate decision will be the main focuses in the week ahead. Currently, fed fund futures are pricing in 24.4% and 71.9% chances of a rate hike by March and June respectively. Recent comments from Fed officials suggested that Fed is still on course for three hikes this year. But there are already some speculations that the central bank is ready for a quicker path based on optimism in other parts of the markets. The greenback could be given a boost if FOMC sounds open to an earlier hike in the accompanying statement. Meanwhile, dollar bulls will also look into a string of data, including PCE on Monday, ISM manufacturing on Wednesday and non-farm payroll on Friday for excuses to strike a come back.
Technically, we'd firstly reiterate that price actions from 103.82 in the Dollar index are corrective in nature. This is supported by the development in yields which followed stocks higher this week. That is price action of TNX from 2.621 are corrective in nature too. Hence, even in case of another fall, down side of Dollar index should be contained by 98.91/99.43 support zone (61.8% retracement of 95.88 to 103.82 at 98.91. However, we wont' be surprised to see the index jumps the gun on loss on momentum and rebound from 100 psychological level. And a break above 55 day EMA (now at 100.90) would be the first sign of near term reversal.

BoE rate decision will be another focus on the week, in particular as the central bank is scheduled to release the quarterly inflation report. It's generally expected that based on recent strong data, BoE would likely upgrade both growth and inflation forecast. Markets are indeed pricing in more than 50% chance of a rate hike by BoE by the end of the year. But of course, uncertainty over Brexit remains and the picture could still change largely when prime minister May finally trigger the Article 50 for Brexit in March. But for the time being, a slightly hawkish BoE message this week could give the pound an extra push.
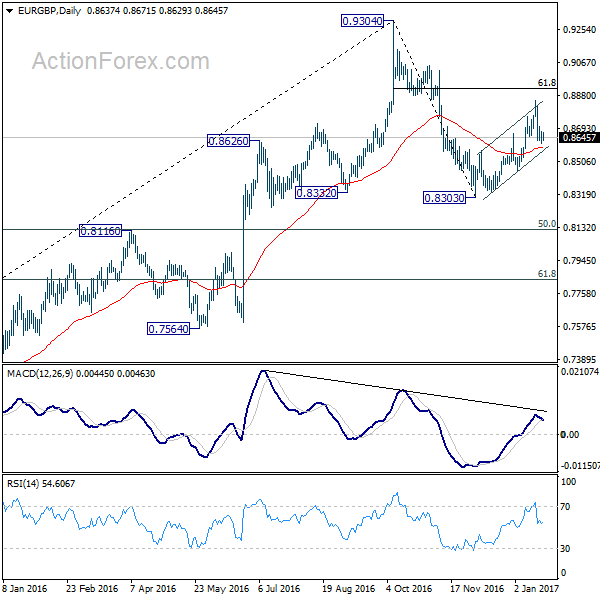
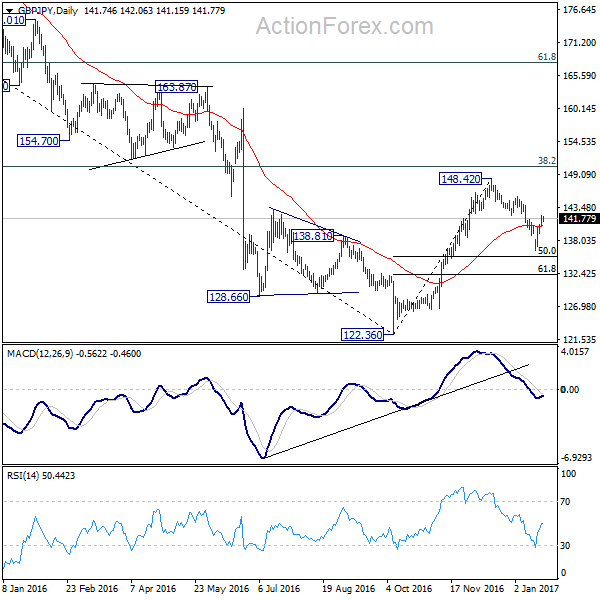
For the near term, EUR/GBP looks set to extend recent fall from 0.9304. This is supported by the firm break of the near term channel from 0.8303 last week. Meanwhile, GBP/JPY's strong rise last week also argue that that rebound from 122.36 is ready to resume.
Regarding trading strategies, we'd formulate our plan for the week based on these points. Firstly, we'd expect risk appetite to continue with US indices extending the record runs and take global equities higher. Such development should continue to exert pressure on the Japanese yen. Secondly, there is prospect of further rally is Sterling as BoE would very likely at least sound more comfortable regarding the economic outlook. Thirdly, there is also some prospect of a rebound in Dollar, taken up by stocks and yield, as well as a rebound from 100 in dollar index.
We'll try to buy GBP/JPY on a retreat to 142.50 this week with at atop at 140.50. Meanwhile, we'll sell EUR/USD on break of 1.0588, with a stop at 1.0650 this week.
EUR/USD Weekly Outlook
EUR/USD edged higher to 1.0774 last week but lost momentum since then. Initial bias is neutral this week first. Price actions from 1.0339 are seen as a corrective rise. In case of extension, upside should be limited by 1.0872 resistance. Break of 1.0588 will indicate that such rise is completed and turn bias to the downside for retesting 1.0339 low.
In the bigger picture, whole down trend from 1.6039 (2008 high) is in progress. Such down trend is expected to extend to 61.8% projection of 1.3993 to 1.0461 from 1.1298 at 0.9115. On the upside, break of 1.1298 resistance is needed to confirm medium term bottoming. Otherwise, outlook will stay bearish in case of rebound.
In the long term picture, the down trend from 1.6039 (2008 high) is still in progress and there is no clear sign of completion. We'd expect more downside towards 0.8223 (2000 low) as long as 1.1298 resistance holds.
Subscribe to our daily and mid-day newsletter to get this report delivered to your mail box
USD/JPY Weekly Outlook
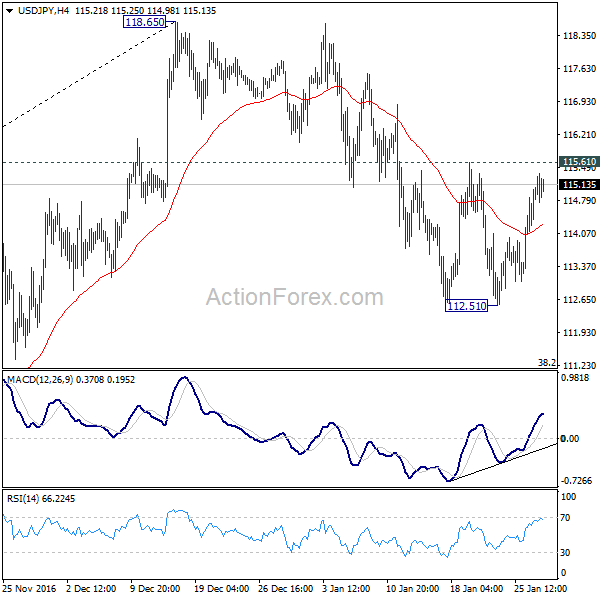
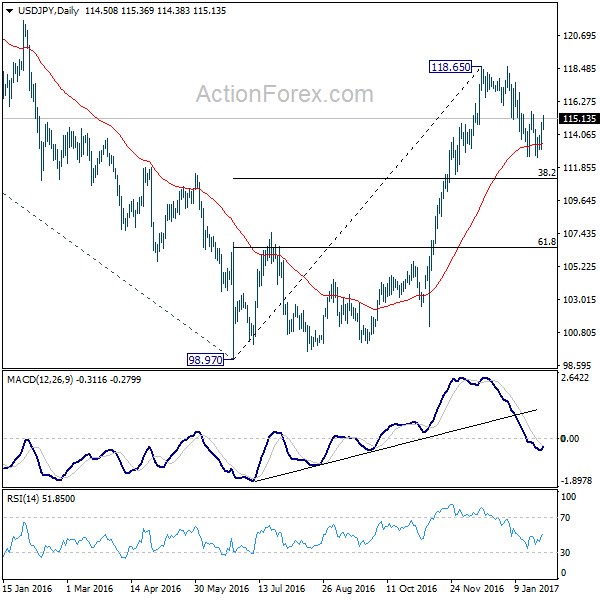
USD/JPY edged lower to 112.51 last week but recovered. Initial bias stays neutral this week first. Price actions from 118.65 are seen as a corrective move. In case of another fall, downside should be contained by 38.2% retracement of 98.97 to 118.65 at 111.13 and bring rebound. Break of 115.61 resistance will suggest that the correction is finished and turn bias to the upside for 118.65. Break will resume whole rise from 98.97 and target 125.85 key resistance.
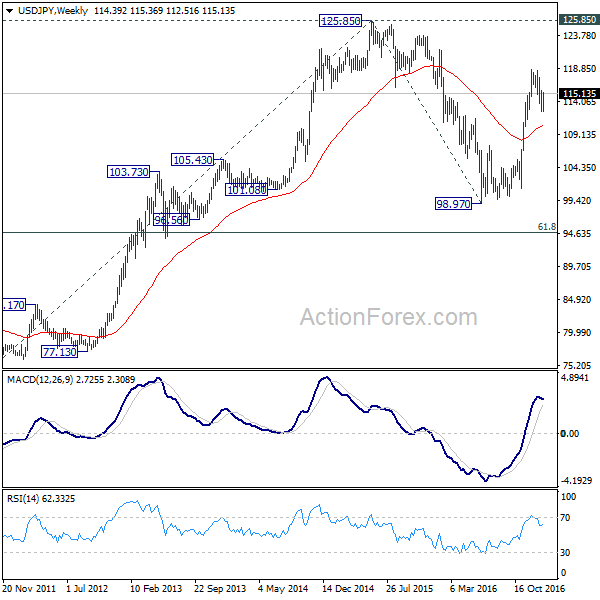
In the bigger picture, price actions from 125.85 high are seen as a corrective pattern. The impulsive structure of the rise from 98.97 suggests that the correction is completed and larger up trend is resuming. Decisive break of 125.85 will confirm and target 61.8% projection of 75.56 to 125.85 from 98.97 at 130.04 and then 135.20 long term resistance. Rejection from 125.85 and below will extend the consolidation with another falling leg before up trend resumption.
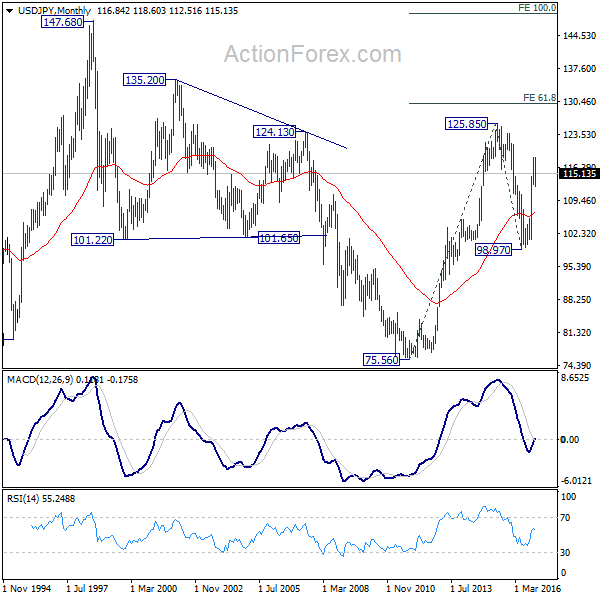
In the long term picture, the rise from 75.56 long term bottom to 125.85 medium term top is viewed as an impulsive move. Price actions from 125.85 are seen as a corrective move which could still extend. But, up trend from 75.56 is expected to resume at a later stage for above 135.20/147.68 resistance zone.
Subscribe to our daily and mid-day newsletter to get this report delivered to your mail box
GBP/USD Weekly Outlook
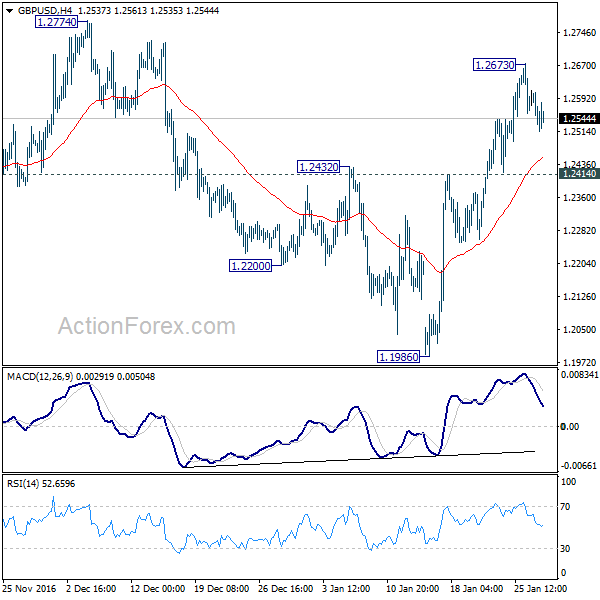
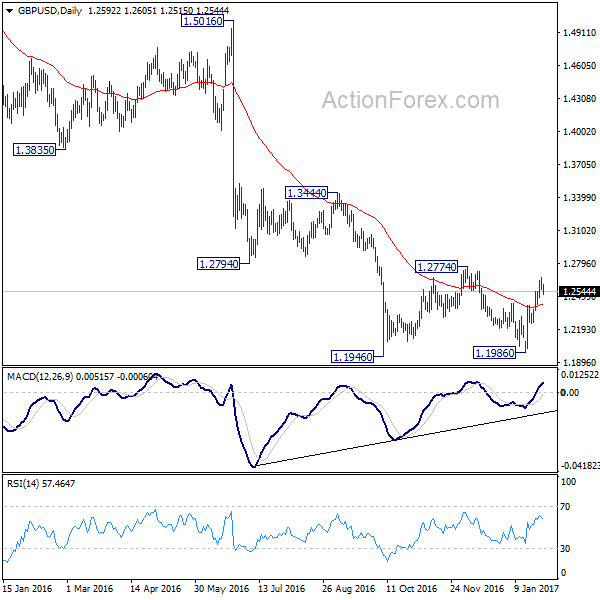
GBP/USD rose further to as high as 1.2673 last week but lost momentum since then. Initial bias stays neutral this week first. Rise from 1.1986 is seen as the third leg of the consolidation pattern from 1.1946. Hence, in case of another rise, we'd expect strong resistance at 1.2774 to limit upside and bring down trend resumption eventually. On the downside, break of 1.2414 will argue that rise from 1.1986 is completed and turn bias to the downside for 1.1946 low.
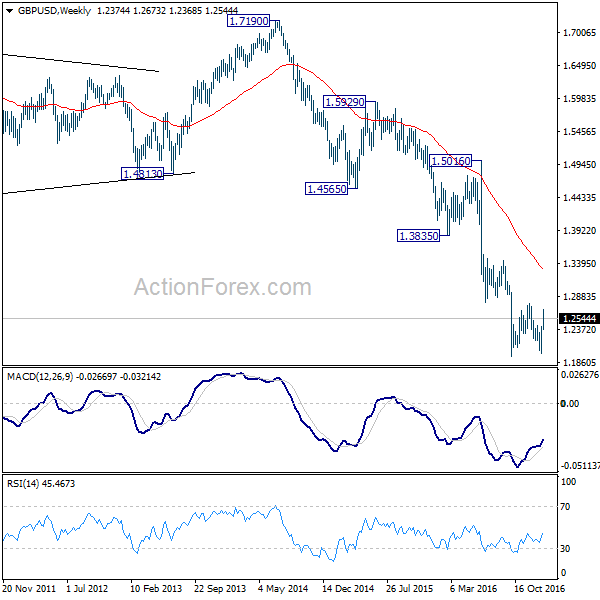
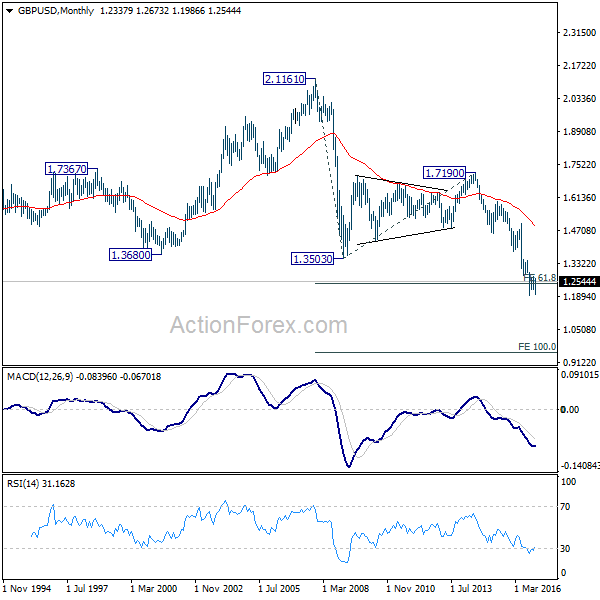
In the bigger picture, fall from 1.7190 is seen as part of the down trend from 2.1161. There is no sign of medium term bottoming yet. Sustained trading below 61.8% projection of 2.1161 to 1.3503 from 1.7190 at 1.2457 will target 100% projection at 0.9532. Overall, break of 1.3444 resistance is needed to confirm medium term bottoming. Otherwise, outlook will remain bearish.
In the longer term picture, no change in the view that down trend from 2.1161 is still in progress. Current momentum suggests that the down trend will go deeper than originally expected.
Subscribe to our daily and mid-day newsletter to get this report delivered to your mail box