
Sample Category Title
Today’s Focus On Theresa May And Donald Trump Meeting
Market movers today
The main event today is the meeting between UK PM Theresa May and US President Donald Trump. In our view, it is likely the two will say that the UK and US will ‘renew their special relationship' and ‘lead together again'.
On the data front, we get the first estimate of US GDP growth for Q4 16. We estimate GDP growth was 2.3% q/q AR driven mainly by private consumption. Business investments seem to have bottomed out when looking at core capex orders and we expect a positive contribution to growth in Q4. Capex orders for December are also released today and should have increased. Looking ahead, we expect capex orders to move higher on the back of higher oil prices, which supports oil investments and the rebound in manufacturing.
US PCE core inflation in Q4 will give us the December inflation rate implicitly. Based on the CPI data released last week, we estimate PCE core prices rose 0.2% m/m in December, corresponding to a quarterly print of 1.4 q/q AR in Q4, down from 1.7% in Q3.
In the euro area, money supply and loan growth figures for December are due for release. Loan growth to the private sector has improved to just below 2.0% y/y and the ECB's latest bank lending survey showed that demand for loans should continue to support growth in lending to both households and enterprises but credit standards for loans to enterprises tightened somewhat, driven by lower willingness to tolerate risk mainly in the Netherlands.
In Scandinavia, Swedish business, consumer confidence and retail sales figures are due for release. For more info, see Scandi markets on page 2.
Selected market news
With less than a week as US President, Trump is now in his first major foreign policy conflict after Mexico's President Nieto cancelled a meeting with him planned for next week. The cancellation followed President Trump's tweet that if Mexico was unwilling to pay for the ‘badly needed wall', then it would be better to cancel the upcoming meeting. The conflict threatens one of the largest bilateral trading relationships but Trump's spokesman Sean Spicer said ‘we will continue to co-ordinate', while Mexico's President Nieto said the door was not closed for a meeting. Later yesterday, the White House said Trump wanted to pay for the wall with a 20% tax on imports from Mexico as part of a tax reform package.
The positive risk sentiment continued with rising equity prices and fixed income sellingoff. Yesterday, USD followed suit and recovered following the resistance of the past few days. In fixed income markets, Italy and Portugal were under pressure and in the 10Y space spreads widened 12bp and 11bp to Germany, respectively, while Spain widened only slightly. In Italy, the headwind continued after the Constitutional Court rejected part of the ‘Italicum', creating market fears that a snap-election has moved closer, while Portugal was under pressure after Bloomberg reported that an EU official had said that ‘the Portugal situation is not good'.
Bundesbank President Jens Weidmann said yesterday that euro area inflation is heading towards the ECB's mandate indicating his view is that the ECB can soon start tapering. However, Weidmann also said ‘expansionary monetary policy path is currently appropriate' and that the ECB will exit the loose monetary policy only when inflation is sustained which is much less hawkish and in line with the stance of other ECB members.
GBPUSD And EURUSD Meets Sellers
After appreciating earlier this month following a period of investors unwinding on USD positions, both the GBPUSD and EURUSD have attracted sellers as the month draws to a conclusion. Traders began to take profit on GBPUSD positions during trading yesterday where the Pound also reached a fresh 6-week high marginally below 1.27. However it has since slipped all the way back through 1.26 and looks to be at risk to falling back below 1.25 before the week draws to a conclusion. While the majority of the momentum behind this move is led by technicals, investors are obviously reluctant to consider longer-term buying positions on the Pound bearing in mind the continuous uncertainty with the United Kingdom leaving the European Union.
The longer-term risk for the Pound still rests with the eventual invoking of Article 50 and although the previous concerns over a Hard-Brexit have softened significantly, this does not change the position that the UK will be exiting the European Union and there will naturally be a period of uncertainty ahead with months or even years of ongoing negotiations still to take place. The clock is very much ticking when it comes to the invoking of Article 50, and Theresa May now has barely a few days over two months before needing to meet the personal deadline she told the public at the end of March.
Keeping in mind that the United Kingdom will continue dominating headlines with the clock ticking down before Article 50 needs to be invoked many would naturally feel this will present risks for the British Pound and while this is likely to be the case, it is the Eurodollar that is going to face the largest downside risks in the near-term. The reason for the sudden rush of momentum in the EURUSD is once again largely led by technicals, but this does not change the outlook that the pair remains at risk to falling even lower before the end of the week after already dropping from 1.0764 to 1.0656 over the last trading day.
The EURUSD has currently also began the final day of the trading week under selling pressure, ambitious traders will be wondering whether the pair could be at risk to reversing its gains from 1.05 earlier in the month.
US Dollar Breaks Trend Lines And Recovers Impulsively
Currency pair EUR/USD
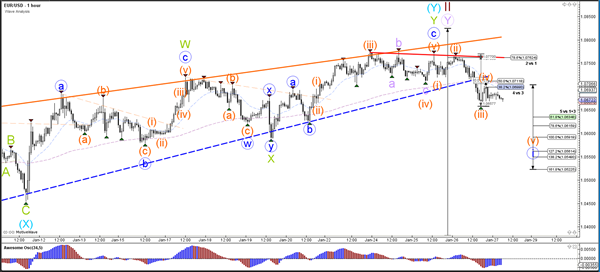
The EUR/USD has made a bearish turn at the 78.6% Fibonacci level of wave 2 vs 1 (brown) and has broken below the support of the rising wedge chart pattern (dotted blue). This bearish break could be a wave 1 (blue) of wave 3 (brown). The alternative scenario could be an ABC rather than a 1 (blue) which would indicate a larger correction.
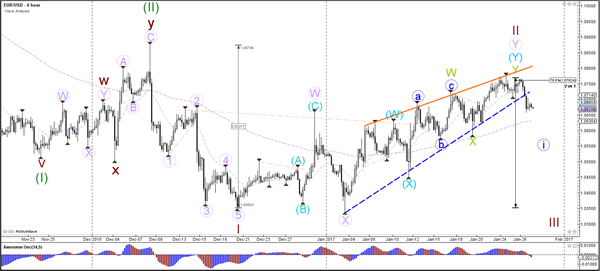
The EUR/USD could be in a wave 4 correction (orange) within wave 1 (blue). After wave 1 (blue) there could be a deep pullback for wave 2 without breaking the top (this would otherwise invalidate the count).
Currency pair GBP/USD
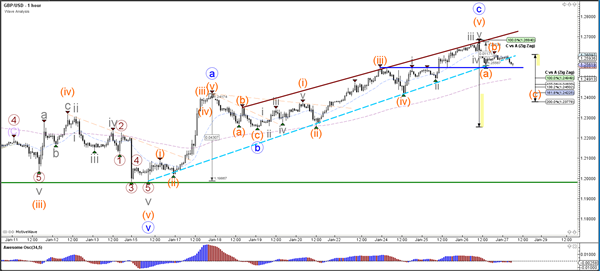
The GBP/USD seems to have completed an ABC zigzag (blue) at the main 100% Fibonacci target of wave C vs A. The bearish reaction could be either impulsive or corrective. At the moment a complex correction (wave W blue) is the favourite.
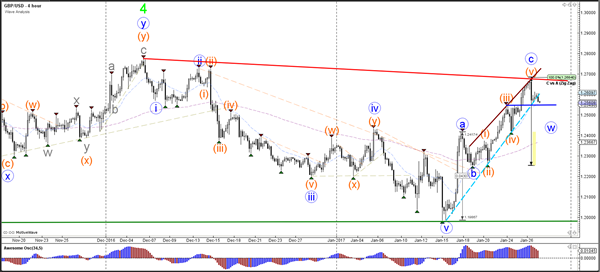
The GBP/USD could be building an ABC zigzag (orange) or a impulsive 5 wave. This depends on whether price breaks the support level (blue) and falls below the 100% Fibonacci target of wave C vs A.
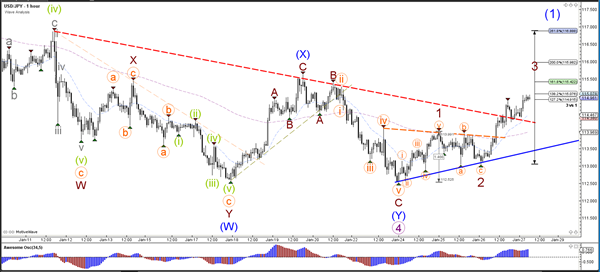
Currency pair USD/JPY
The USD/JPY broke above the resistance of the bearish triangle (dotted orange) and the downtrend channel (dotted red). This could signal the completion of wave 4 (purple) and the start of the wave 5 (purple).
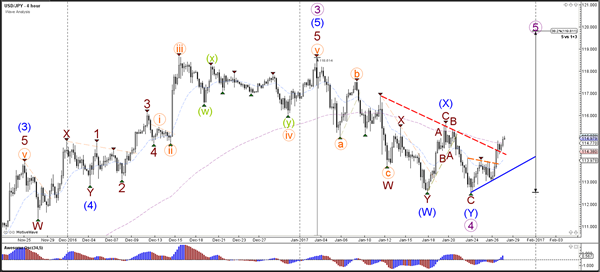
The breakout could be part of a wave 3 (brown) within a larger wave 1 (blue).
Daily Technical Outlook And Review
A note on lower timeframe confirming price action…
Waiting for lower timeframe confirmation is our main tool to confirm strength within higher timeframe zones, and has really been the key to our trading success. It takes a little time to understand the subtle nuances, however, as each trade is never the same, but once you master the rhythm so to speak, you will be saved from countless unnecessary losing trades. The following is a list of what we look for:
- A break/retest of supply or demand dependent on which way you're trading.
- A trendline break/retest.
- Buying/selling tails – essentially we look for a cluster of very obvious spikes off of lower timeframe support and resistance levels within the higher timeframe zone.
- Candlestick patterns. We tend to only stick with pin bars and engulfing bars as these have proven to be the most effective.
EUR/USD
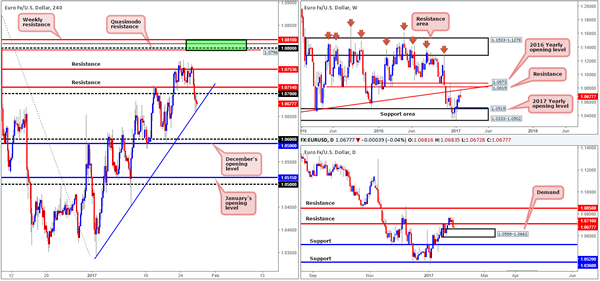
Looking at the weekly chart this morning, it’s reasonably easy to see who’s in control of the market at the moment. Price has reacted to a long-term weekly trendline resistance stretched from the low 0.8231, and is on course to form a weekly selling tail, potentially breaking a five-week bullish phase. Meanwhile, down on the daily timeframe, daily support at 1.0710 was engulfed yesterday (now an acting resistance), consequently forcing price to connect with the top edge of a daily demand area registered at 1.0589-1.0662.
With the US dollar surging higher across the board, the H4 candles broke through psychological support at 1.07 yesterday, and ended the day shaking hands with a H4 trendline support extended from the low 1.0340. A reaction from this angle has already been seen, but so far price has been unable to sustain gains beyond 1.07, which is now acting resistance!
Our suggestions: With the weekly timeframe suggesting lower prices may be on the cards, and the daily timeframe recently touching gloves with a daily demand area, higher-timeframe direction is a little restricted for the time being. On the H4 chart, as you can see, the upside is limited by the nearby 1.07 handle, followed closely by H4 resistance at 1.0714. A break below the current H4 trendline support, however, could lead to a move down to December’s opening barrier at 1.0590, which is shadowed closely by the 1.06 handle. Be that as it may, shorting the break of this line places one in direct conflict with potential daily buyers, and that is not somewhere we’d feel comfortable trading.
In light of the above points, our desk has come to a general consensus that remaining on the sidelines may be the better path to take today.
Data points to consider: 4th quarter Advance GDP print from the US, along with US durable goods orders at 1.30pm GMT.
Levels to watch/live orders:
- Buys: Flat (stop loss: N/A).
- Sells: 1.08 region ([dependent on the time of day, this is an area we would consider trading without confirmation] stop loss: 1.0825 [aggressive stop] 1.0875 [conservative stop]).
GBP/USD:
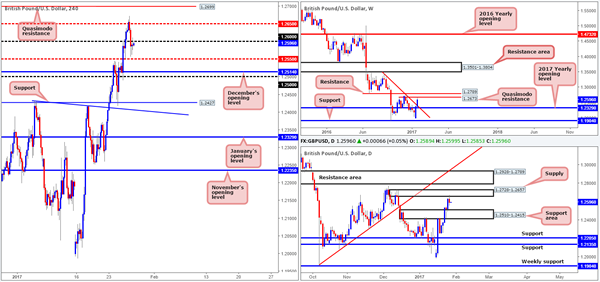
UK preliminary figures came in slightly above expectations yesterday, which, as can be seen on the M30 chart, was largely ignored by the market. After whipsawing through the H4 mid-way resistance coming in at 1.2650 (in the shape of a H4 two-candle bearish formation), price followed through with a H4 bearish close below 1.26, missing the H4 mid-way support at 1.2550 by a whisker!
As we write, 1.26 is holding firm as resistance. Through the simple lens of a technical trader, we believe the pendulum looks to be swinging in the direction of a continuation move south today. Over on the weekly candles, we can see that price recently collided with a weekly Quasimodo resistance drawn from 1.2673. On top of this, the daily chart rebounded from a daily supply at 1.2728-1.2657 during the course of yesterday’s session.
Our suggestions: Based on our analysis above, 1.26 could potentially hold as a resistance today and force price down as far as December’s opening base at 1.2514. Why 1.2514? The next downside target on the higher-timeframe picture can be seen at 1.2510-1.2415: a daily support area, which sits just below the above noted monthly opening line. With this in mind, our prime focus today will be on looking for lower-timeframe shorting opportunities around the 1.26 hurdle. This could be either a break of demand followed by a retest as supply, a trendline break/retest or simply a collection of well-defined selling wicks seen positioned around the H4 level. We typically search for lower-timeframe confirmation between the M15 and H1 timeframes, since most of our higher-timeframe areas begin with the H4. Stops are usually placed 3-5 pips beyond confirming structures.
Data points to consider: 4th quarter Advance GDP print from the US, along with US durable goods orders at 1.30pm GMT.
Levels to watch/live orders:
- Buys: Flat (stop loss: N/A).
- Sells: 1.26 region ([wait for a lower-timeframe confirming setup to form before looking to execute a trade] stop loss: dependent on where one confirms this area).
AUD/USD
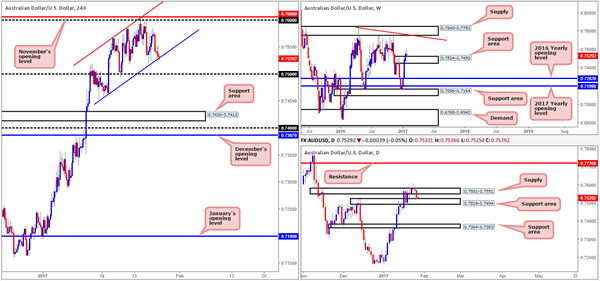
During the course of yesterday’s sessions, the commodity-linked currency spent the day fading from highs of 0.7585. Although this movement forced the H4 candles to retest the H4 channel support line extended from the low 0.7449, this supportive barrier looks incredibly vulnerable at present, as upside is currently capped by the H4 mid-way resistance 0.7550. Despite this, daily price is seen trading just ahead of a daily support area fixed at 0.7524-0.7494, which also marks the top edge of a weekly support zone coming in at 0.7524-0.7450.
Our suggestions: With this in mind, the buyers may very well still have a hand in this fight! While we agree the H4 candles seem to be reflecting more a bearish stance at the moment, we cannot ignore what the bigger picture is suggesting. As a result, we’re going to be keeping a close eye on the aforementioned H4 channel support today for lower-timeframe buying opportunities (see the top of this report).
Data points to consider: 4th quarter Advance GDP print from the US, along with US durable goods orders at 1.30pm GMT.
Levels to watch/live orders:
- Buys: Keep a tab on the above noted H4 channel support for buying opportunities ([wait for a lower-timeframe confirming setup to form before looking to execute a trade] stop loss: dependent on where one confirms this area).
- Sells: Flat (stop loss: N/A).
USD/JPY
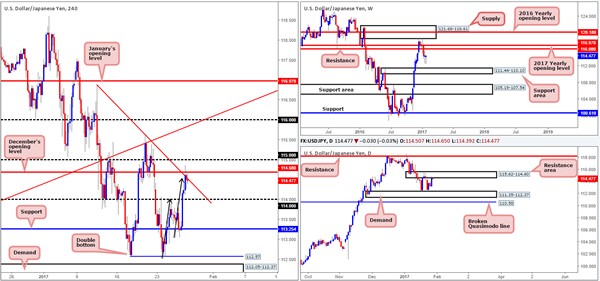
A strong session for the USD/JPY yesterday brought price to highs of 114.85 on the day. Despite this, yesterday’s Bull Run could be tested today! Traders may want to note that daily action is currently seen teasing the lower edge of a daily resistance area at 115.62-114.60, and H4 price recently connected with December’s opening line at 114.68. This – coupled with H4 price converging with a H4 trendline resistance taken from the high 116.87, a H4 AB=CD symmetrical approach which tops out around the 114.55 neighborhood (see black arrows) and of course, space seen for price to move lower down to at least the psychological support handle 114.
Our suggestions: While we believe that the pair is likely headed southbound today, we seemed to have missed the boat for a touch trade (pending order). Therefore, we’ll continue to watch how the lower-timeframe action behaves during today’s sessions, and may, assuming we’re able to identify a lower-timeframe sell setup (see the top of this report for ideas on what we consider a favorable setup), look to go short, targeting 114.
Data points to consider: 4th quarter Advance GDP print from the US, along with US durable goods orders at 1.30pm GMT.
Levels to watch/live orders:
- Buys: Flat (stop loss: N/A).
- Sells: 114.68 region ([wait for a lower-timeframe confirming setup to form before looking to execute a trade] stop loss: dependent on where one confirms this area).
USD/CAD
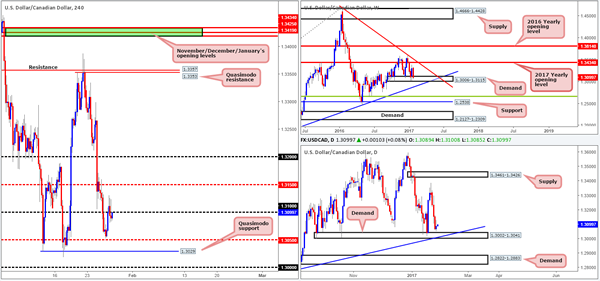
Kicking this morning’s report off with a look at the weekly chart shows us that the buyers and sellers remain battling for position within weekly demand drawn from 1.3006-1.3115. A breakdown through this area, however, could lead to price challenging the weekly trendline support taken from the high 1.1278. In conjunction with the weekly timeframe, the daily candles also remain trading within reaching distance of a daily demand area penciled in at 1.3002-1.3041, which happens to merge beautifully with a daily trendline support taken from the low 1.2654.
Stepping across to the H4 chart, we can see that although the unit tapped highs of 1.3130 amid yesterday’s sessions, price concluded the day below the 1.31 handle. Should 1.31 hold ground as resistance today, the H4 mid-way support at 1.3050 will likely be the next area on the hit list, followed closely by a H4 Quasimodo support at 1.3029 and then the key figure 1.30.
Our suggestions: Seen within the two aforementioned higher-timeframe demands marked above in bold is a H4 Quasimodo support at 1.3029. Although this level boasts attractive higher-timeframe confluence, we must also take into account that this level is positioned nearby the 1.30 mark – a hurdle that is likely being watched by the majority of the market. Does this mean we should ignore longs from the H4 Quasimodo formation? No! What it does mean though is that in order to buy from this H4 base, one might (to be on the safe side) want to consider setting stops beyond the 1.30 level.
Since we can find no logical areas for stop-loss placement beyond 1.30, we’ll wait for H4 candle confirmation before deciding whether or not to buy from here.
Data points to consider: 4th quarter Advance GDP print from the US, along with US durable goods orders at 1.30pm GMT.
Levels to watch/live orders:
- Buys: 1.3029 region ([a reasonably sized H4 bull candle will need to be seen from here before a trade can be executed] stop loss: ideally beyond the trigger candle).
- Sells: Flat (stop loss: N/A).
USD/CHF
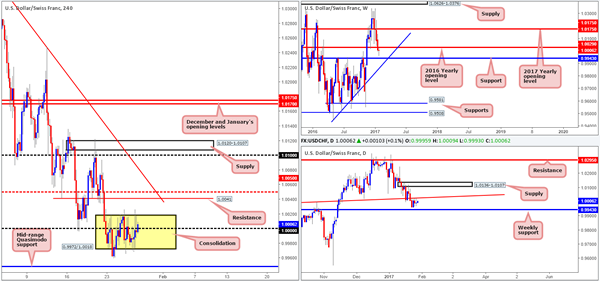
Since the beginning of the week, the H4 candles have been chiseling out a H4 consolidation zone fixed at 0.9972/1.0018, which, as you can see, also houses parity (1.0000). Beyond the top edge of this range sits a H4 resistance at 1.0041, shadowed closely by the H4 mid-way resistance at 1.0050. A breakout south of this consolidation, however, will place the H4 mid-range Quasimodo support at 0.9948 in the firing range.
Over on the weekly chart, price is seen hovering just ahead of the 2016 yearly opening level at 1.0029. Providing that this line is stable, the next area of interest can be seen at 0.9943: a weekly support level positioned just a few pips beneath the above said H4 mid-range Quasimodo support. Turning our attention to the daily candles, the daily trendline resistance taken from the high 0.9956 continues to cap upside, which could eventually lead to a decline down to the aforementioned weekly support level.
Our suggestions: Should the market decide to pierce through the lower edge of the current H4 consolidation today, one could look to enter long at the mid-range H4 Quasimodo support level at market (given its relationship with weekly price) since stops can comfortably be placed beyond the apex low (0.9929) at 0.9927.
In addition to this, shorts could also be considered from the H4 resistance 1.0041, as it’s located nearby both the 2016 yearly opening level and daily trendline resistance. Be that as it may, there’s a good chance that price could whipsaw through this H4 level and quite possibly the H4 1.0050 level as well. With that, we would not advise entering at market from here. Instead, wait for a lower-timeframe confirming sell setup to form. This could be either a break of demand followed by a retest as supply, a trendline break/retest or simply a collection of well-defined selling wicks seen positioned around the H4 level. We typically search for lower-timeframe confirmation between the M15 and H1 timeframes, since most of our higher-timeframe areas begin with the H4. Stops are usually placed 3-5 pips beyond confirming structures.
Data points to consider: 4th quarter Advance GDP print from the US, along with US durable goods orders at 1.30pm GMT.
Levels to watch/live orders:
- Buys: 0.9949 ([possible level to look at buying from without the need for additional confirmation] stop loss: 0.9927).
- Sells: 1.0041 region ([wait for a lower-timeframe confirming setup to form before looking to execute a trade] stop loss: dependent on where one confirms this area).
DOW 30
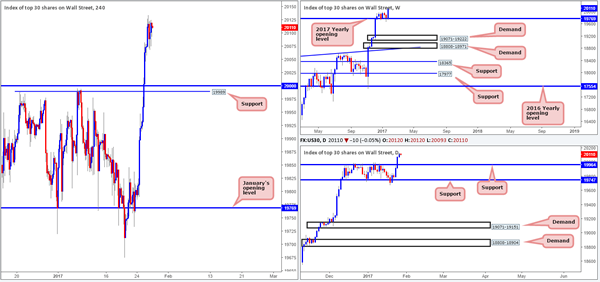
US equities rose 46 points (open/close) to record highs of 20134 yesterday, following Wednesday’s advance beyond the 20000 level. This, as you can see, marks the unit’s third consecutive daily gain this week, and with absolutely no resistance levels in sight, the market could potentially continue rallying north from here.
As a result of this movement, we feel the DOW has entered into a ‘buy-the-dip’ phase. In other words look to buy on market pullbacks. The closest support at the moment is the 20000 neighborhood, which is reinforced by H4 support at 19989 and a daily support drawn in at 19964.
Our suggestions: As things stand, unless the DOW pulls back to retest 20000 today, we may have to place this piece on the back burner for now.
Data points to consider: 4th quarter Advance GDP print from the US, along with US durable goods orders at 1.30pm GMT.
Levels to watch/live orders:
- Buys: Flat (stop loss: N/A).
- Sells: Flat (stop loss: N/A).
GOLD
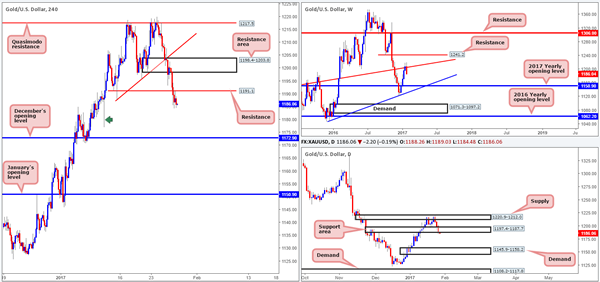
Beginning with the weekly timeframe this morning, we can see that the current weekly candle looks on course to end the week in negative territory, potentially breaking a four-week bullish phase and forming a bearish engulfing candle. The next downside target to have an eyeball on comes in at 1150.9: the 2017 yearly opening level. The story on the daily chart, however, shows that price action recently pierced below a daily support area coming in at 1197.4-1187.7, which could lead to further selling down to daily demand drawn in at 1145.9-1158.2.
Jumping across to the H4 candles, the H4 Quasimodo support level at 1191.1 was taken out going into yesterday’s London lunchtime, which, as you can see, has since been retested as resistance. The long H4 tail seen marked with a green arrow at 1177.8 is interesting, since this likely indicates demand consumption, thus opening the road south to December’s opening level at 1172.9 today.
Our suggestions: In view of this analysis, we maintain a fairly pessimistic outlook for the yellow metal today. To take advantage of this potential move, we’d look to enter short around the 1186.5 neighborhood and place stops at 1191.8, just above the current H4 resistance.
Levels to watch/live orders:
- Buys: Flat (stop loss: N/A).
- Sells: 1186.5 region ([market entry] stop loss: 1191.8).
Asian Market Update: Japan CPI Tracking In Right Direction
Japan CPI tracking in right direction
Asia Mid-Session Market Update: Japan CPI tracking in right direction; Investors contemplate risks of US protectionism
US Session Highlights
(US) DEC PRELIMINARY WHOLESALE INVENTORIES M/M: 1.0% V 0.1%E
(US) DEC ADVANCE GOODS TRADE BALANCE: -$65.0 V -$65.3BE
(US) INITIAL JOBLESS CLAIMS: 259K V 247KE; CONTINUING CLAIMS: 2.10MM V 2.04ME
(US) JAN PRELIMINARY MARKIT SERVICES PMI: 55.1 V 54.4E (highest since Nov 2015); composite PMI: 55.4 v 54.1 prior
(US) DEC NEW HOME SALES: 536K V 588KE
(GR) EU official: the Greek bailout review is not making progress; creditors have asked Greece for more austerity beyond 2018 - press
(MX) Mexico Pres Pena Nieto has canceled White House meeting over disagreement around border wall - press
US markets on close: Dow +0.8%, S&P500 -0.1%, Nasdaq flat
Best Sector in S&P500: Financials
Worst Sector in S&P500: Healthcare
Biggest gainers: URI +11.2%, RCL +9.1%, LUV +9.0%, SHW +7.6%, CHTR +7.4%
Biggest losers: MAT -17.7%, WHR -8.6%, MCK -8.3%, FFIV -8.3%, HP -7.4%
At the close: VIX 10.6 (-0.2pts); Treasuries: 2-yr 1.23% (-1bps), 10-yr 2.51% (-1bps), 30-yr 3.09% (-2bps)
US movers afterhours
SMCI Reports Q2 $0.48 v $0.47e, R$652M v $614Me; +9.8% afterhours
WYNN Reports Q4 $0.50 v $0.67e, R$1.30B v $1.25Be; CEO: occupancy in Macau is 'right on target,' even a little ahead of occupancy expectations at the Wynn Macau Palace; +6.8% afterhours
VMW Reports Q4 $1.43 v $1.40e, R$2.03B v $1.99Be; Adds $1.2B to buyback plan (3% of market cap); +3.9% afterhours
KLAC Reports Q2 $1.52 v $1.41e, R$877M v $838Me; +3.3% afterhours
MSFT Reports Q2 $0.83 v $0.79e, R$26.1B (adj) v $25.2Be; +1.4% afterhours
INTC Reports Q4 $0.79 v $0.76e, R$16.4B v $15.8Be; +0.1% afterhours
PYPL Reports Q4 $0.42 v $0.42e, R$2.98B v $2.97Be; -0.6% afterhours
GOOGL Reports Q4 $9.36 v $9.63e, R$26.0B (includes $4.85B TAC) v $25.2Be; Google ad Rev $22.4B v $19.1B y/y; -2.1% afterhours
SBUX Reports Q1 $0.51 v $0.52e, R$5.73B v $5.83Be; -4.0% afterhours
JNPR Reports Q4 $0.66 v $0.63e, R$1.39B v $1.36Be; Guides Q1 $0.38-0.44 v $0.46e; -8.2% afterhours
Asia Key economic data:
(JP) JAPAN DEC NATIONAL CPI Y/Y: 0.3% (10-month high) V 0.2%E; CPI EX FRESH FOOD (CORE) Y/Y: -0.2% V -0.3%E
(JP) JAPAN JAN TOKYO CPI Y/Y: 0.1% V 0.0%E; CPI EX-FRESH FOOD Y/Y: -0.3% (9-month high) V -0.4%E
(AU) AUSTRALIA Q4 PPI Q/Q: 0.5% (6-quarter high) V 0.3% PRIOR; Y/Y: 0.7% V 0.5% PRIOR
(AU) AUSTRALIA Q4 IMPORT PRICE INDEX Q/Q: 0.2% (5-quarter high) V 0.4%E; EXPORT PRICE INDEX Q/Q: 12.4% (6 1/2 year high) V 12.1%E
Asia Session Notable Observations, Speakers and Press
Asian indices trading mixed, tracking more neutral sentiment on Wall St, as investors contemplate the most adversarial and protectionist stance taken by the Trump White House against Mexico. Volumes are also lighter, with the mainland China and Korea's Kospi closed ahead of the Lunar New Year. Australia is outperforming with a catch-up rally after yesterday's holiday, though the losses in mining shares are keeping the rally contained.
FX majors are also flattish in narrow ranges with the exception of USD/JPY, which tested 115 handle after BOJ's regular operation expanded the purchases of 5-10yr JGBs.
Going into next week's BOJ decision, today's CPI data should give the central bank some comfort that price pressure is moving in the right direction - National headline CPI and Tokyo core CPI saw 10-month and 9-month high prints - even though the 2% target remains distant. Speaking in Parliament, PM Abe is tempering optimism, stating Japan has not yet emerged from deflation; Abe also said he will impart the importance of TPP on US president Trump, but that he also would not rule out a bilateral trade deal.
Political transition will remain in focus on Friday, as Trump meets UK PM May; US initial Q4 GDP numbers and durable goods figures also on tap.
China
(DE) German Chancellor Merkel and China Premier Li call for resolution of investment accord between the two countries - financial press
(CN) NDRC: Profits of China's 373 steel companies to reach CNY35B in 2016 v loss CNY84.7B - Chinese press
Japan:
(JP) Japan Chief Cabinet Sec Suga: to closely watch impact on local companies from US and Mexico relationship
(JP) Japan PM Abe: Japan not yet emerged from deflation
Australia
(AU) Goldman Sachs economist Toohey: Australia Q4 CPI implies that price pressures have troughed - AFR
Asian Equity Indices/Futures (23:30ET)
Nikkei +0.3%, Hang Seng -0.1%, Shanghai Composite closed, ASX200 +0.7%, Kospi closed
Equity Futures: S&P500 -0.1%; Nasdaq flat; Dax -0.1%; FTSE100 -0.1%
FX ranges/Commodities/Fixed Income (23:30ET)
EUR 1.0660-1.0690; JPY 114.40-115.00; AUD 0.7525-0.7545; NZD 0.7230-0.7250
Feb Gold -0.5% at $1,183/oz; Mar Crude Oil flat at $53.78/brl; Mar Copper +0.1% at $2.67/lb
iShares Silver Trust ETF daily holdings fall to 10,420 tonnes from 10,494 tonnes prior; lowest since July 2016
(JP) BOJ offers to buy ¥400B in 1-3yr JGBs, ¥420B in 3-5yr JGBs, ¥450B (¥410B prior) in 5-10yr JGBs and ¥1.25T in T-bills
(AU) Australia MoF (AOFM) sells A$700M in 2.25% 2028 Bonds; avg yield: 2.8995%; bid-to-cover: 2.91x
Asia equities/Notables/movers by sector
Consumer discretionary: 1128.HK Wynn Macau +2.6% (Q4 result); 3099.JP Isetan Mitsukoshi +0.2% (9-month result)
Consumer staples: WOW.AU Woolworths +2.2% (JPMorgan raises rating)
Financials: 966.HK China Taiping Insurance -0.1% (profit warning); CHC.AU Charter Hall Group +1.9% (Citi raises rating); 8616.JP Tokai Tokyo Financial Holdings Inc -1.7% (9-month result)
Industrials: 232.HK AVIC International Holding -3.9% (profit warning); 6501.JP Hitachi -0.1% (9-month result); 7312.JP Takata Corp -7.6% (momentum)
Technology: 6502.JP Toshiba Corporation +2.3% (confirms to split memory chip business)
Materials: 2168.HK Yingde Gases +0.2% (removal of directors); EVN.AU Evolution Mining -7.1%, NST.AU Northern Star Resources -4.8%, MIN.AU Mineral Resources -4.7% (gold declines); PRU.AU Perseus Mining -20.2% (Q2 result)
USD/JPY: Extending Recovery From The 102.53 Low To Reach The 115.00 Level
EUR/USD
Steadied at the 1.0658 low though break of the 1.0700 level see risk for deeper pullback to retrace the 4-wk upleg from 1.0341 low. Lower will see scope to the 1.0620/1.0580 area. Upside seen limited with resistance now at the 1.0711/19 area then the 1.0775 high. [PL]
USD/CHF
Steady in range above the .9960 low though consolidation tracing out a flag pattern and see risk for break lower to trigger further decline to the .9929/00 area then the 200-day MA at .9870. Recent lows at 1.0045 and the 1.0064/87 area now resistance. Would need lift over the latter to fade downside pressure. [PL]
USD/JPY
Extending recovery from the 102.53 low to reach the 115.00 level, lift over this will see further strength to target the 115.62 high of last week. Above the latter will confirm a double bottom at the 112.57/53 lows and trigger stronger recovery to the 116.00 level. Support now at 113.99 then 113.00 level. [PL]
EUR/CHF
Saw sharp drop through the 1.0700 level to take out the 1.0680 low before finding traction at 1.0670 low. Risk now seen for retest of the 1.0624 low of last year to extend the broader decline from 1.0900, Dec high. Resistance now at the 1.0700 level then the 1.0751/62 highs. [PL]
GBP/USD
Spurred by the appearance of a Spinning-top last session, intraday trade a touch softer in consolidation and only deeper break of 1.2490 support to turn current upmove around. Lift above yesterday's high of 1.2673 will see 1.2775 hurdle targeted. [W.T]
EUR/GBP
Follow-through below the .8500 level extending the drop from the .8854 high and see strong support at .8450 now within reach. Below this will see the 200-day MA coming into play at .8409. Failure here will return focus to the .8333 and .8305, Dec lows. [PL]
AUD/USD: Aussie Trading On A Stronger Footing This Morning
For the 24 hours to 23:00 GMT, the AUD declined 0.59% against the USD and closed at 0.7525.
LME Copper prices rose 0.4% or $23.0/MT to $5890.0/MT. Aluminium prices declined 0.6% or $11.5/MT to $1837.5/MT.
In the Asian session, at GMT0400, the pair is trading at 0.7532, with the AUD trading 0.09% higher against the USD from yesterday’s close.
The pair is expected to find support at 0.7507, and a fall through could take it to the next support level of 0.7482. The pair is expected to find its first resistance at 0.7567, and a rise through could take it to the next resistance level of 0.7602.
Next week, market participants will concentrate on Australia’s AiG performance of manufacturing and services indices, trade balance, NAB business confidence and building permits data.
The currency pair is showing convergence with its 20 Hr moving average and trading below its 50 Hr moving average.

EUR/USD: German Consumer Sentiment Improved In February
For the 24 hours to 23:00 GMT, the EUR declined 0.65% against the USD and closed at 1.0677.
On the economic front, Germany’s GfK consumer confidence index rose to a level of 10.2 in February, escalating to a five-month high level, thus reaffirming that household spending will continue to propel growth in the first quarter of 2017. Meanwhile, markets expected for a rise to a level of 10.0, following a level of 9.9 in the previous month.
The US Dollar gained ground against its major peers, after data indicated that the US flash Markit services PMI rose to a level of 55.1 in January, expanding at its fastest pace in 14-months, thus pointing to a robust activity in services sector at the start of 2017. The PMI had registered a reading of 53.9 in the previous month, while market anticipated for an advance to a level of 54.4. Also, the nation’s flash wholesale inventories gained 1.0% on a monthly basis in December, higher than market expectations for an advance of 0.1% and following a similar rise in the prior month. Moreover, the CB leading indicator increased 0.5% in December, above market expectations of 0.2% gain. In the prior month, leading indicator had recorded a revised rise of 0.1%. Meanwhile, the nation’s goods trade deficit narrowed less-than-expected to a level of $65.0 billion in December, amid a pickup in exports and following a deficit of $65.3 billion in the previous month. On the other hand, the nation’s initial jobless claims climbed more-than-expected to a four-week high level of 259.0K in the week ended 21 January 2017, compared to a level of 234.0K in the prior week, while investors were anticipating initial jobless claims to advance to a level of 247.0K. Further, the nation’s new home sales plummeted to a ten-month low level, after it dropped 10.4%, to a level of 536.0K MoM in December, compared to market expectations for it to ease to a level of 588.0K and following a revised reading of 598.0K in the previous month.
In the Asian session, at GMT0400, the pair is trading at 1.0674, with the EUR trading a tad lower against the USD from yesterday’s close.
The pair is expected to find support at 1.0632, and a fall through could take it to the next support level of 1.0590. The pair is expected to find its first resistance at 1.0739, and a rise through could take it to the next resistance level of 1.0804.
Going ahead, investors will look forward to Germany’s import price index for December, scheduled to release in a few hours. Moreover, the US flash annualised GDP for 4Q, durable goods orders for December and final Michigan consumer sentiment index for January, all slated to release later today, will also garner significant amount of market attention.
The currency pair is trading below its 20 Hr and 50 Hr moving averages.

GBP/USD: Britain’s Economy Grew Better Than Expected In The Fourth Quarter
For the 24 hours to 23:00 GMT, the GBP declined 0.34% against the USD and closed at 1.2590.
Macroeconomic data indicated that UK's preliminary gross domestic product (GDP) rose more-than-expected by 0.6% on a quarterly basis in 4Q 2016, as higher consumer spending led to robust economic growth in the final quarter of 2016. The GDP recorded a similar rise in the previous quarter, while investors had envisaged the nation's GDP to rise 0.5%. Additionally, the nation's BBA mortgage approvals unexpectedly climbed to a level of 43.2K in December, hitting its highest level in nine-months, compared to a revised reading of 41.0K in the prior month, whereas markets anticipated mortgage approvals to remain unchanged at 41.0K.
Meanwhile, the UK Finance Minister, Philip Hammond, stated that the economy's robust performance in the fourth quarter indicates its fundamental strength. However, he warned that uncertainty may lie ahead as the process of Brexit progresses.
In the Asian session, at GMT0400, the pair is trading at 1.2573, with the GBP trading 0.14% lower against the USD from yesterday's close.
The pair is expected to find support at 1.2527, and a fall through could take it to the next support level of 1.2481. The pair is expected to find its first resistance at 1.2646, and a rise through could take it to the next resistance level of 1.2719.
Going ahead, investors will focus on BoE's interest rate decision along with UK's Markit manufacturing and construction PMIs, consumer confidence, consumer credit and mortgage approvals data, all set to release next week.
The currency pair is showing convergence with its 20 Hr and 50 Hr moving averages.

USD/JPY: Japan’s Annual Inflation Climbed In December
For the 24 hours to 23:00 GMT, the USD rose 1.02% against the JPY and closed at 114.48.
In the Asian session, at GMT0400, the pair is trading at 114.97, with the USD trading 0.43% higher from yesterday's close.
Overnight data showed that Japan's national consumer price index (CPI) advanced more-than-expected by 0.3% on an annual basis in December, against market expectations for a rise of 0.2%. In the previous month, the CPI had climbed 0.5%.
The pair is expected to find support at 113.77, and a fall through could take it to the next support level of 112.57. The pair is expected to find its first resistance at 115.6, and a rise through could take it to the next resistance level of 116.23.
Moving ahead, next week traders will closely monitor BoJ's interest rate decision coupled with its meeting minutes. Also, Japan's unemployment rate, industrial production, final Nikkei manufacturing PMI, retail trade, large retailer's sales and consumer confidence data, will also pique investor attention.
The currency pair is trading above its 20 Hr and 50 Hr moving averages.
