Sample Category Title
USDCHF Wave Analysis
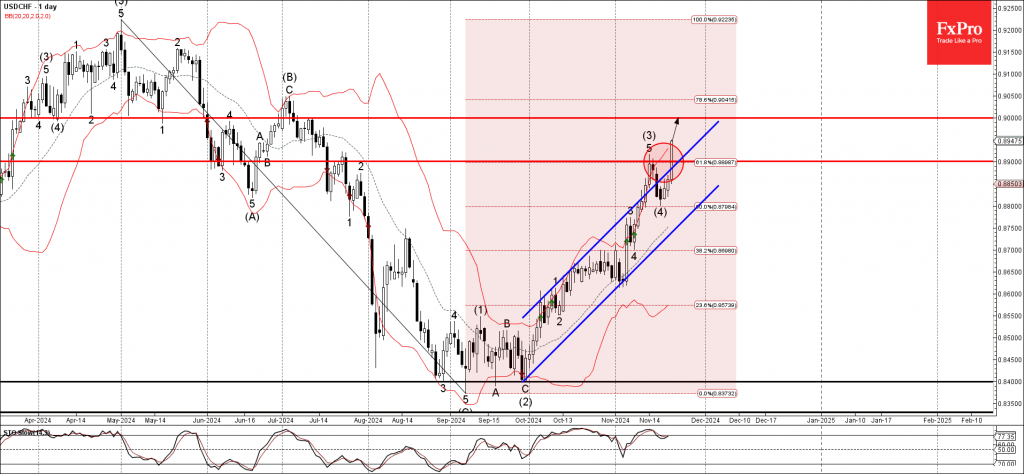
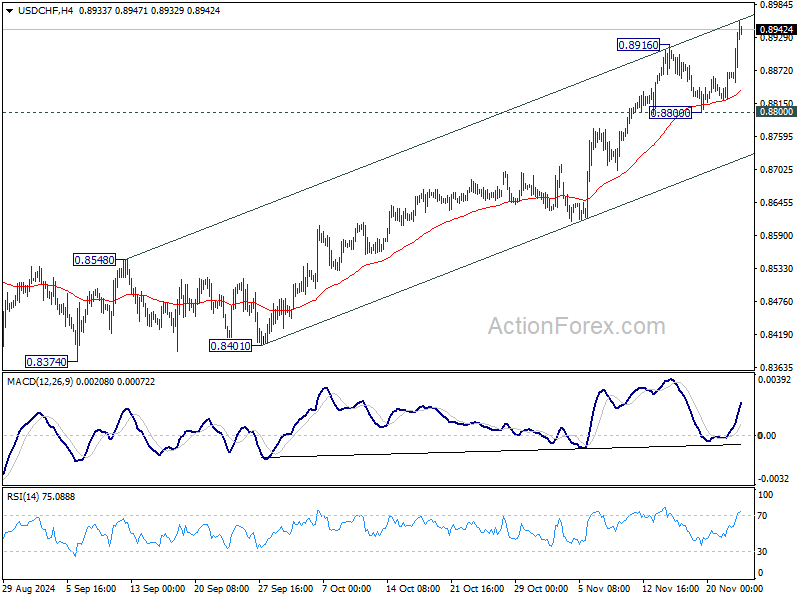
- USDCHF broke resistance zone
- Likely to rise to resistance level 0.9000
USDCHF currency pair today broke the resistance zone located between the resistance level 0.8900 (which has been reversing the price from July) and the 61.8% Fibonacci correction of the downward impulse from April.
The breakout of this resistance zone coincided with the breakout of the daily up channel from September – which accelerated the active impulse wave (5).
USDCHF currency pair can be expected to rise further to the next round resistance level 0.9000.
EUR/USD Weekly Outlook
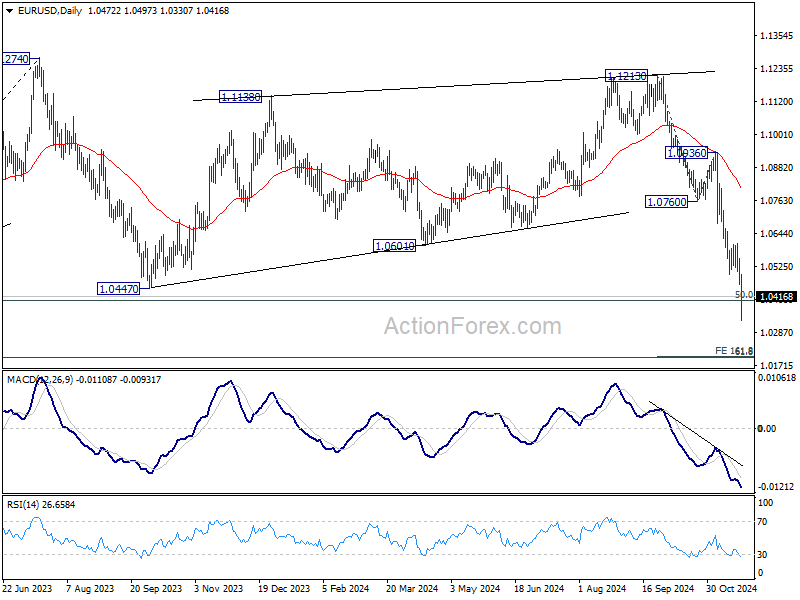
EUR/USD's decline from 1.1213 continued last week and accelerated to as low as 1.0330. There is no sign of bottoming yet and initial bias stays on the downside this week. Sustained trading below 1.0404 key fibonacci level will carry larger bearish implication and target next level at 161.8% projection of 1.1213 to 1.0760 from 1.0936 at 1.0203. Nevertheless, strong rebound from current level, followed by break of 1.0609 resistance, will indicate short term bottoming.
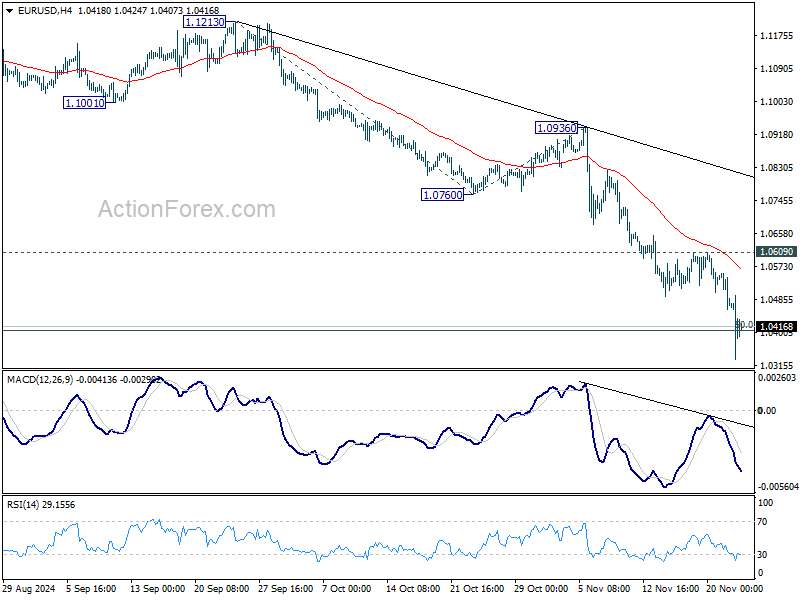
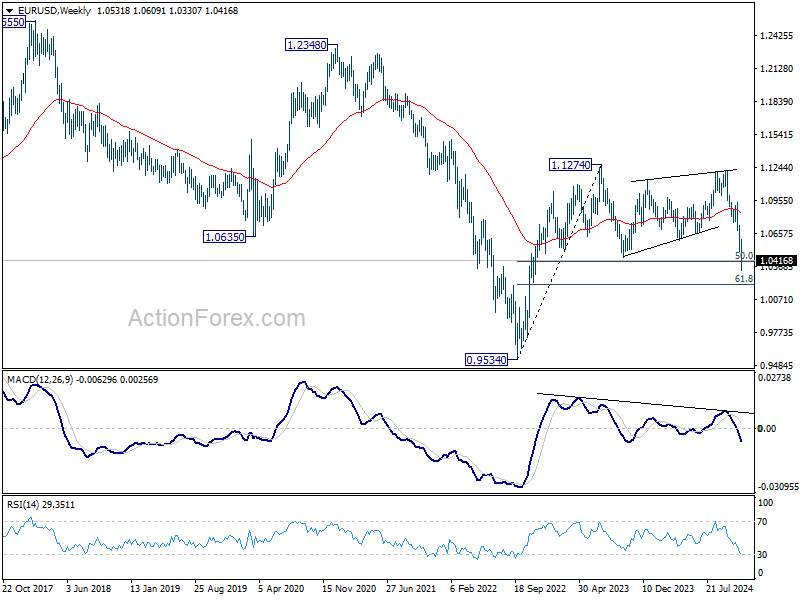
In the bigger picture, immediate focus is now on 50% retracement of 0.9534 (2022 low) to 1.1274 at 1.0404. Strong rebound from this level will keep price actions from 1.1273 (2023 high) as a medium term consolidation pattern only. However, sustained break of 1.0404 will raise the chance that whole up trend from 0.9534 has reversed. That would pave the way to 61.8% retracement at 1.0199 first. Firm break there will target 0.9534 low again.
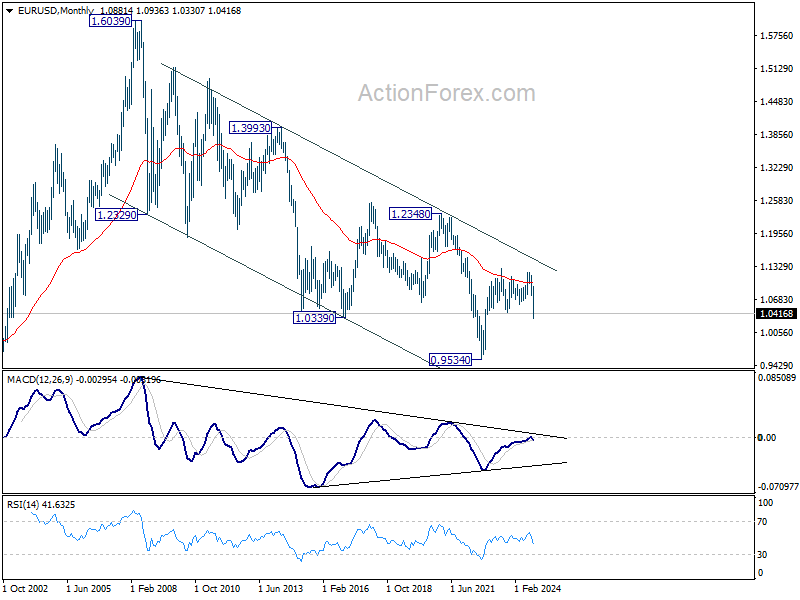
In the long term picture, down trend from 1.6039 remains in force with EUR/USD staying well inside falling channel, and upside of rebound capped by 55 M EMA (now at 1.0991). Consolidation from 0.9534 could extend further and another rising leg might be seem. But as long as 1.1274 resistance holds. downside breakout would be mildly in favor.
USD/JPY Weekly Outlook
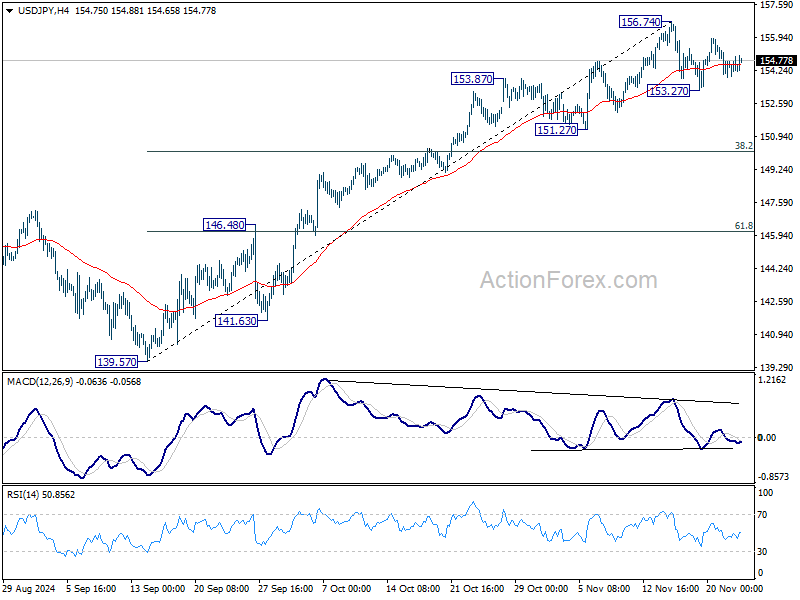
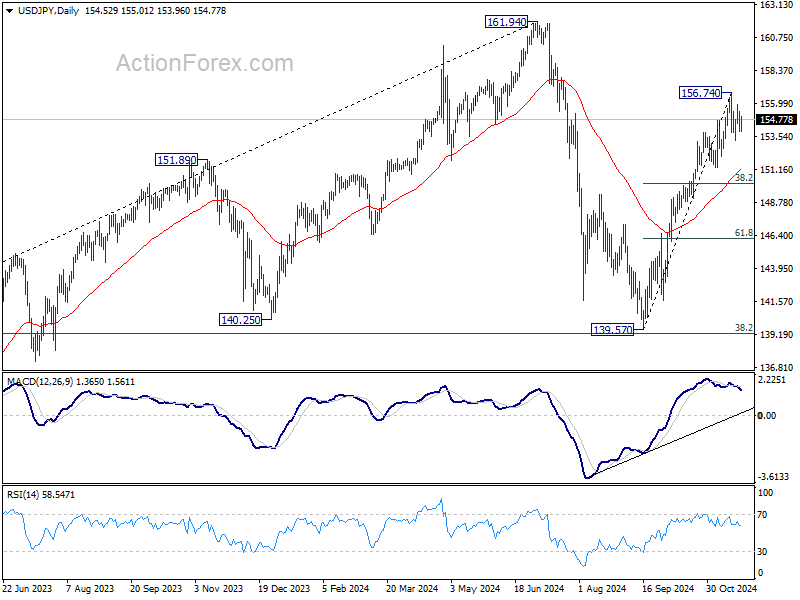
USD//JPY stayed in consolidation below 156.74 last week. and initial bias stays neutral this week first. On the downside, break of 153.27 will bring deeper correction to 38.2% retracement of 139.57 to 156.74 at 150.18. Meanwhile, on the upside, firm break of 156.74 will resume the rally from 139.57 towards 161.95 high.
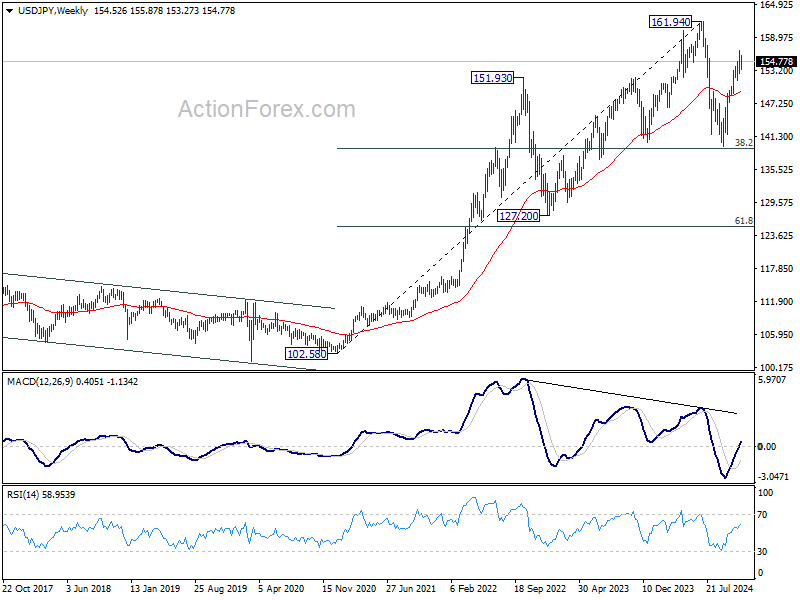
In the bigger picture, price actions from 161.94 are seen as a corrective pattern to rise from 102.58 (2021 low). The range of medium term consolidation should be set between 38.2% retracement of 102.58 to 161.94 at 139.26 and 161.94. Nevertheless, sustained break of 139.26 would open up deeper medium term decline to 61.8% retracement at 125.25.
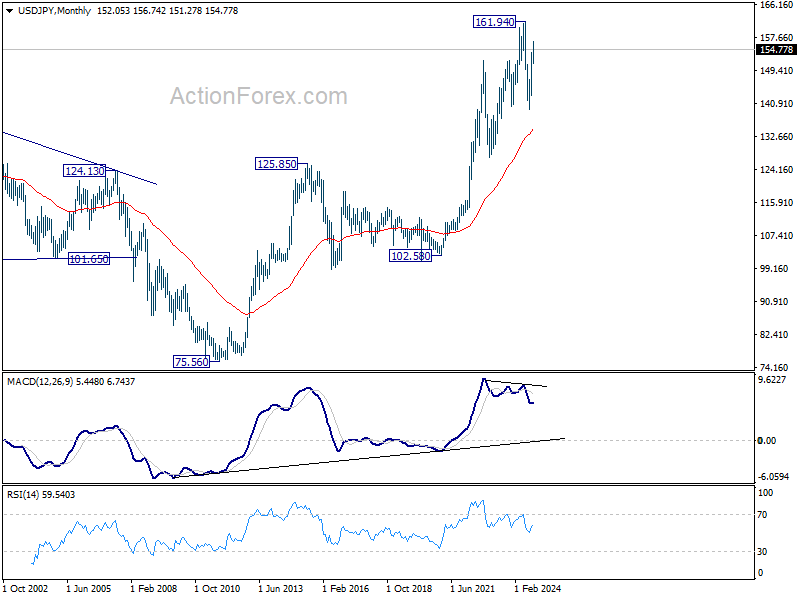
In the long term picture, it's still early to conclude that up trend from 75.56 (2011 low) has completed. However, a medium term corrective phase should have commenced, with risk of deep correction towards 55 M EMA (now at 134.54).
GBP/USD Weekly Outlook
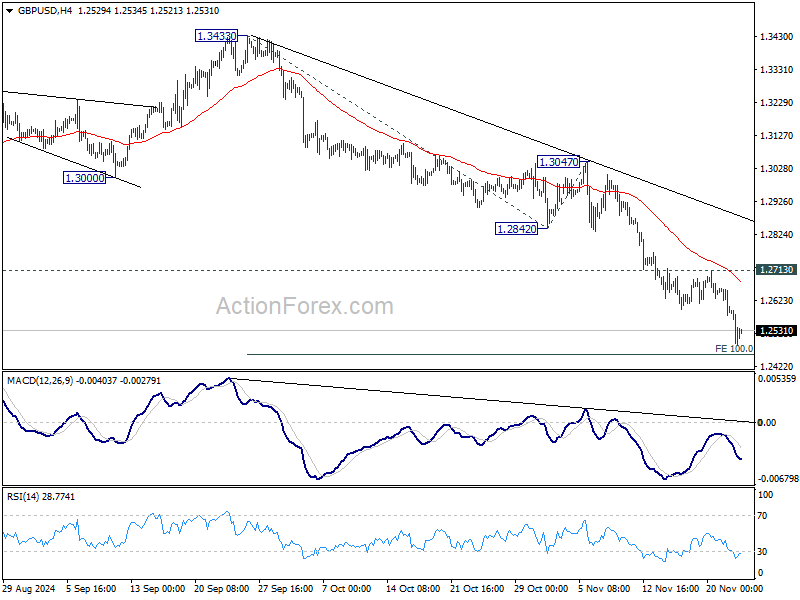
GBP/USD's fall from 1.3433 continued last week and there is no sign of bottoming yet. Initial bias stays on the downside this week for 100% projection of 1.3433 to 1.2842 to 1.3047 at 1.2456. Decisive break there will extend the fall from 1.3433 to 1.2298 cluster support zone. For now, risk will stay on the downside as long as 1.2713 resistance holds, in case of recovery.
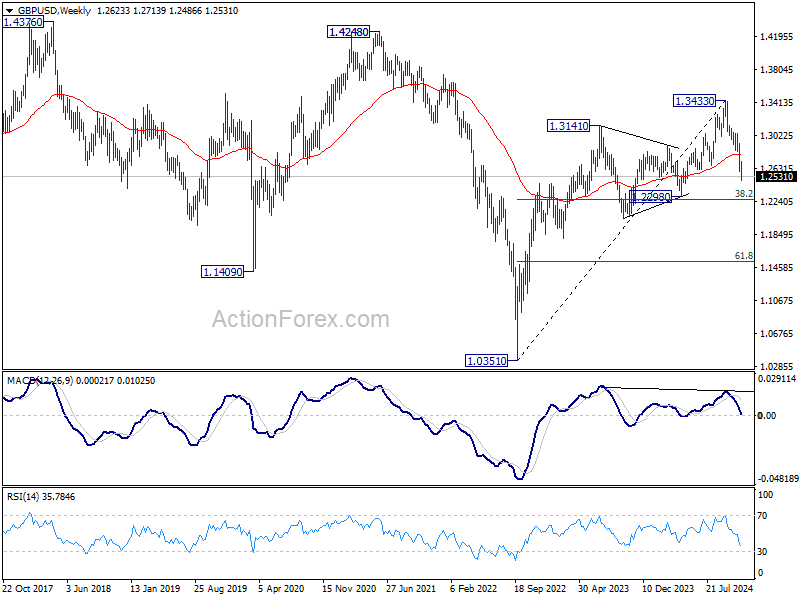
In the bigger picture, a medium term top should be in place at 1.3433, and price actions from there are correcting whole up trend from 1.0351 (2022 low). Deeper decline is now expected as long as 55 D EMA (now at 1.2918) holds, to 38.2% retracement of 1.0351 to 1.3433 at 1.2256, which is close to 1.2298 structural support. Strong support should be seen there to bring rebound.
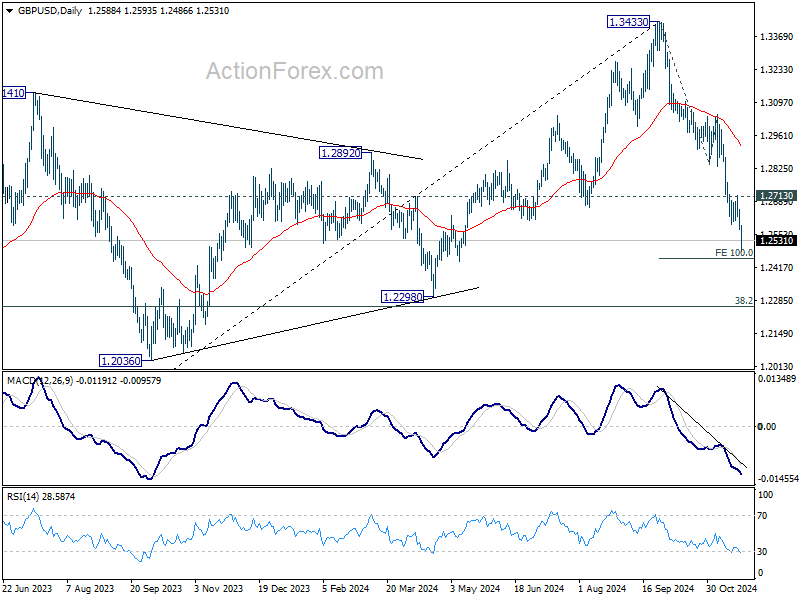
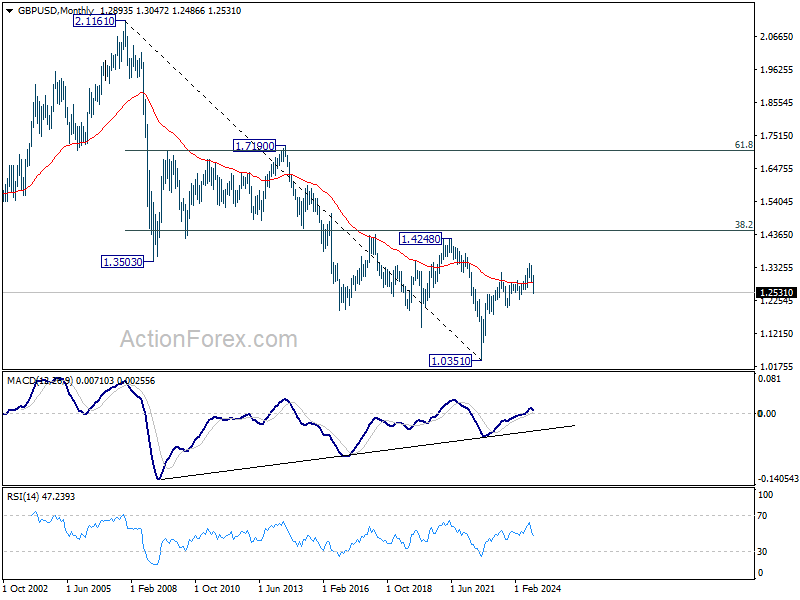
In the long term picture, as long as 1.2298 support holds, rise from 1.0351 long term bottom is expected to continue. But in any case, outlook is neutral at best as long as 1.4248 structural resistance holds.
USD/CHF Weekly Outlook
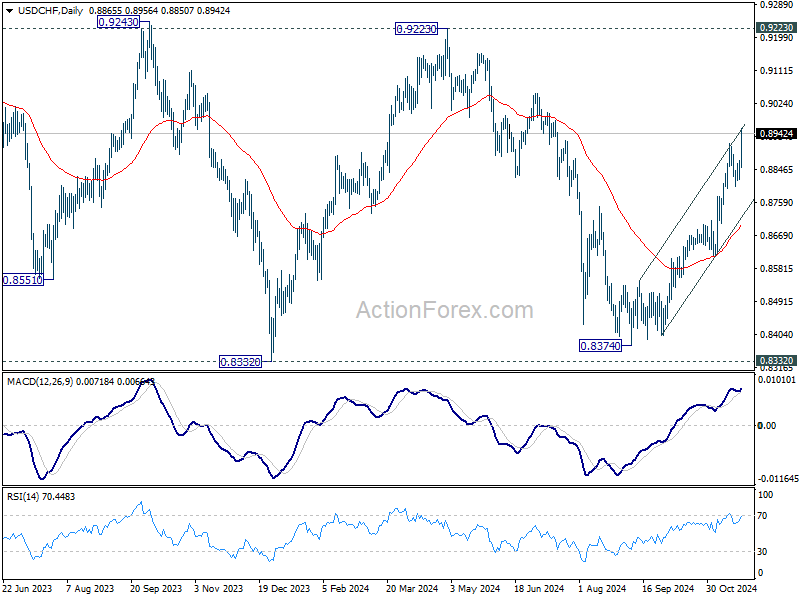
USD/CHF's rally from 0.8374 continued last week despite interim consolidations. Initial bias stays on the upside this week for further rise to 0.9223 key resistance. For now, outlook will remain bullish as long as 0.8800 support holds, in case of retreat.
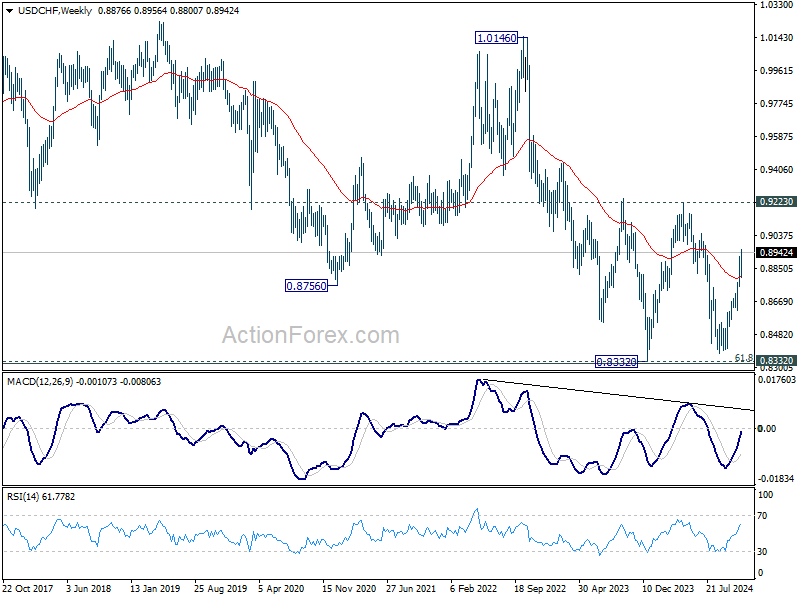
In the bigger picture, price actions from 0.8332 (2023 low) are currently seen as a medium term corrective pattern, with rise from 0.8374 as the third leg. Overall outlook will continue to stay bearish as long as 0.9223 resistance holds. Break of 0.8332 low is in favor at a later stage when the consolidation completes.
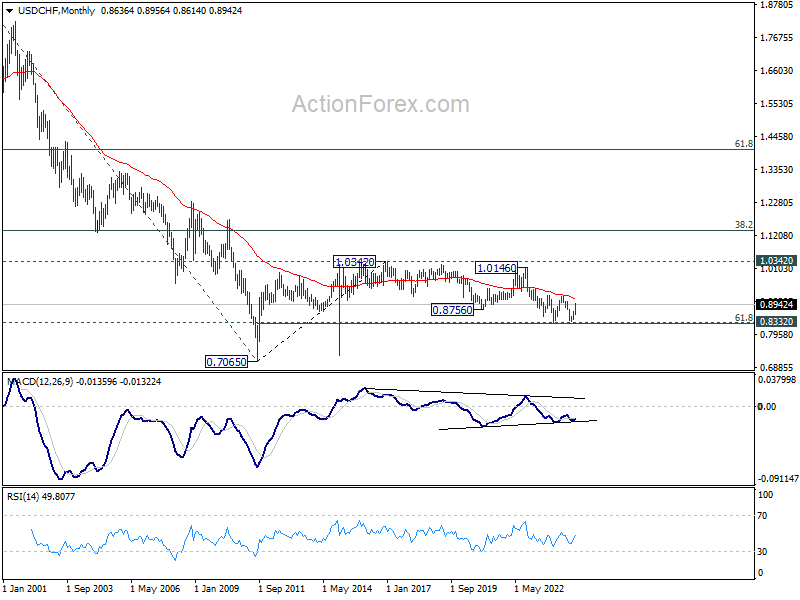
In the long term picture, price action from 0.7065 (2011 low ) are seen as a corrective pattern to the multi-decade down trend from 1.8305 (2000 high). Fall from 1.0342 (2016 high) is seen as the second leg. Rejection by 55 M EMA suggest that this fall is in progress. Break of 61.8% retracement of 0.7065 to 1.0342 at 0.8317 will pave the way back to 0.7065.
AUD/USD Weekly Report
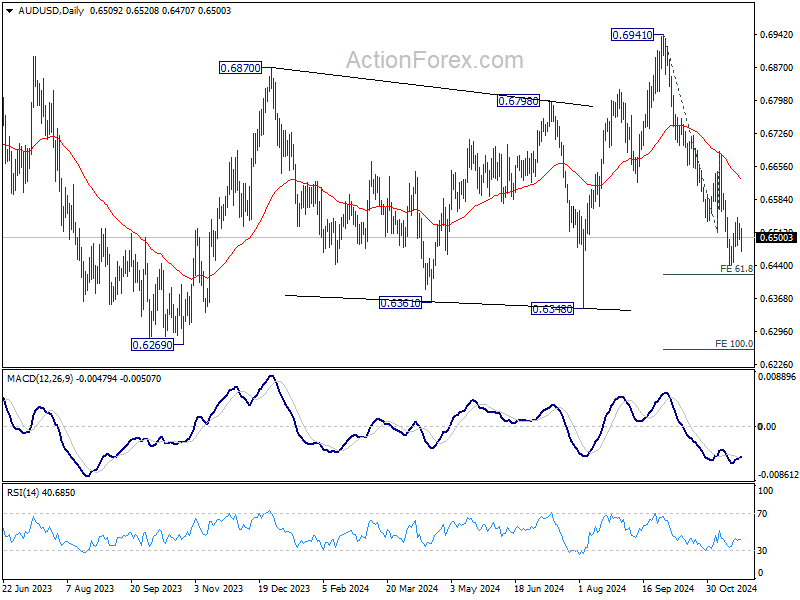
AUD/USD stayed in consolidation above 0.6440 last week and outlook is unchanged. Initial bias remains neutral this week for some more consolidations. But further decline is expected as long as 0.6687 resistance holds. On the downside, decisive break of 61.8% projection of 0.6941 to 0.6511 from 0.6687 at 0.6421 will resume the fall from 0.6941 to 100% projection at 0.6257 next.
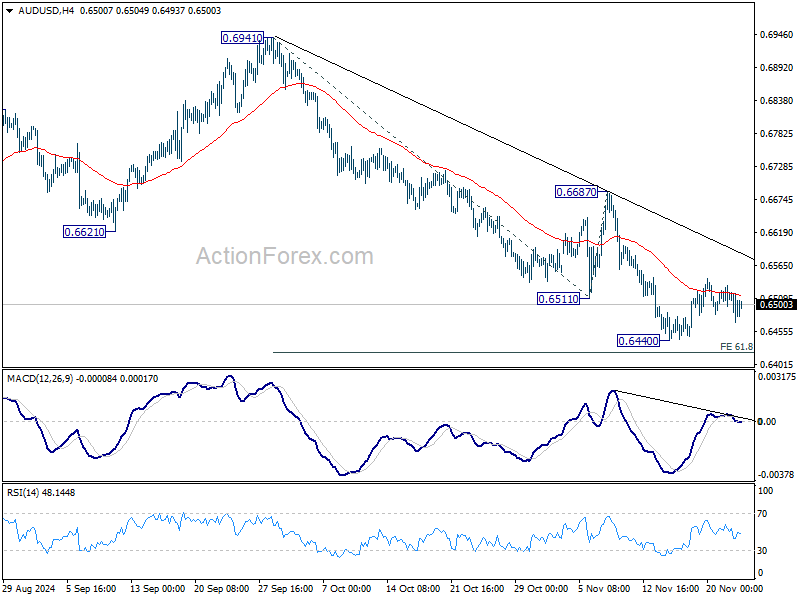
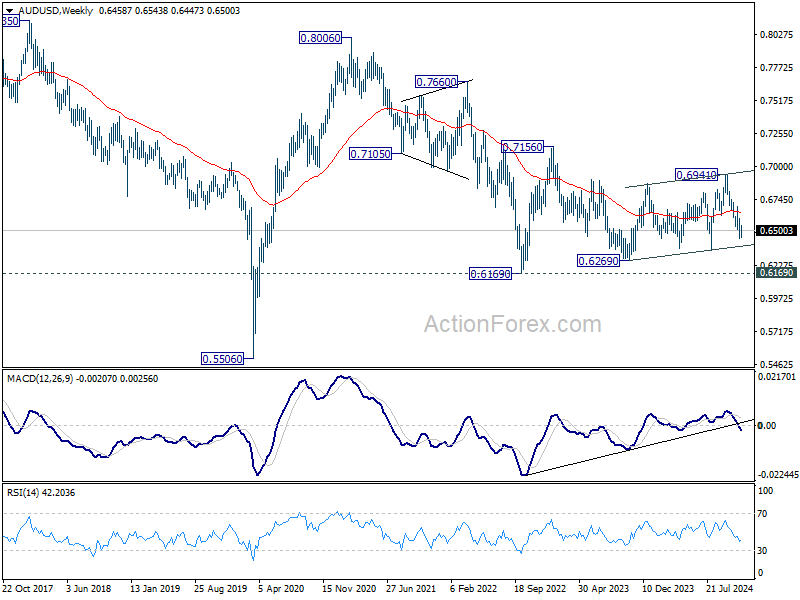
In the bigger picture, rise from 0.6269 (2023 low) should have completed with three waves up to 0.6941. Corrective pattern from 0.6169 (2022 low) is now extending with another falling leg. Deeper decline would be seen back to 0.6269 as sideway trading extends.
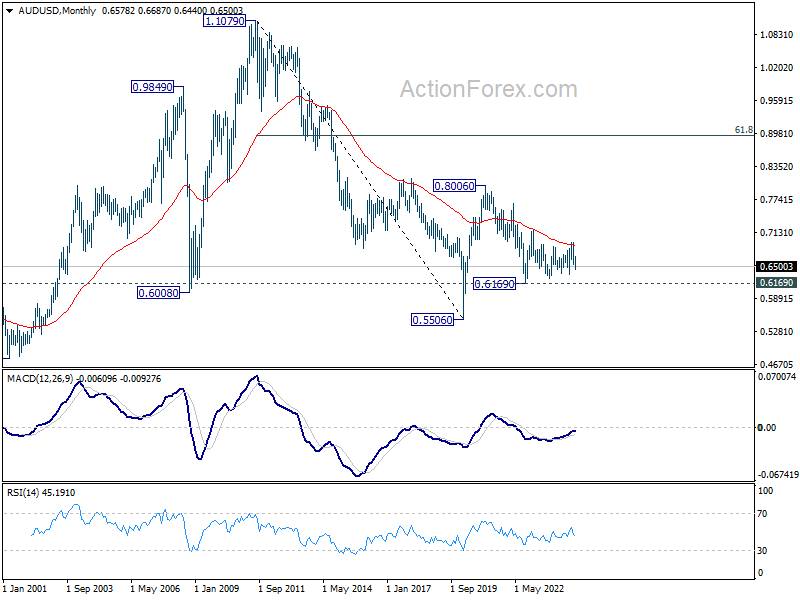
In the long term picture, the down trend from 1.1079 (2011 high) should have completed at 0.5506 (2020 low) already. It's unsure yet whether price actions from 0.5506 are developing into a corrective pattern, or trend reversal. But in either case, fall from 0.8006 is seen as the second leg of the pattern. Firm break of 0.7156 resistance will argue that the third leg has already started towards 0.8006.
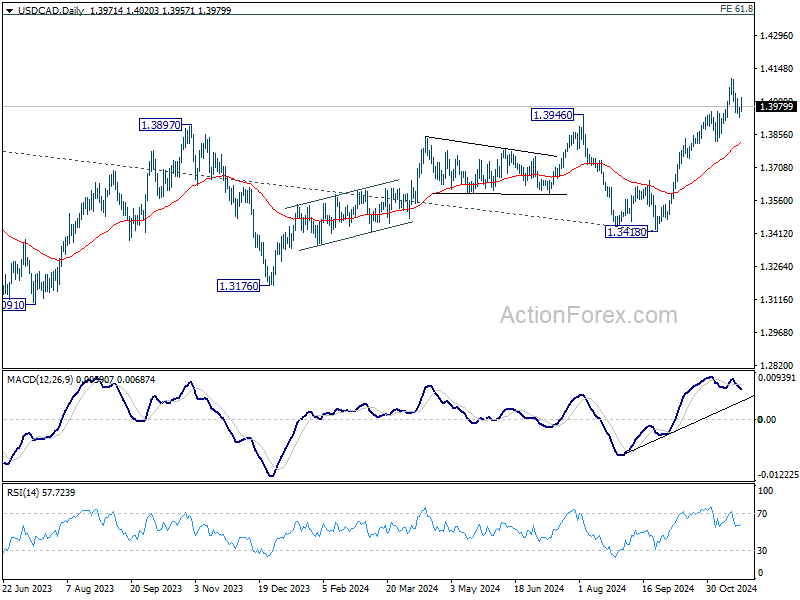
USD/CAD Weekly Outlook
USD/CAD stayed in consolidation last week and outlook is unchanged. Initial bias remains neutral this week first. On the upside, above 1.4035 minor resistance will bring retest of 1.4104 high. Firm break there will resume larger up trend. On the downside, below 1.3930 will extend the correction to 1.3841 cluster support (38.2% retracement of 1.3418 to 1.4104 at 1.3842).
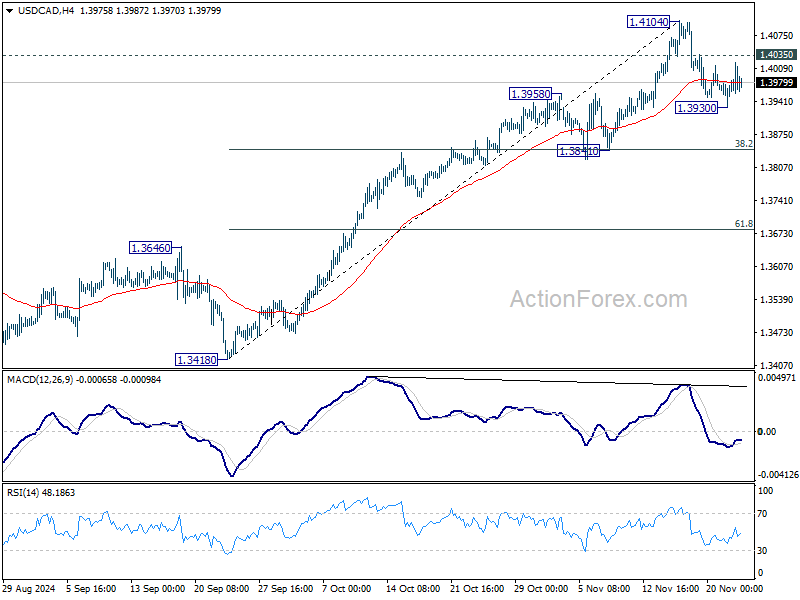
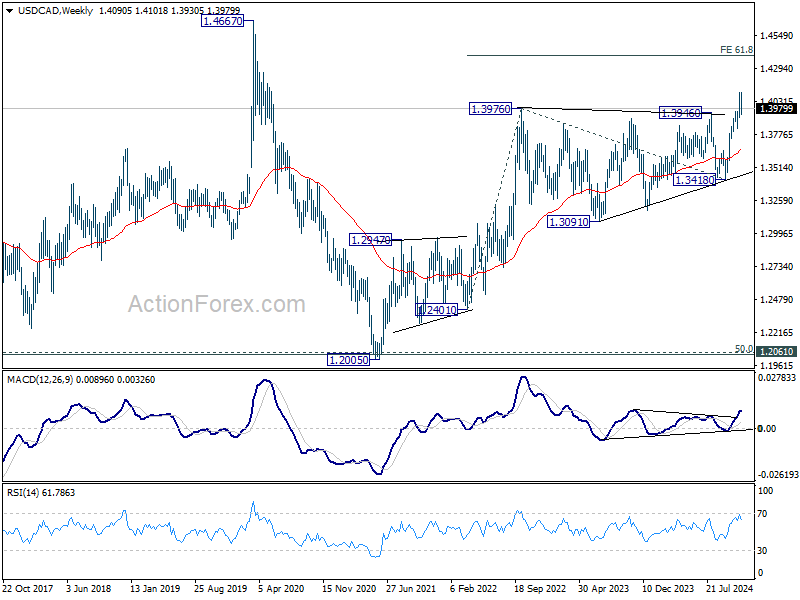
In the bigger picture, up trend from 1.2005 (2021) in in progress. Next target is 61.8% projection of 1.2401 to 1.3976 from 1.3418 at 1.4391. Now, medium term outlook will remain bullish as long as 1.3418 support holds, even in case of deep pullback.
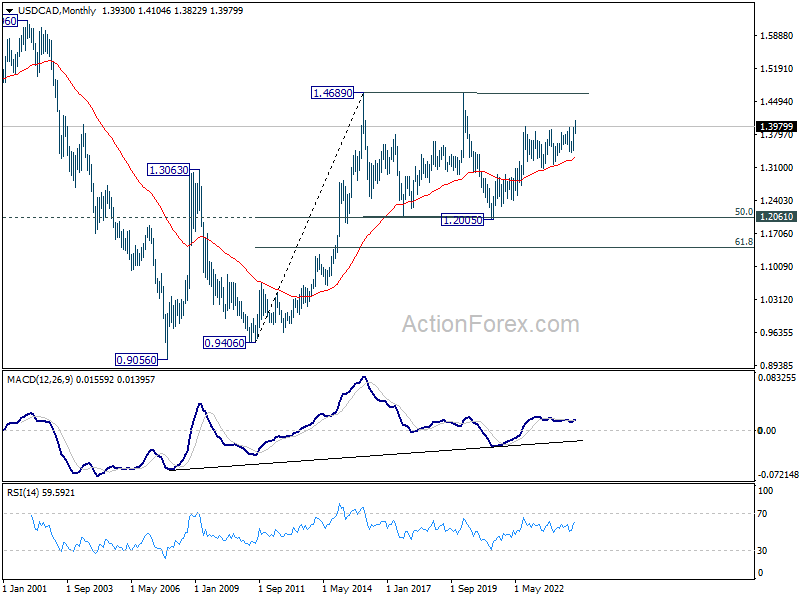
In the longer term picture, price actions from 1.4689 (2016 high) are seen as a consolidation pattern, which might have completed at 1.2005. That is, up trend from 0.9506 (2007 low) is expected to resume at a later stage. This will remain the favored case as long as 1.3418 support holds.
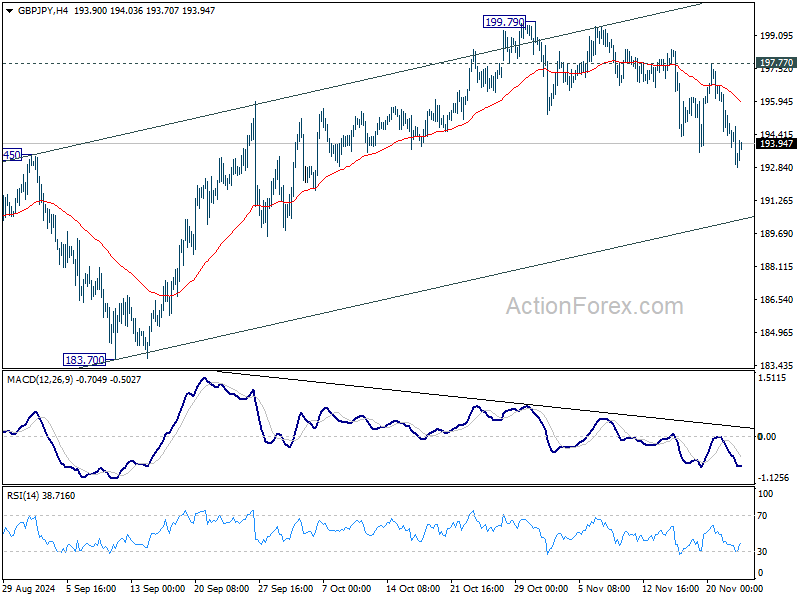
GBP/JPY Weekly Outlook
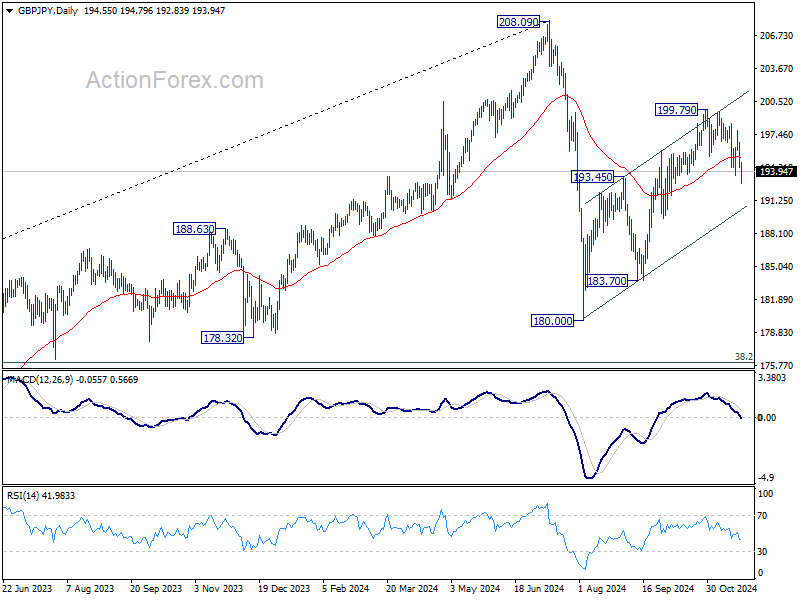
GBP/JPY's fall from 199.79 extended lower last week despite interim rebound. Current development suggests that corrective rise from 180.00 has completed with three waves up to 199.79. Initial bias is on the downside this week for 183.70 support. For now, risk will stay on the downside as long as 197.77 resistance holds, in case of recovery.
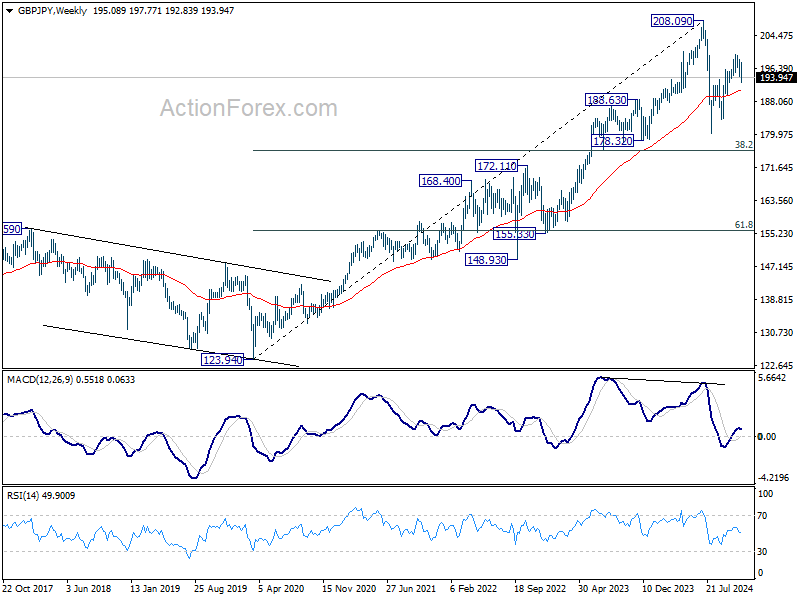
In the bigger picture, price actions from 208.09 are seen as a correction to whole rally from 123.94 (2020 low). The range of consolidation should be set between 38.2% retracement of 123.94 to 208.09 at 175.94 and 208.09. However, decisive break of 175.94 will argue that deeper correction is underway.
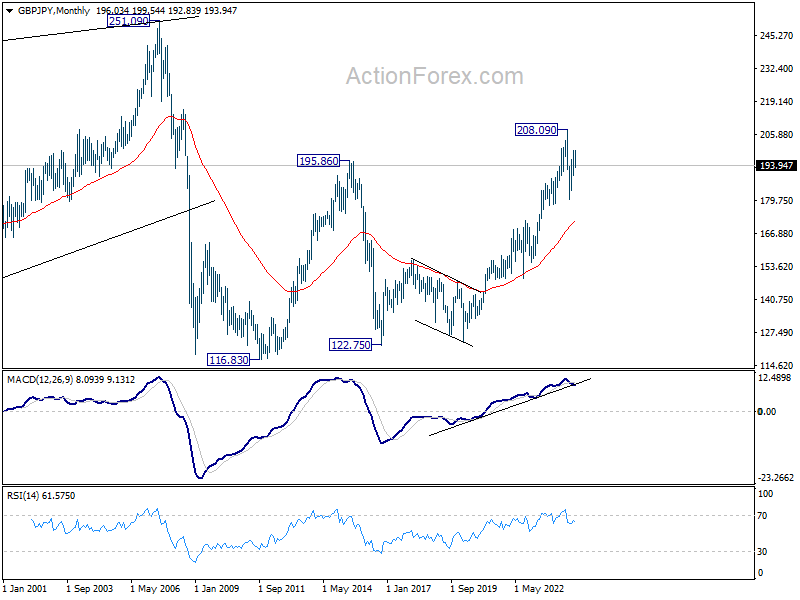
In the longer term picture, considering bearish divergence condition in W MACD, 208.09 is at least a medium term top. It's still early to conclude that the up trend from 122.75 (2016 low) has completed. But it's at least in a medium term corrective phase, with risk of correction to 55 M EMA (now at 172.07).
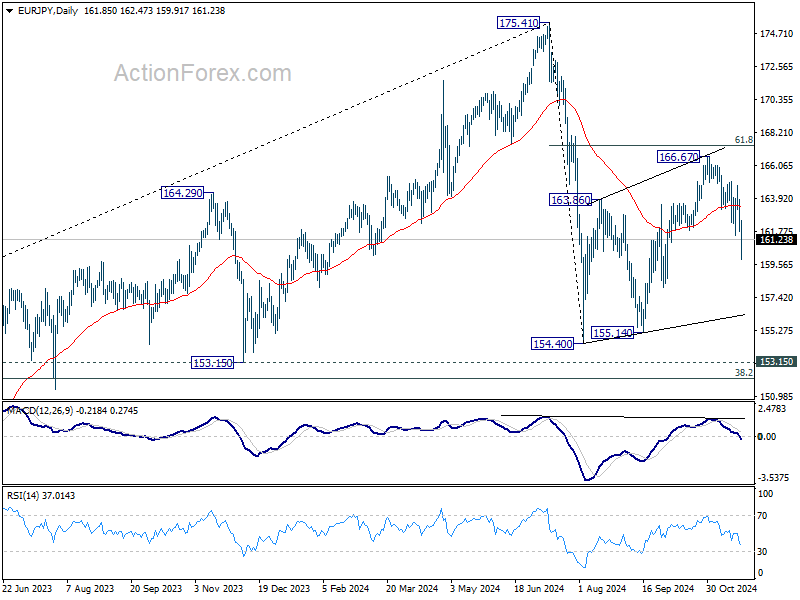
EUR/JPY Weekly Outlook
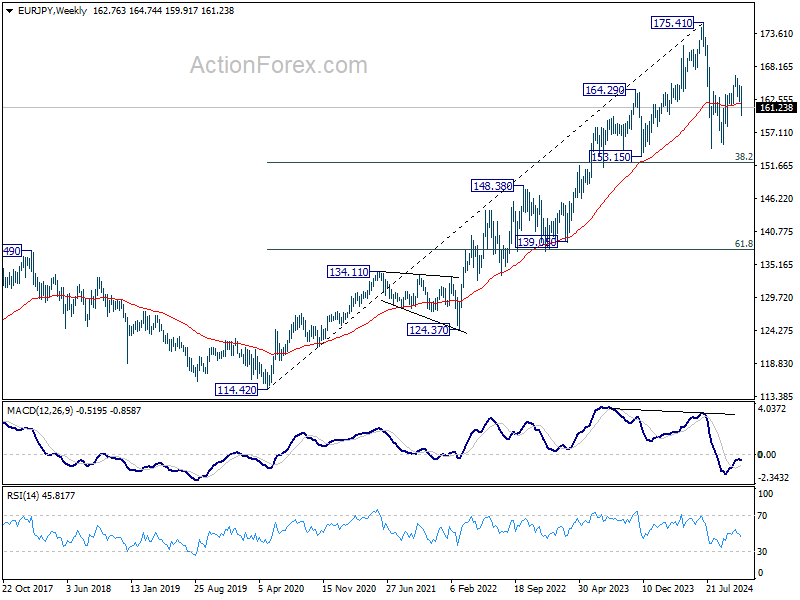
EUR/JPY's decline from 166.67 extended lower last week despite interim rebound. Current development suggests that corrective rebound from 154.40 has completed with three waves up to 166.67. Initial bias is now on the downside this week for 155.14 support next. For now, risk will stay on the downside as long as 163.19 support turned resistance holds, in case of recovery
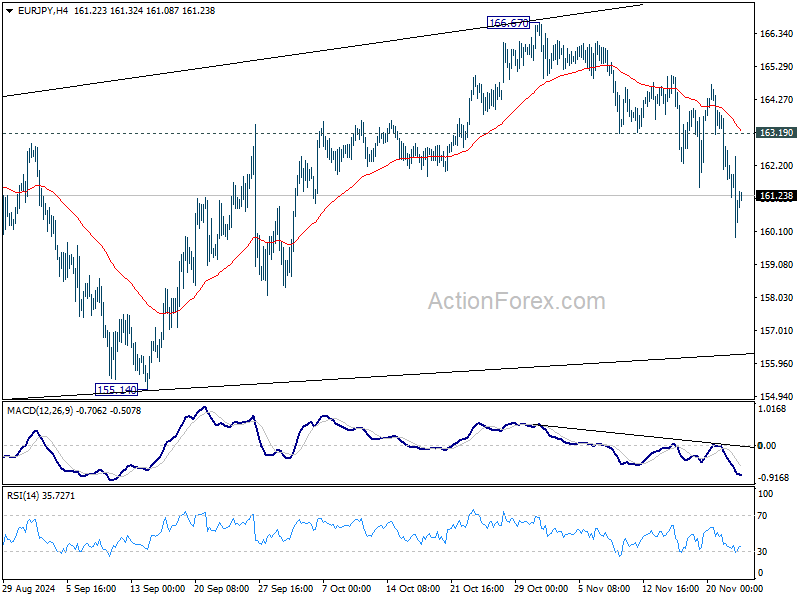
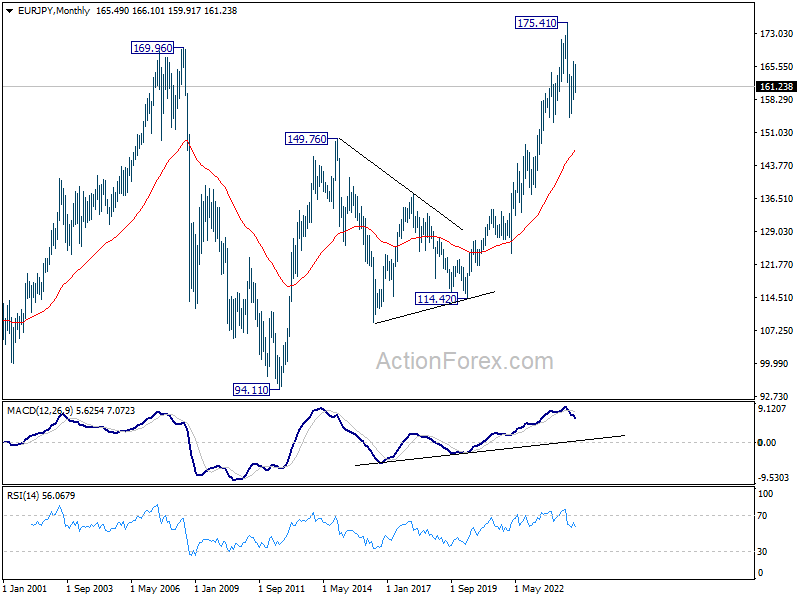
In the bigger picture, price actions from 175.41 are seen as correction to rally from 114.42 (2020 low). The range of consolidation should have been set between 38.2% retracement of 114.42 to 175.41 at 152.11 and 175.41 high. However, decisive break of 152.11 would argue that deeper correction is underway.
In the long term picture, considering bearish divergence condition in W MACD, 175.41 is at least a medium term top. It's still early to conclude that up trend from 94.11 (2012 low) has completed. But a medium term corrective phase is in progress with risk of deeper fall back to 55 M EMA (now at 147.33).