Sample Category Title
AUD/USD and NZD/USD Recover – More Gains Ahead?
AUD/USD is attempting a recovery wave from 0.6440. NZD/USD is also correcting losses and might recover if there is a clear move above the 0.5950 resistance.
Important Takeaways for AUD/USD and NZD/USD Analysis Today
- The Aussie Dollar found support near 0.6440 and is now recovering against the US Dollar.
- There was a break above a key bearish trend line with resistance at 0.6480 on the hourly chart of AUD/USD at FXOpen.
- NZD/USD is attempting a recovery wave above the 0.5880 resistance.
- There was a break above a major bearish trend line with resistance near 0.5860 on the hourly chart of NZD/USD at FXOpen.
AUD/USD Technical Analysis
On the hourly chart of AUD/USD at FXOpen, the pair dipped from the 0.6685 resistance zone. The Aussie Dollar declined below 0.6500, but the bulls were active near 0.6440 against the US Dollar.
A low was formed near 0.6439 and the pair is now correcting losses. There was a move above the 23.6% Fib retracement level of the downward wave from the 0.6685 swing high to the 0.6439 low. There was also a break above a key bearish trend line with resistance at 0.6480.
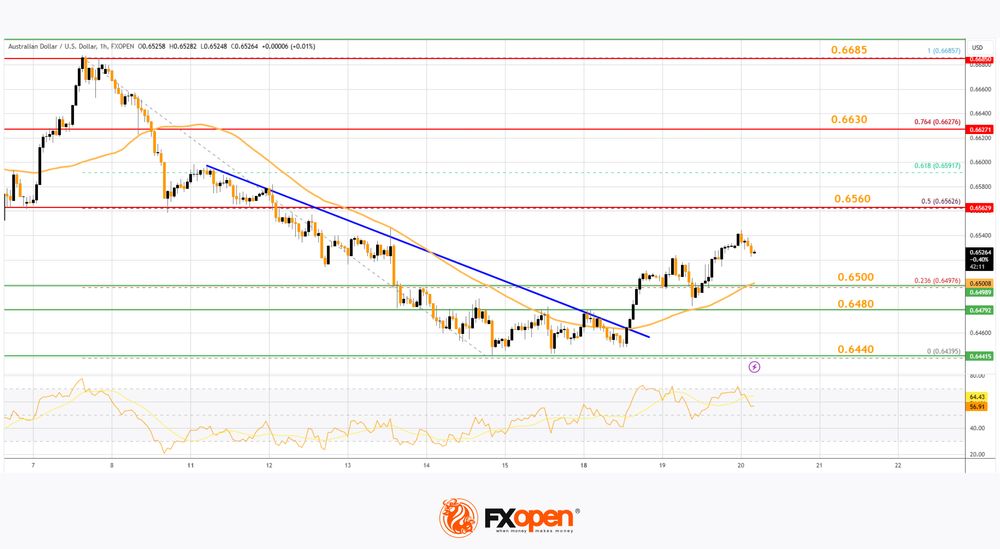
The pair is now above 0.6500 and the 50-hour simple moving average. On the upside, immediate resistance is near the 50% Fib retracement level of the downward wave from the 0.6685 swing high to the 0.6439 low at 0.6560.
The first major resistance is near 0.6630. A clear upside break above 0.6630 could send the pair toward 0.6685. The next major resistance on the AUD/USD chart is near 0.6720, above which the price could rise toward 0.6750. Any more gains might send the pair toward 0.6800.
On the downside, initial support is near 0.6500 or the 50-hour simple moving average. The next support could be the 0.6480 zone. Any more losses might send the pair toward the 0.6440 support.
NZD/USD Technical Analysis
On the hourly chart of NZD/USD on FXOpen, the pair also followed a similar pattern and declined from the 0.6040 zone. The New Zealand Dollar gained bearish momentum and traded below 0.5950 against the US Dollar.
The pair even dropped below the 50-hour simple moving average and tested 0.5835. A low was formed near 0.5836 and the pair is now attempting a fresh increase. It is back above the 0.5880 level and the 50-hour simple moving average.
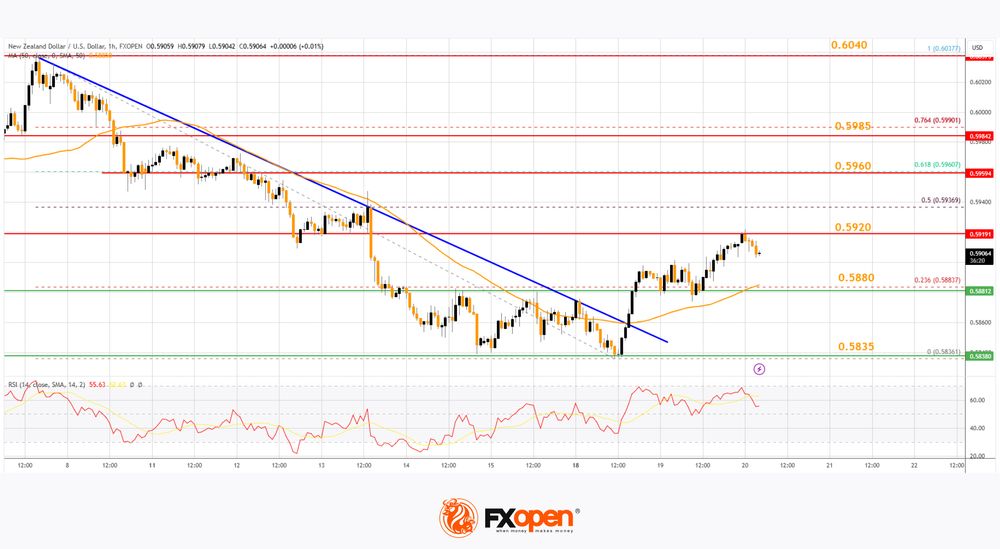
Besides, there was a break above a major bearish trend line with resistance near 0.5860. The pair surpassed the 23.6% Fib retracement level of the downward wave from the 0.6037 swing high to the 0.5836 low.
On the upside, the pair is facing resistance near the 0.5920 level. The next major resistance is near the 61.8% Fib retracement level of the downward wave from the 0.6037 swing high to the 0.5836 low at 0.5960.
If there is a move above 0.5960, the pair could rise toward the 0.5985 resistance. Any more gains might open the doors for a move toward the 0.6040 resistance zone.
On the downside, immediate support on the NZD/USD chart is near 0.5880. The next major support is near the 0.5835 zone. If there is a downside break below 0.5835, the pair could extend the decline toward the 0.5800 level. The next key support is near 0.5765.
Trade over 50 forex markets 24 hours a day with FXOpen. Take advantage of low commissions, deep liquidity, and spreads from 0.0 pips. Open your FXOpen account now or learn more about trading forex with FXOpen.
This article represents the opinion of the Companies operating under the FXOpen brand only. It is not to be construed as an offer, solicitation, or recommendation with respect to products and services provided by the Companies operating under the FXOpen brand, nor is it to be considered financial advice.
Crypto Market Loses Some Spark
Market Picture
The cryptocurrency market cap is up 0.3% in 24 hours to $ 3.09 trillion. This slight increase masks an impressive altcoin pullback that failed to cap the 1% rise in BTC. However, sentiment indicators remain in extreme greed territory. Solana is down 3% overnight and around 6% from Tuesday’s high. Litecoin has pulled back 14% from Saturday’s high and is a few steps away from $100.
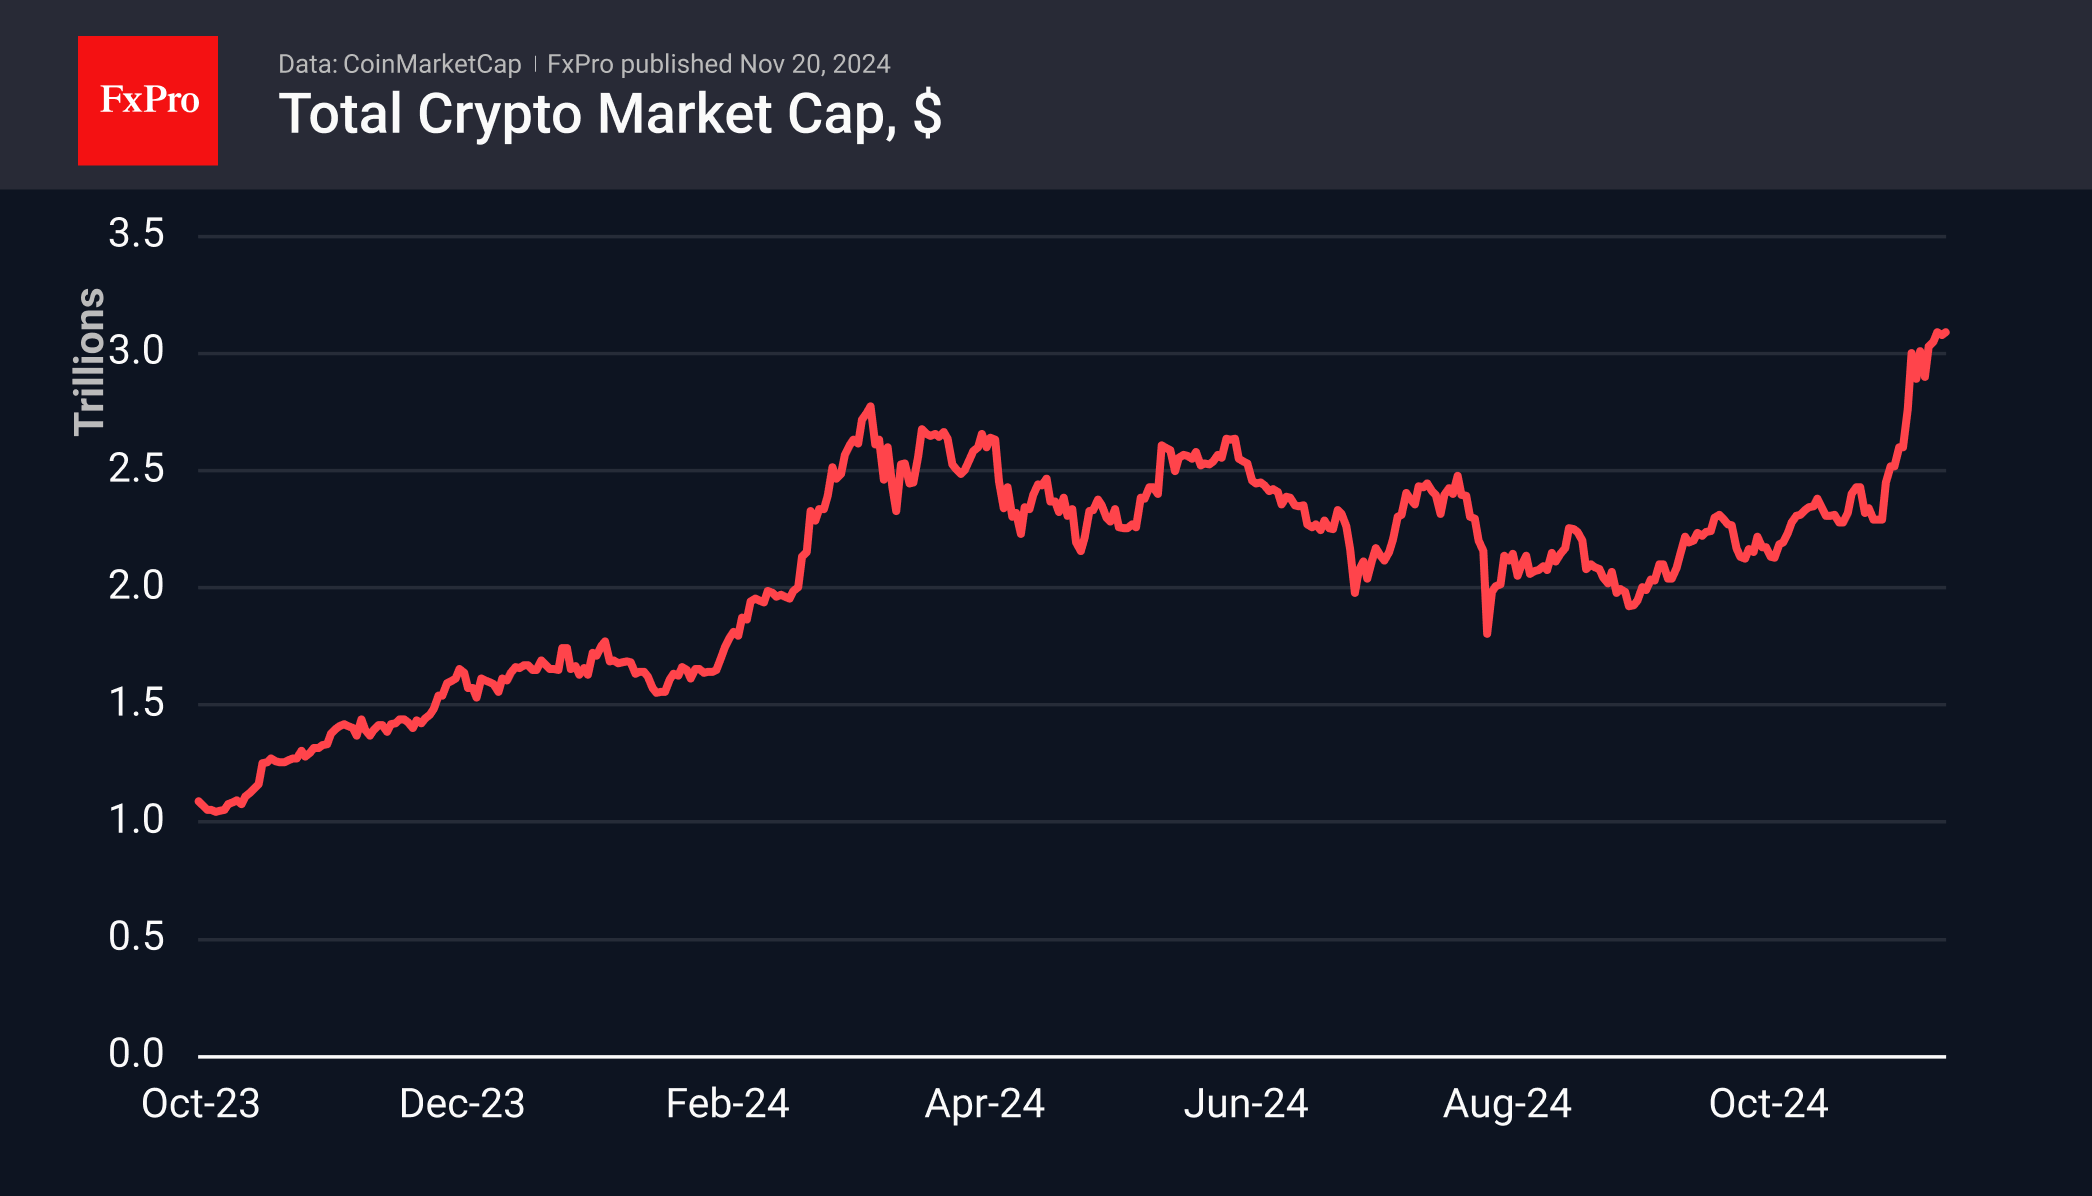
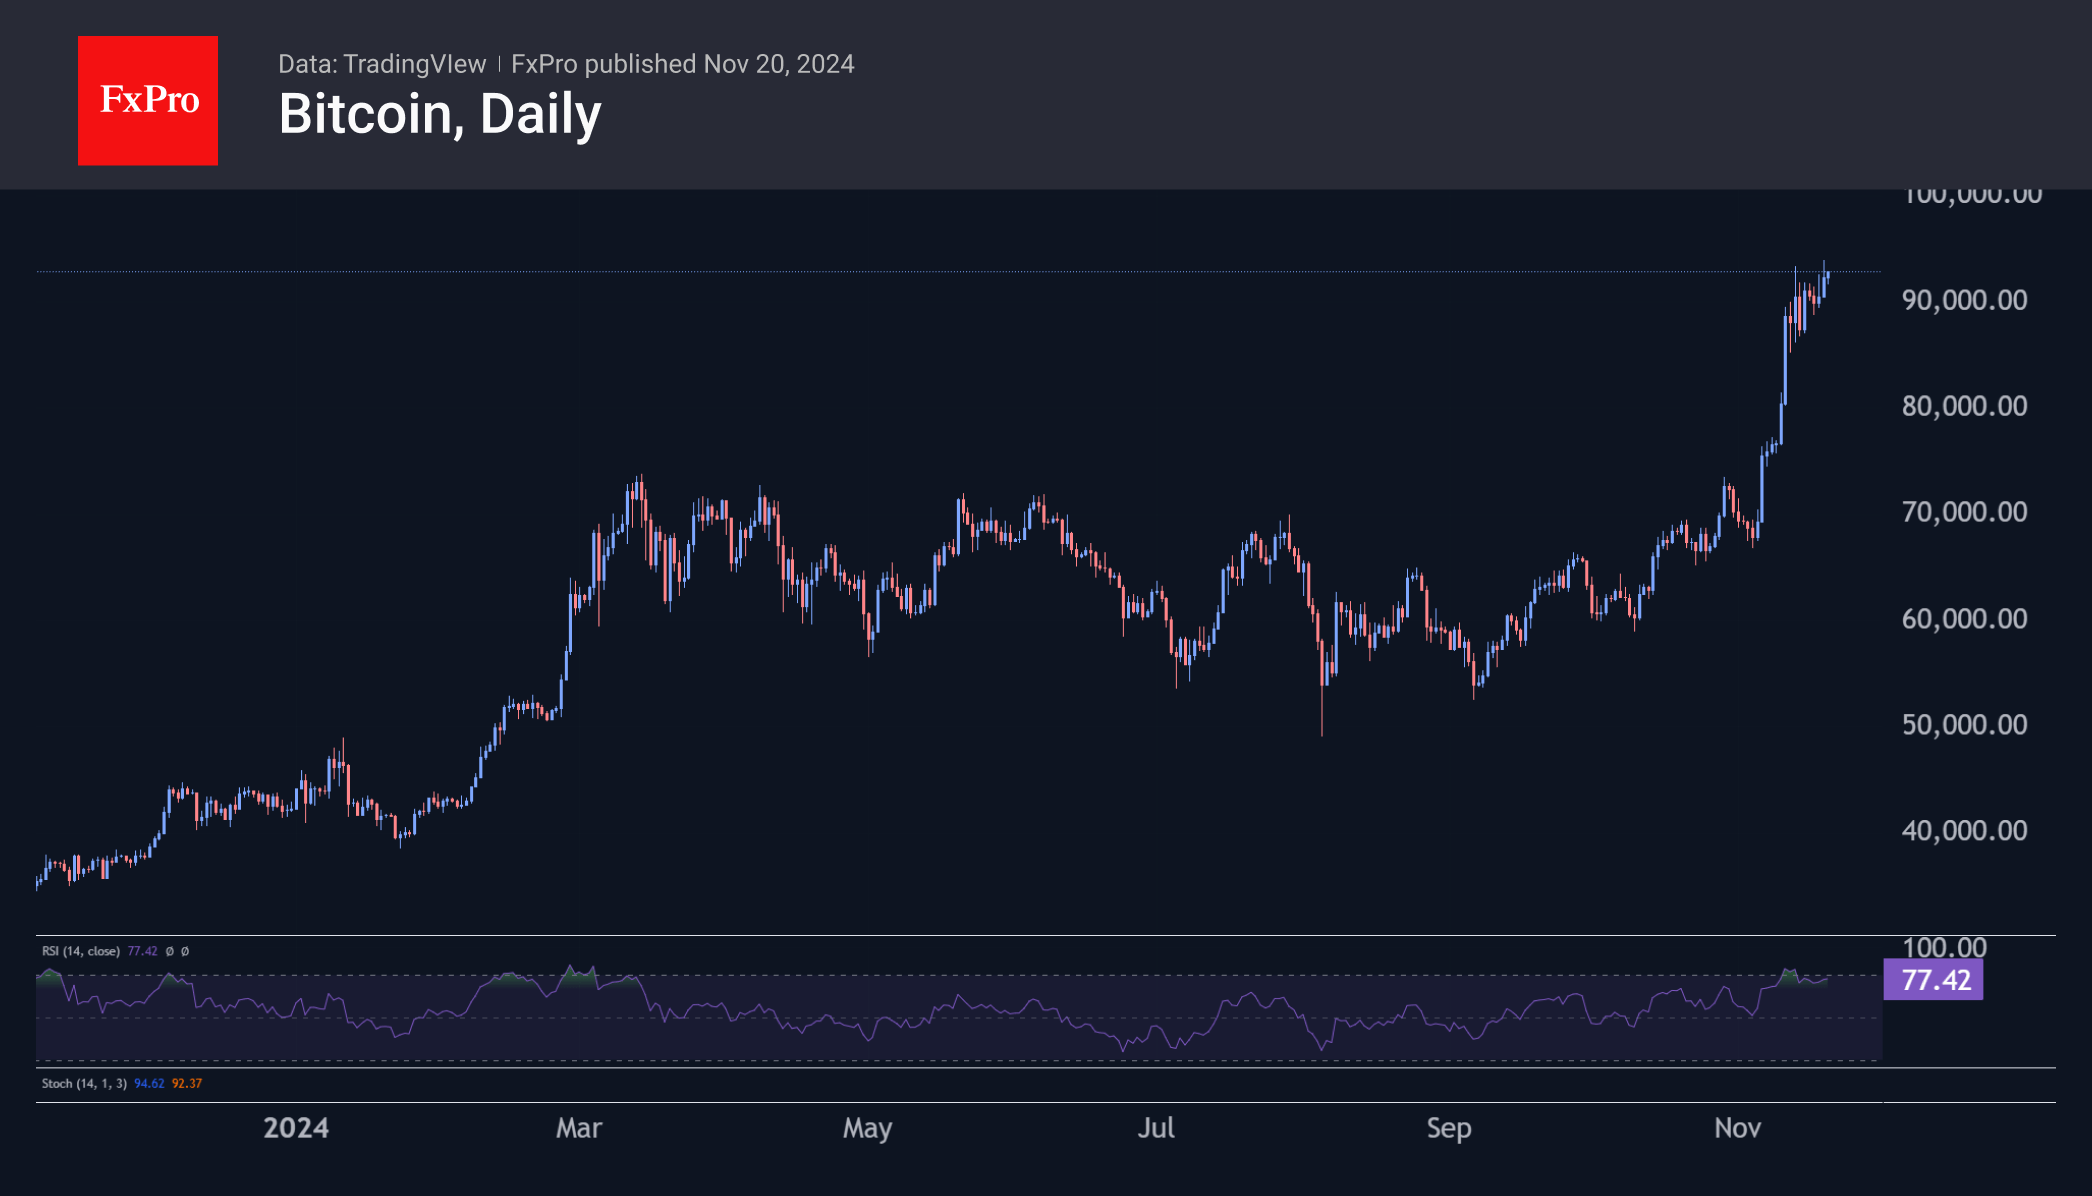
Bitcoin climbed close to $94K on Tuesday night, updating all-time highs. Unlike last week’s attack, the new highs were not followed by stop orders and margin calls from shorts. Instead, they moved into the $100K-plus area.
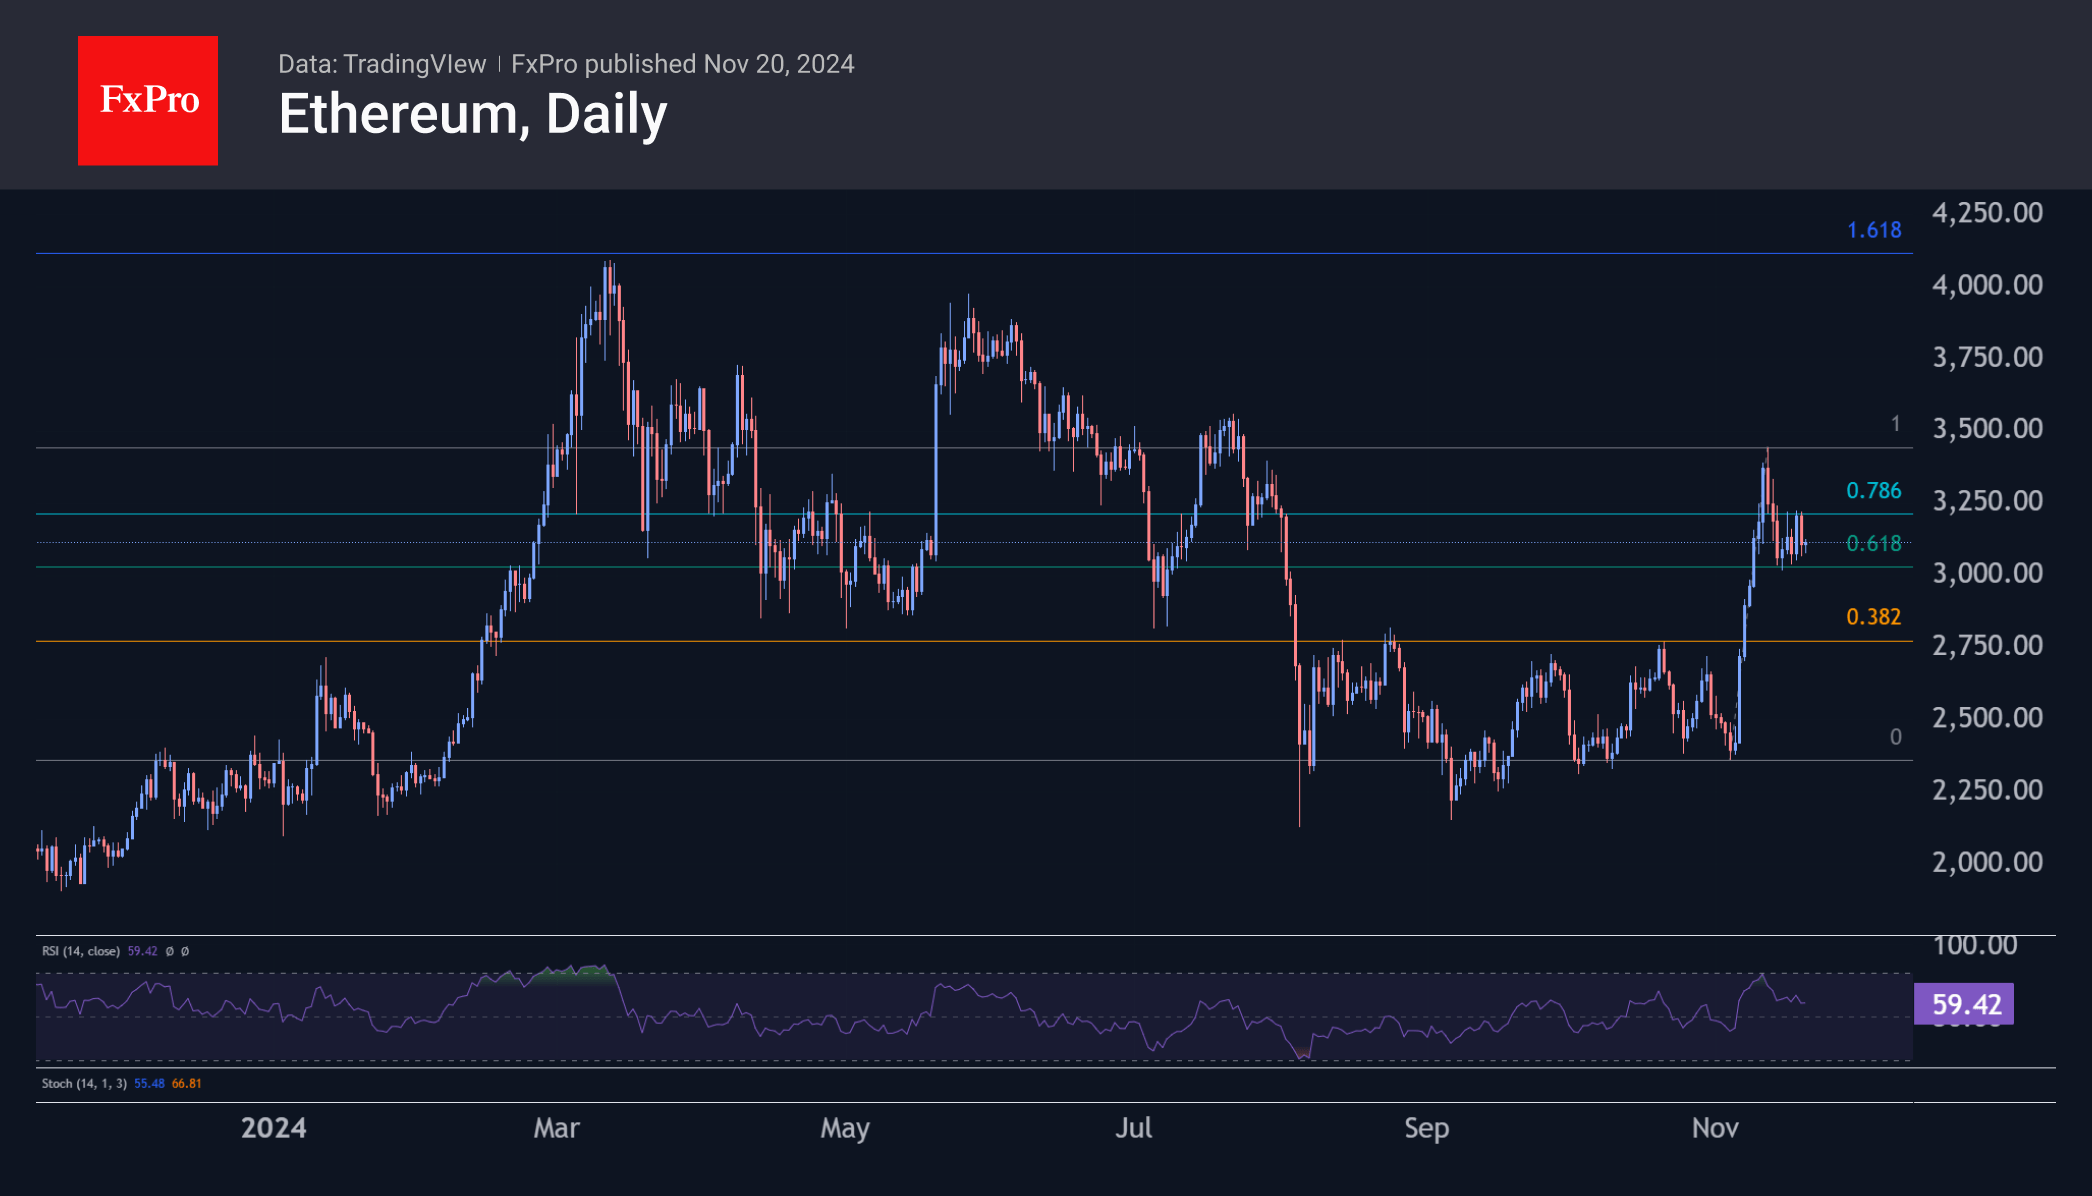
Like Litecoin, Ethereum is becoming a boring story. The rally in early November stopped just short of an overbought level, with profit taking at 61.8% of the initial momentum—significantly deeper than Bitcoin and the broader crypto market. Such an adherence to classic technical analysis may be convenient for traders, but it is hardly to the liking of enthusiasts, who have probably moved on to other altcoins.
News Background
In another recalculation, the difficulty of mining Bitcoin exceeded 102T for the first time in history. The average hash rate for the two-week calculation period rose to 755.3 EH/s.
According to JPMorgan, the hash price, a measure of Bitcoin mining profitability, rose 29% in the first half of November. The rally in BTC ahead of the hash rate increase and the increase in transaction fees as a percentage of block reward contributed to the significant improvement in mining economics.
MicroStrategy plans to issue a $1.75 billion five-year bond to be used for BTC acquisitions and general corporate purposes. The company’s reserves have reached 331,200 BTCs, on which it has spent ~$16.5 billion at an average purchase price of $49,874 per coin.
QCP Capital believes the ‘real altcoin season’ will begin after the bitcoin dominance index falls to 58% vs 59.4% now. Before that, by the end of the year, BTC could break through the psychologically important $100K mark.
According to the Financial Times, the Donald Trump-linked Trump Media and Technology Group (DJT) is in the advanced stages of a deal to buy struggling platform Bakkt.
GBPJPY continues higher after UK CPI
- GBPJPY gains ground after upbeat UK CPI data
- Technical signals endorse bullish efforts
- Buyers need confirmation above 197.35
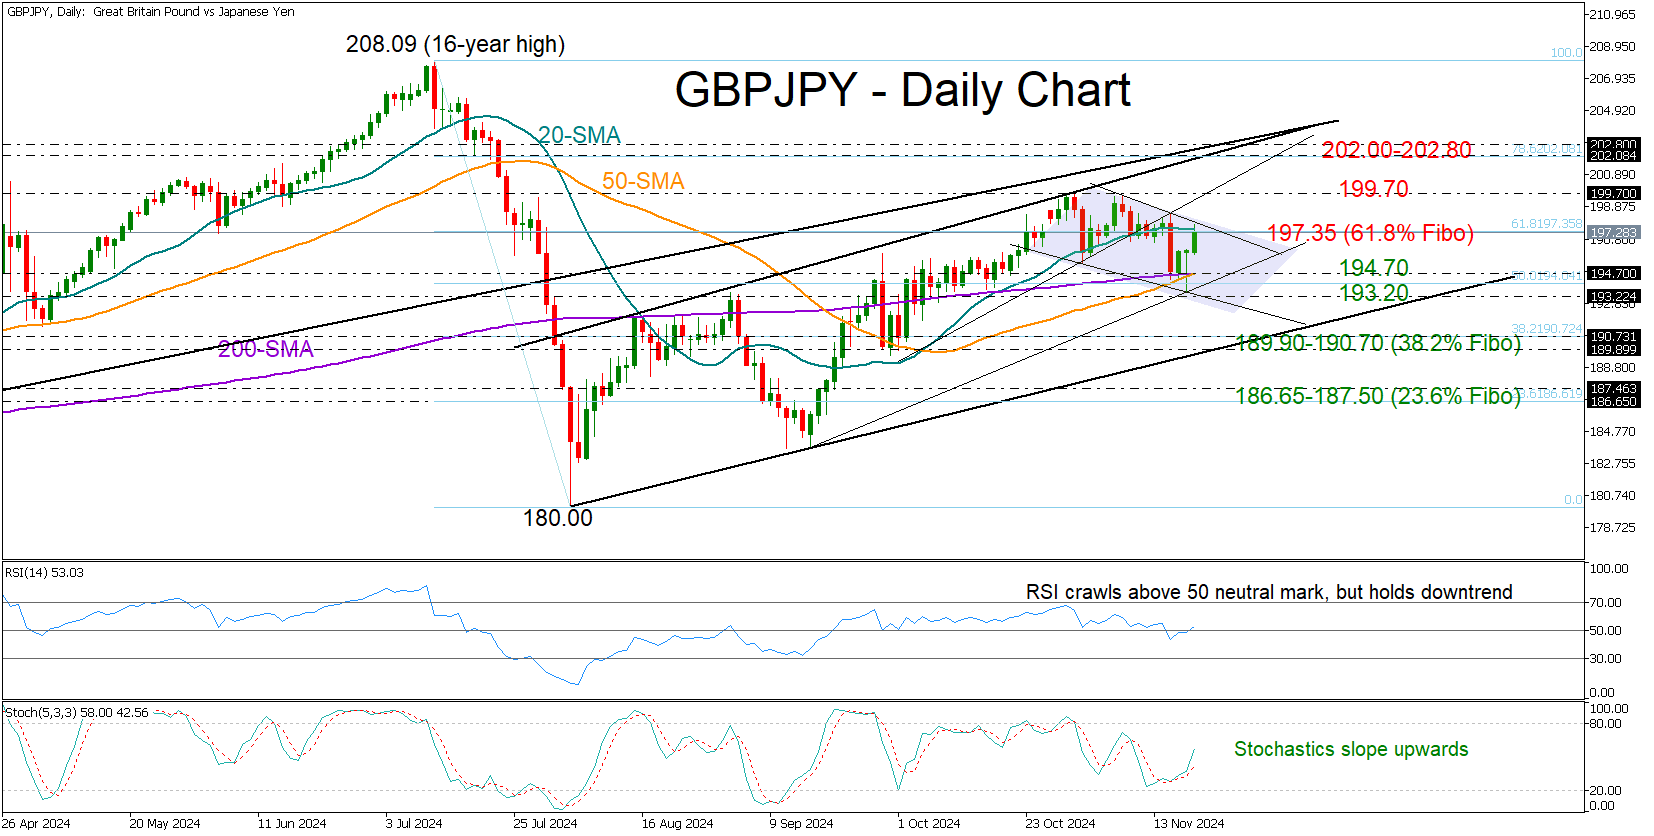
GBPJPY advanced to an intra-day high of 197.77 after hotter-than-expected UK CPI inflation data gave traders confidence that the Bank of England might hold interest rates steady in December.
Earlier, the pair had built a solid base around 194.70, supported by its 50- and 200-day simple moving averages. This suggests the upward pattern that started in August is still in play, despite November’s bearish tendencies.
Looking at the technical indicators, the RSI and stochastic oscillator are endorsing the current euphoria in the market, but downside risks could remain in play if the price fails to close above the nearby resistance of 197.35, where the 20-day SMA and the 61.8% Fibonacci retracement level of the July-August downtrend are positioned. If the bulls can push past that border, they could next target October’s bar of 199.70, and beyond that, the 202.00-202.80 range.
On the flip side, if the price steps below the 194.70 floor, the tentative falling line from October could halt selling forces near 193.20. If not, the decline could stretch toward the 38.2% Fibonacci mark of 190.70, and potentially reach the August support line at 189.90. Additional losses from there would violate the short-term uptrend, prompting a new decline toward the 186.65-187.50 zone.
Overall, GBPJPY looks like it’s setting up a potential new bullish move, but traders will likely wait for a confirmation above 197.35 before jumping in.
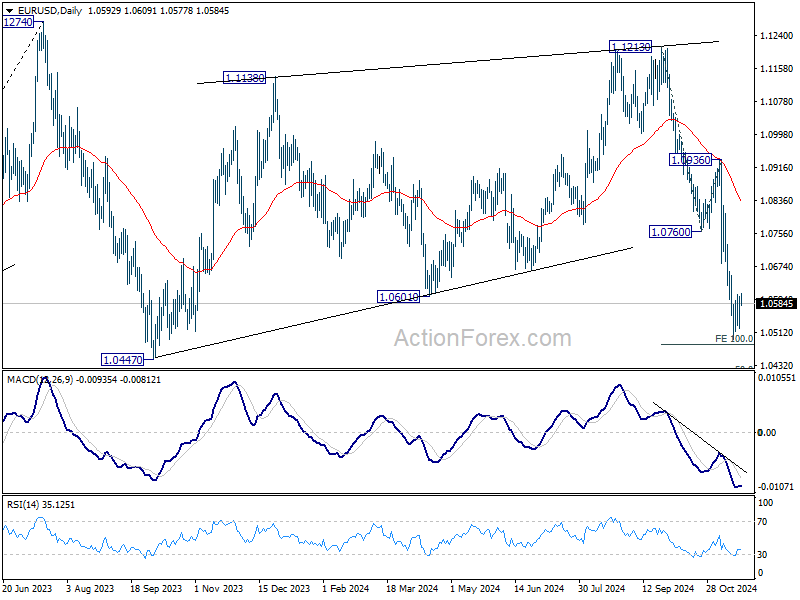
EUR/USD Daily Outlook
Daily Pivots: (S1) 1.0545; (P) 1.0574; (R1) 1.0625; More...
Intraday bias in EUR/USD remains neutral and more consolidations could be seen above 1.0495. Outlook will stay bearish as long as 1.0760 support turned resistance holds. On the downside, firm break of 1.0495 will resume the fall from 1.1213 to 1.0447 support and then 1.0404 key fibonacci level next.
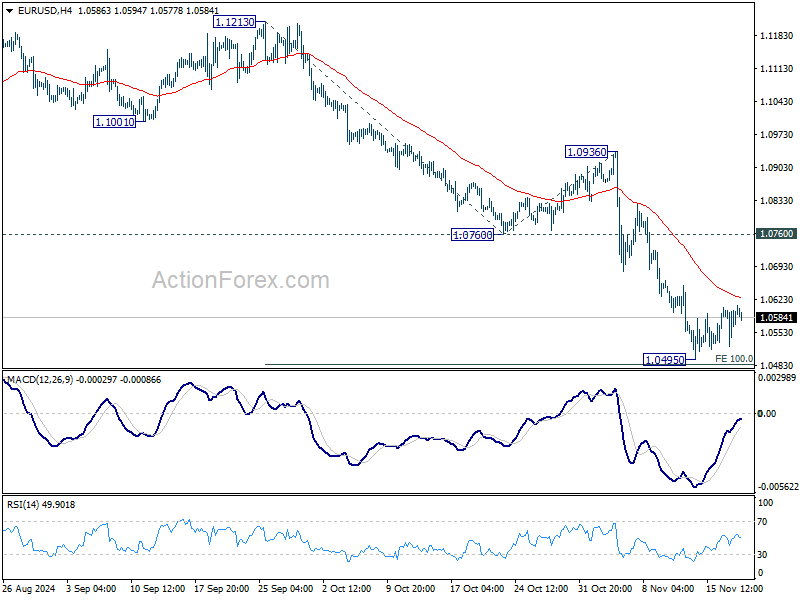
In the bigger picture, price actions from 1.1274 (2023 high) are seen as a consolidation pattern to up trend from 0.9534 (2022 low), with fall from 1.1213 as the third leg. Downside should be contained by 50% retracement of 0.9534 (2022 low) to 1.1274 at 1.0404, to bring up trend resumption at a later stage. However, firm break of 1.0404 will raise the chance of reversal and target 61.8% retracement at 1.0199.
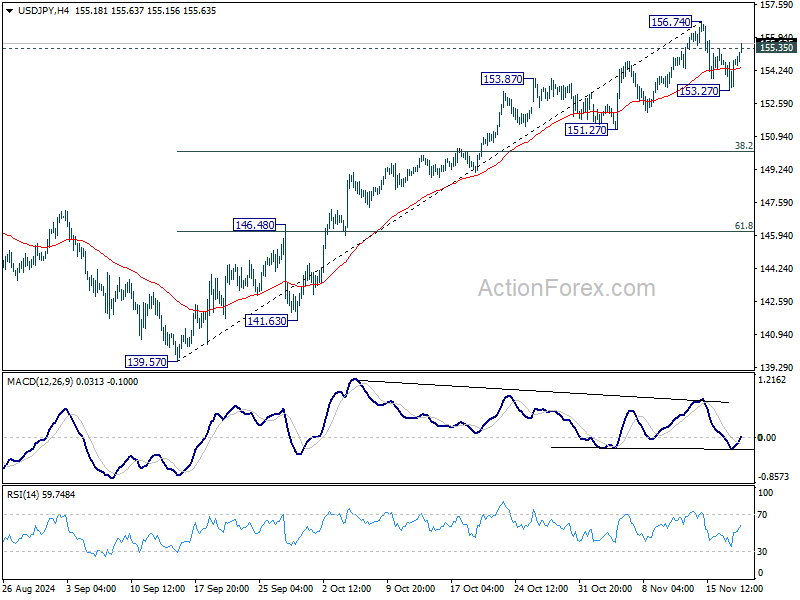
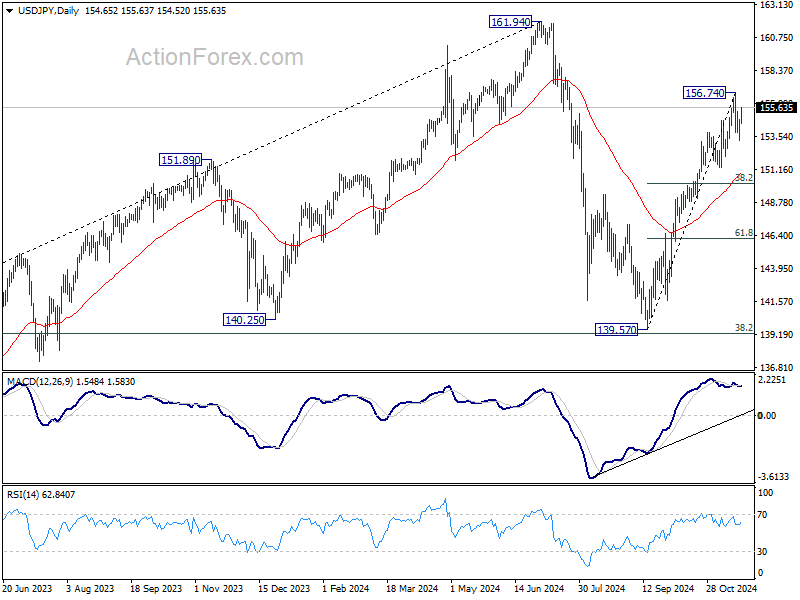
USD/JPY Daily Outlook
Daily Pivots: (S1) 153.70; (P) 154.25; (R1) 155.21; More...
USD/JPY rebounded after dipping to 153.27 and the break of 155.35 minor resistance suggests that pull back from 156.74 has completed. Intraday bias is back on the upside. Break of 156.74 will resume the whole rally from 139.57 towards 161.94 high. On the downside, though, break of 153.27 will resume the correction towards 38.2% retracement of 139.57 to 156.74 at 150.18.
In the bigger picture, price actions from 161.94 are seen as a corrective pattern to rise from 102.58 (2021 low). The range of medium term consolidation should be set between 38.2% retracement of 102.58 to 161.94 at 139.26 and 161.94. Nevertheless, sustained break of 139.26 would open up deeper medium term decline to 61.8% retracement at 125.25.
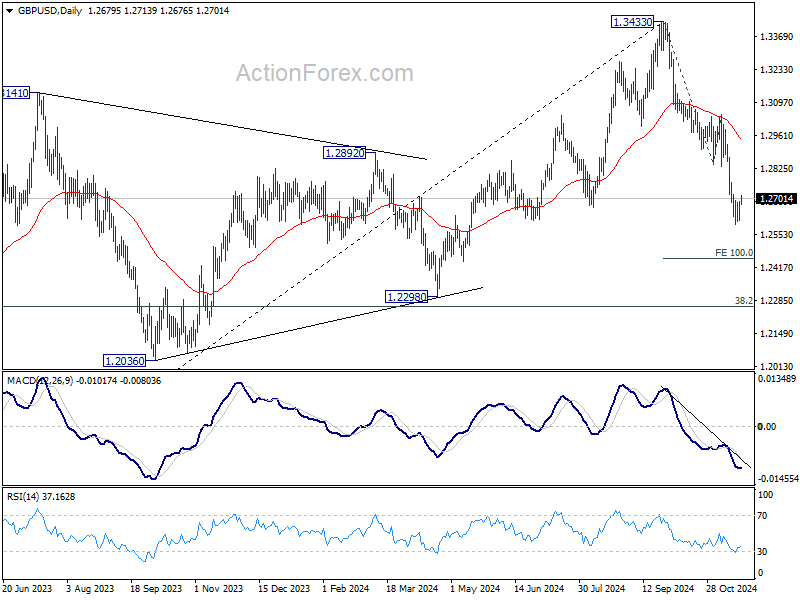
GBP/USD Daily Outlook
Daily Pivots: (S1) 1.2634; (P) 1.2662; (R1) 1.2711; More...
GBP/USD recovers further today but stays well below 1.2842 support turned resistance. Intraday bias remains neutral and outlook stays bearish. On the downside, break of 1.2596 will resume the fall from 1.3433 to 100% projection of 1.3433 to 1.2842 to 1.3047 at 1.2456.
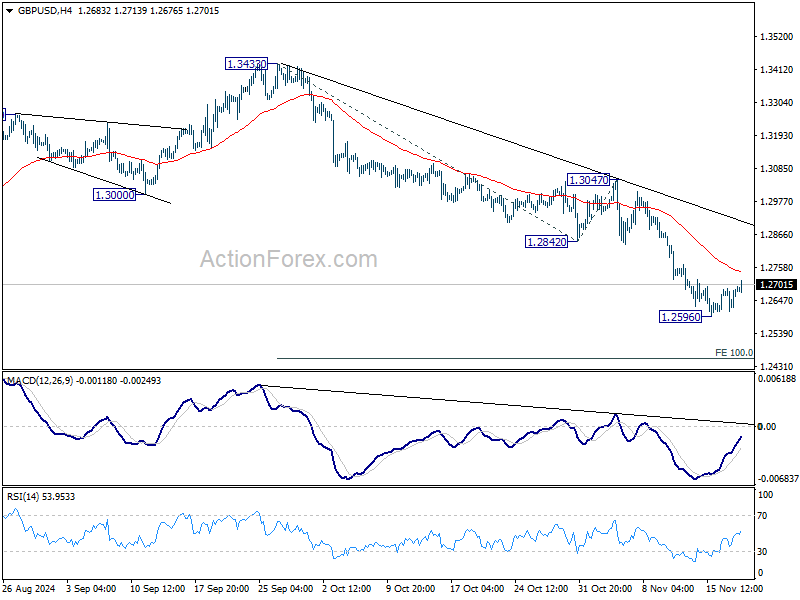
In the bigger picture, a medium term top should be in place at 1.3433, and price actions from there are correcting whole up trend from 1.0351 (2022 low). Deeper decline is now expected as long as 55 D EMA (now at 1.2977) holds, to 38.2% retracement of 1.0351 to 1.3433 at 1.2256, which is close to 1.2298 structural support. Strong support should be seen there to bring rebound.
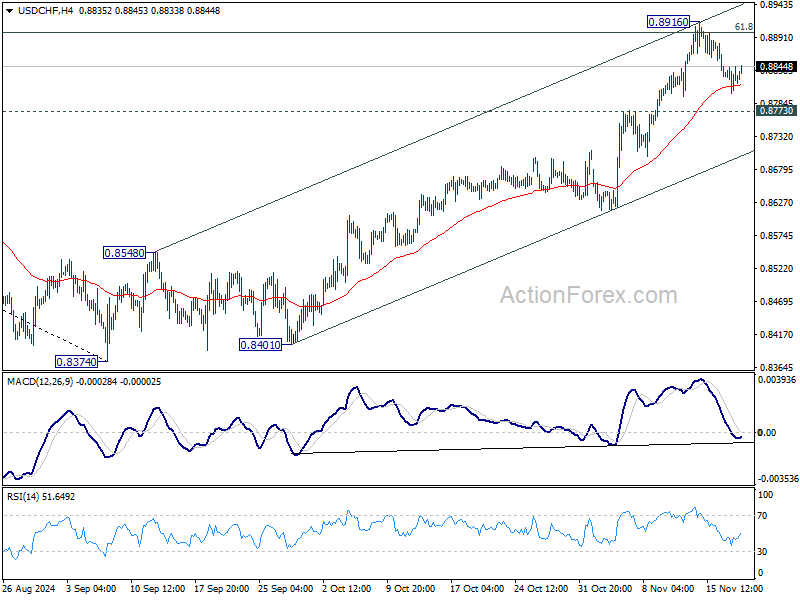
USD/CHF Daily Outlook
Daily Pivots: (S1) 0.8789; (P) 0.8836; (R1) 0.8870; More…
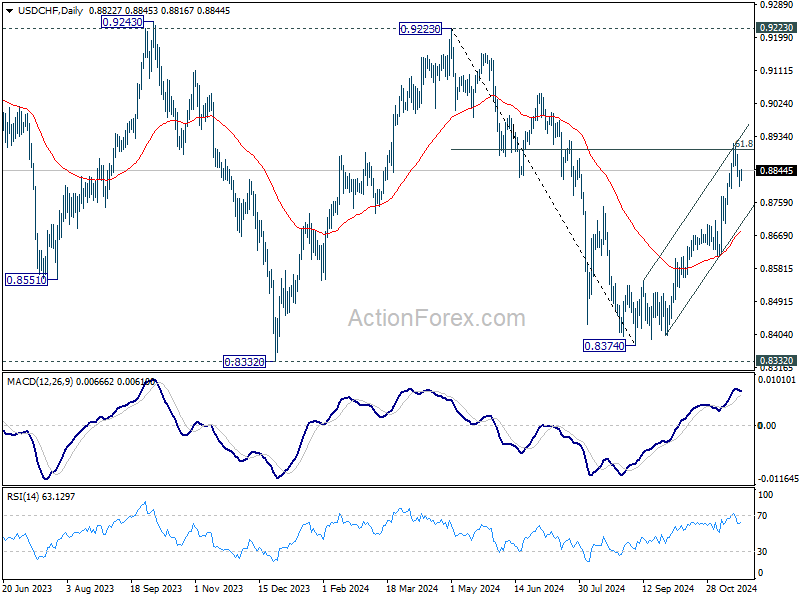
Intraday bias in USD/CHF remains neutral for more consolidations. Further rally is expected as long as 0.8773 resistance turned support holds. On the upside, break of 0.8916 and sustained trading above 61.8% retracement of 0.9223 to 0.8374 at 0.8899 will pave the way back to 0.9223 key resistance.
In the bigger picture, price actions from 0.8332 (2023 low) are currently seen as a medium term corrective pattern. Rise from 0.8374 is seen as the third leg. Overall outlook will continue to stay bearish as long as 0.9223 resistance holds. Break of 0.8332 low is in favor at a later stage when the consolidation completes.
UK Headline Inflation Accelerated Slightly More than Expected
Markets
Markets were on an emotional rollercoaster yesterday. The first Ukrainian use of US-made long range ATACMS missiles pushed Russian President Putin into signing off a revised nuclear doctrine. It now includes a possibility of a nuclear response to aggression by non-nuclear states that are supported by other nuclear powers. European stocks lost around 1.5% and hit an intraday bottom (-2%) after Russian minister of foreign affairs Lavrov called it a “signal of escalation”. European stock markets eventually recovered to closing losses of somewhat less than 1% after that same minister tried to calm worries over a nuclear escalation. “We are strongly in favor of doing everything not to allow nuclear war to happen. A nuclear weapon is first and foremost a weapon to prevent any nuclear war.” Haven assets mirrored the intraday sell-off/recovery from equities. German yields ended around 3.5 bps lower across the curve but traded with losses of up to 10 bps. US yields lost up to 2.8 bps in a bull flattening move. EUR/USD closed unchanged just below 1.06, but set an intraday bottom around 1.0530. US stock markets turned starting losses into closing gains (S&P & Nasdaq), mainly thanks to a near 5% increase in Nvidia shares going into tonight earnings from the company. The outcome will influence general market/risk sentiment and could set the tone going into year-end.
EMU Q3 negotiated wage data are today’s economic highlight. Annualized wage growth remained between 4.3% and 4.7% from Q1 2023 to Q1 2024. Last quarter’s decline to 3.5% was welcomed by the ECB in its inflation fight, but remains way above the central bank’s 2% inflation target. ECB Lagarde indicated that forward-looking wage trackers point to a an easing of pay growth in 2025 which she hopes to see reflected in today’s numbers. While a further deceleration is likely, we don’t think they will give sufficient confidence for the ECB to accelerate from 25 bps rate cuts to a 50 bps move in December. It could extend the short term bottoming-out process in EUR rates given that EMU money market still attach a small probability to such a scenario.
UK headline inflation accelerated slightly more than expected in October, by 0.6% M/M to 2.3% Y/Y. Core CPI remained stronger as well, rising by 0.4% M/M to 3.3% Y/Y (from 3.2%). Services CPI ticked up from 4.9% Y/Y to 5%. Today’s figures add strength to the Bank of England’s “not too many, not too much” rhetoric. Sterling strengthens marginally in a first reaction, from EUR/GBP 0.8350 to 0.8330.
News & Views
Hungary’s central bank (MNB) kept the policy rate unchanged at 6.5% yesterday. One dissenter voted for a rate decrease, potentially inspired by disappointing Q3 growth and the recent sharper-than-expected inflation decline. The MNB noted that this indicates lower inflation in the short term. But the “exchange rate depreciation seen in the past months as well as changes to the system of excise duties are likely to have inflationary effects in the next year.” The Monetary Council said the increase in risk aversion towards emerging markets was driven by geopolitics and changing growth and central bank expectations of developed economies. The MNB said these developments pose an upside risk to domestic inflation and considered a pause in the cutting cycle appropriate. “Looking ahead, a careful and patient approach to monetary policy is still warranted.”, the statement still says. Its deputy governor in the press conference afterwards stressed the importance of anchoring inflation expectations, which for households are “significantly” above the central bank’s 3% target range. He stuck to earlier guidance of maintaining the current policy rate for a “sustained period”. The Hungarian forint ended yesterday lower against the euro. EUR/HUF closed at 408.3. Hungarian swap yields dropped some 5 bps across the curve, be it in a pre-meeting move.
Austria is expected to give Romania and Bulgaria full accession to Europe’s Schengen zone, the FT reported. Air and maritime checks were already abandoned since end-March but Austria insisted on land border controls because of concerns over irregular migration. It is now ready to drop its veto after Romania and Bulgaria increased security checks, resulting in lower asylum applications and irregular migration. Barring a change-of-mind of the Dutch government, which gave green light in 2023 but now has the far-right Freedom party in the coalition, the matter can be formalized at the next EU home affairs meeting Dec 12. All restrictions may then be lifted at the start of 2025.
AUD/USD Daily Report
Daily Pivots: (S1) 0.6498; (P) 0.6516; (R1) 0.6551; More...
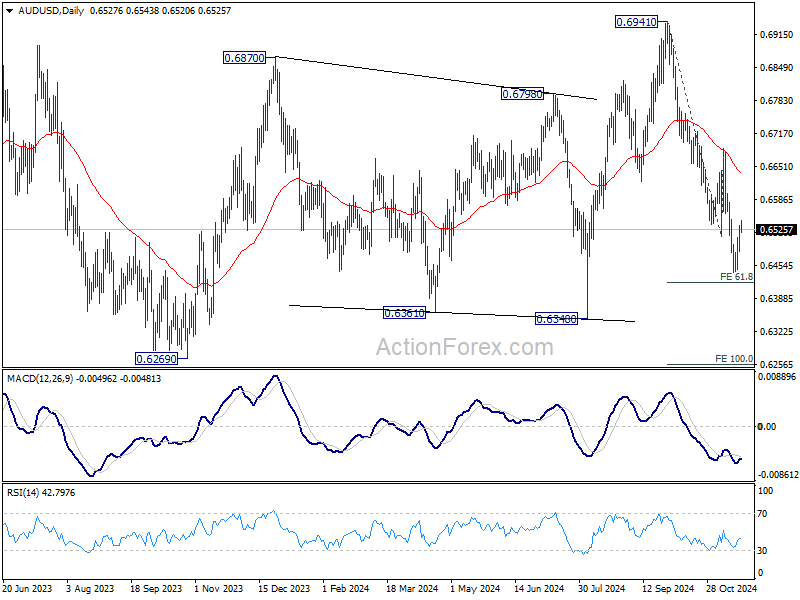
AUD/USD is extending consolidations from 0.6440 and intraday bias remains neutral. Outlook will stay bearish as long as 0.6687 resistance holds. On the downside, decisive break of 61.8% projection of 0.6941 to 0.6511 from 0.6687 at 0.6421 will resume the fall from 0.6941 to 100% projection at 0.6257 next.
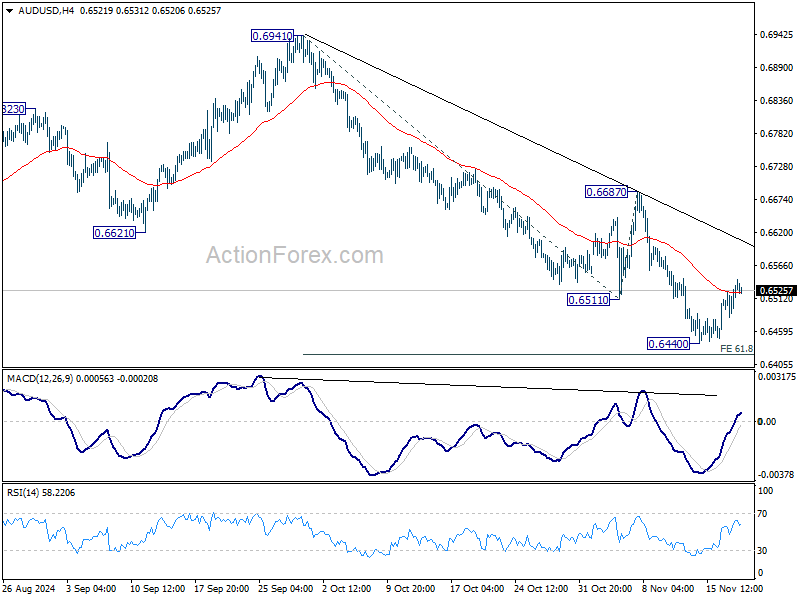
In the bigger picture, rise from 0.6269 (2023 low) should have completed with three waves up to 0.6941. Corrective pattern from 0.6169 (2022 low) is now extending with another falling leg. Deeper decline would be seen back to 0.6269 as sideway trading extends.
USD/CAD Daily Outlook
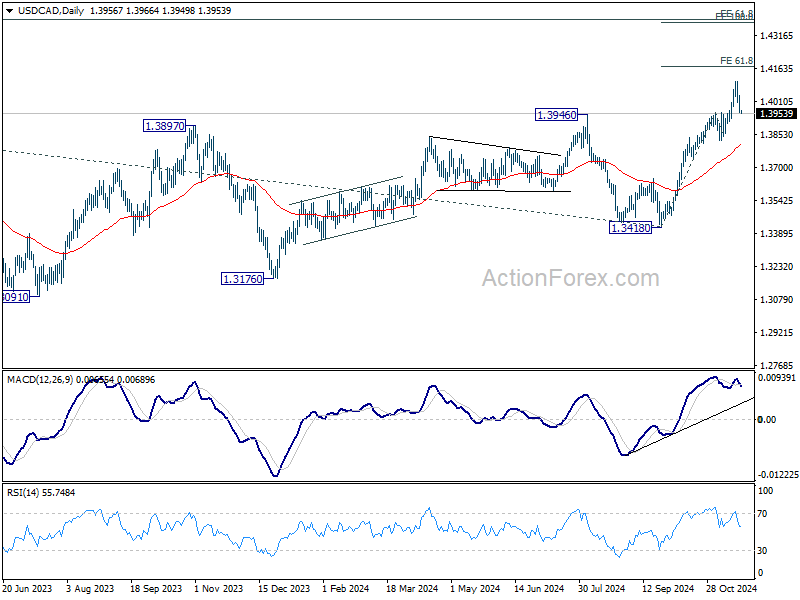
Daily Pivots: (S1) 1.3929; (P) 1.3983; (R1) 1.4010; More...
Intraday bias in USD/CAD remains neutral for the moment. Consolidations from 1.4104 should be brief as long as 1.3958 resistance turned support holds. Above 1.4104 will resume larger up trend to 61.8% projection of 1.3418 to 1.3958 from 1.3841 at 1.4175. Nevertheless, break of 1.3958 will bring lengthier consolidations, and risk deeper pull back to 1.3841 cluster support (38.2% retracement of 1.3418 to 1.4104 at 1.3842).
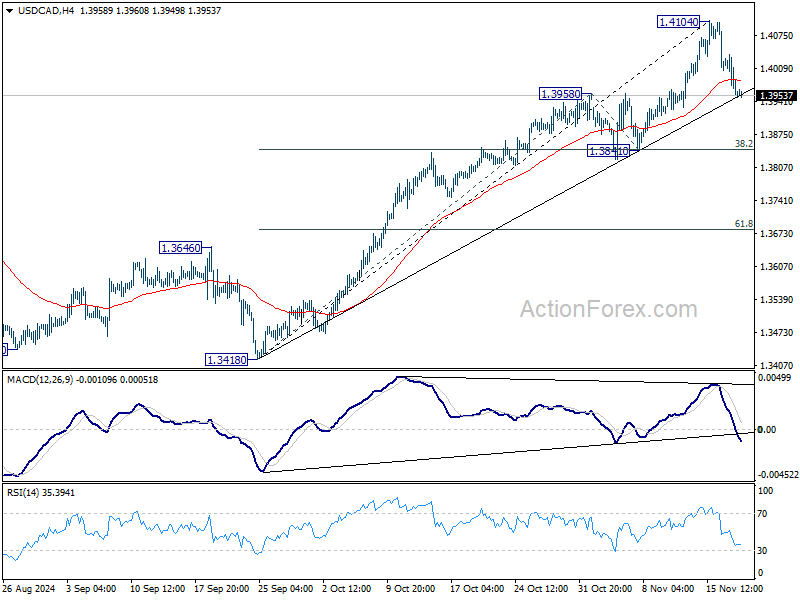
In the bigger picture, up trend from 1.2005 (2021) is resuming with break of 1.3976 key resistance (2022 high). Next target is 61.8% projection of 1.2401 to 1.3976 from 1.3418 at 1.4391. Now, medium term outlook will remain bullish as long as 1.3418 support holds, even in case of deep pullback.