Sample Category Title
GBP/USD Mid-Day Outlook
Daily Pivots: (S1) 1.2949; (P) 1.2982; (R1) 1.3019; More...
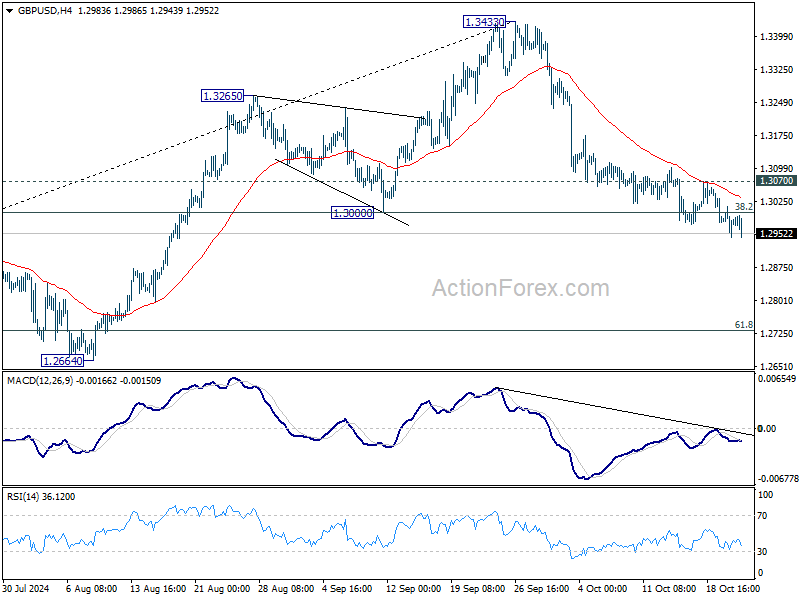
Intraday bias in GBP/USD remains on the downside at this point. Sustained trading below 1.3000 cluster support (38.2% retracement of 1.2298 to 1.3433 at 1.2999) will argue that whole rise from 1.2298 has completed and bring deeper fall to 61.8% retracement at 1.2732. On the upside, break of 1.3070 minor resistance will turn bias back to the upside for stronger rebound.
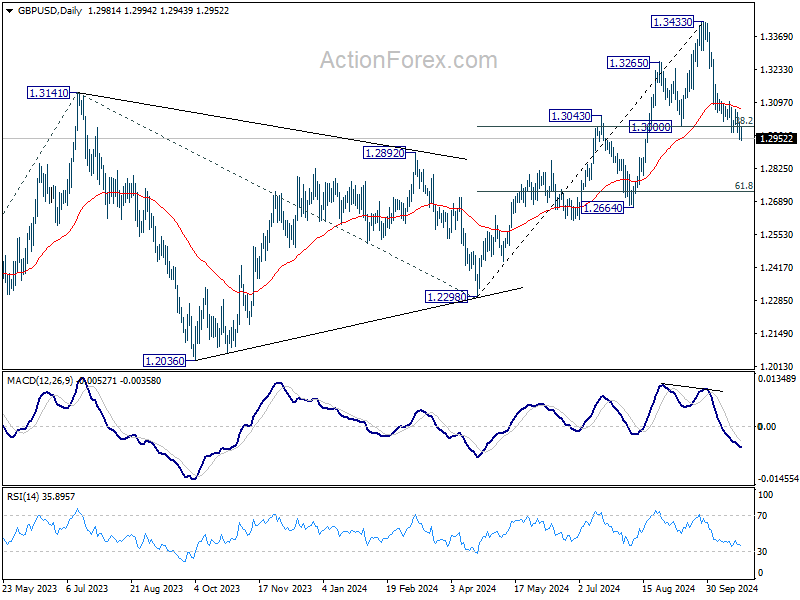
In the bigger picture, considering mildly bearish divergence condition in D MACD, decisive break of 1.3000 support will suggest that a medium term top is already formed at 1.3433. Price actions from there would be tentatively seen as correcting the up trend from 1.0351 (2022 low). In this case, deeper fall would be seen to 1.2298 structural support, strong support should be seen there to bring rebound.
USD/CHF Mid-Day Outlook
Daily Pivots: (S1) 0.8639; (P) 0.8654; (R1) 0.8667; More…
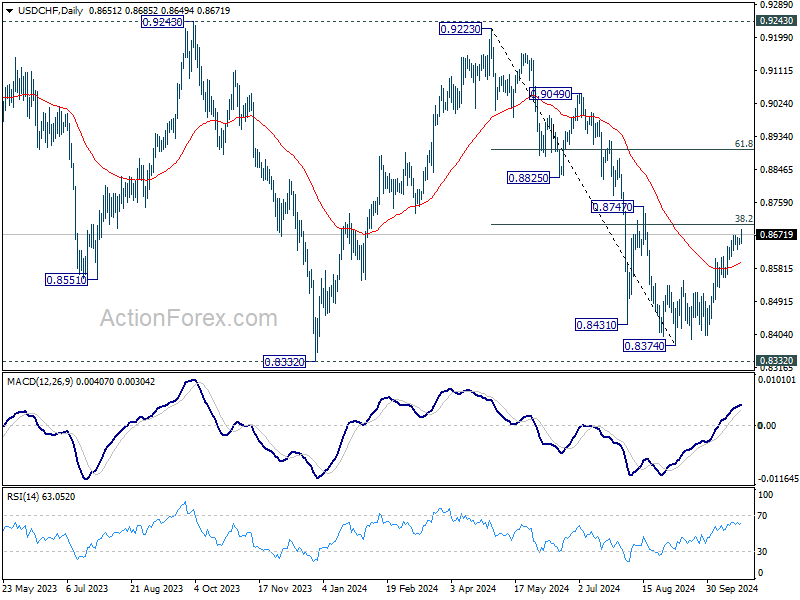
Intraday bias in USD/CHF stays on the upside as rise from 0.8374 is in progress. Sustained break of 38.2% retracement of 0.9223 to 0.8374 at 0.8698 will argue that fall from 0.9223 has completed at 0.8374, after defending 0.8332 low. Further rally should then be seen to 61.8% retracement at 0.8899 next. On the downside, below 0.8629 minor support will turn intraday bias neutral again.
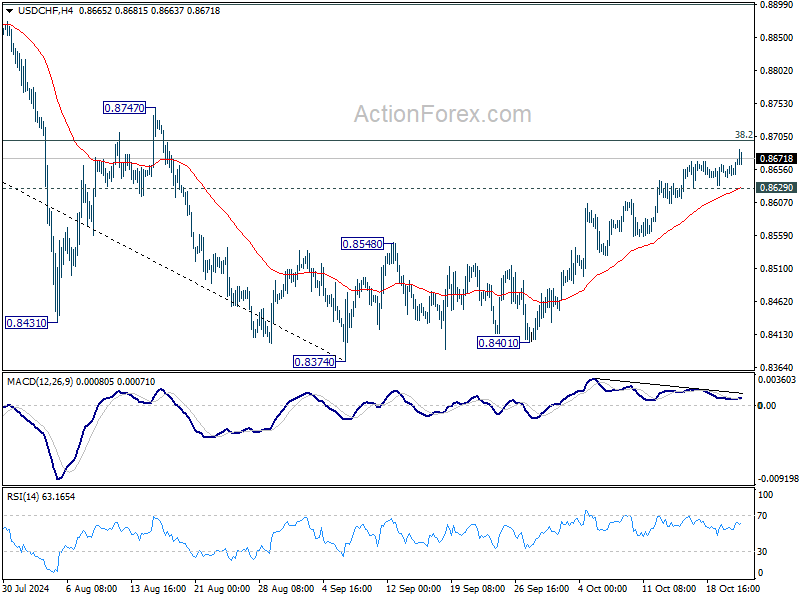
In the bigger picture, price actions from 0.8332 (2023 low) are currently seen as a medium term corrective pattern, with fall from 0.9223 as the second leg. Strong support could be seen from 0.8332 to bring rebound. Yet, overall outlook will continue to stay bearish as long as 0.9243 resistance holds. Firm break of 0.8332, however, will resume larger down trend from 1.0146 (2022 high).
USD/JPY Mid-Day Outlook
Daily Pivots: (S1) 150.66; (P) 150.93; (R1) 151.36; More...
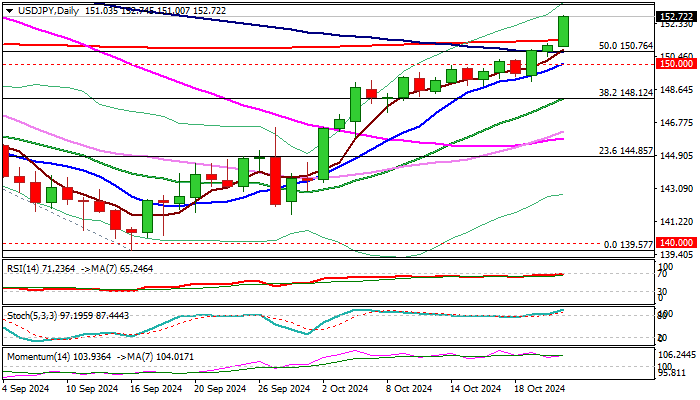
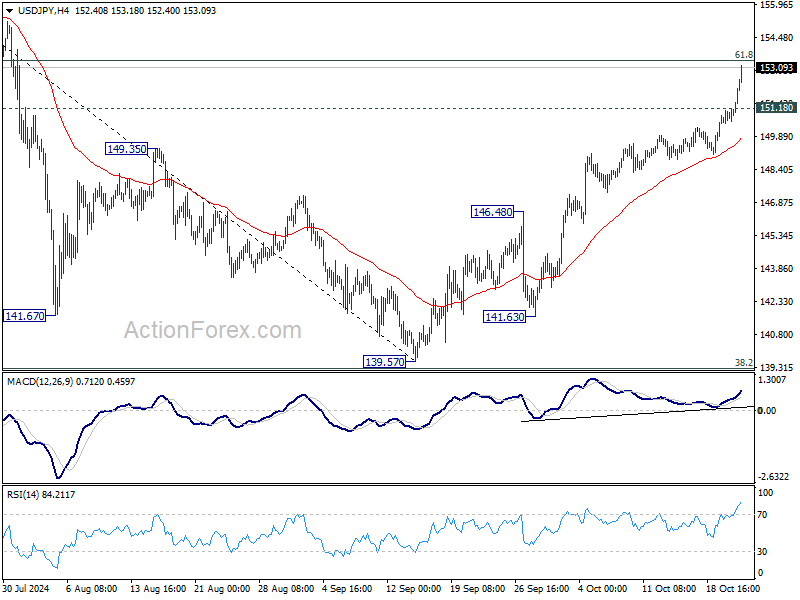
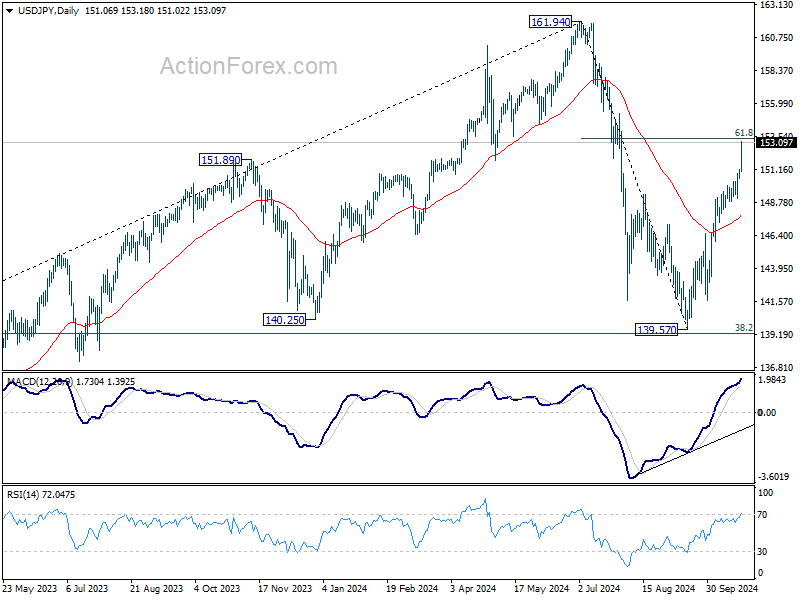
USD/JPY accelerates to as high as 153.18 so far and intraday bias stays on the upside. Decisive break of 61.8% retracement of 161.94 to 139.57 at 153.39 will pave the way to retest 161.94 high. On the downside, below 151.18 minor support will turn intraday bias neutral first. But further rally will now remain in favor as long as 55 D EMA (now at 147.85) holds, in case of retreat.
In the bigger picture, price actions from 161.94 are seen as a corrective pattern to rise from 102.58 (2021 low). The range of medium term consolidation should be set between 38.2% retracement of 102.58 to 161.94 at 139.26 and 161.94. Nevertheless, sustained break of 139.26 would open up deeper medium term decline to 61.8% retracement at 125.25.
Yen and Nikkei Tumble as Japan Prepares for Snap Election, Dollar Extends its Dominance
Japanese Yen and the Nikkei index have both been hammered this week as political uncertainty ahead of Japan’s snap election seemed to be rattling investor confidence. Yen accelerated its slide against Dollar through 153 mark while Nikkei ended the day with a sharp loss of over 300 points. Prime Minister Shigeru Ishiba’s dissolution of the lower house of parliament earlier this month has set the stage for the House of Representatives election on October 27. Concerns are rising that the ruling Liberal Democratic Party and its coalition partner, Komeito, could lose their majority, injecting more political instability into an already fragile market.
Adding to the Yen's weakness is the apparent political vacuum regarding currency intervention. Despite the Yen's rapid depreciation, Japanese authorities have remained unusually silent, offering no verbal intervention to stem the decline. Traders have interpreted this silence as a tacit approval to continue selling Yen without fear of official pushback. Unless there's a significant shift in policy communication from Japanese officials, the Yen may face further downside pressure throughout the week, at least until the election results provide clearer direction on Japan's politics.
Across the broader forex market, Dollar continues to extend its broad-based gains, benefiting from rising yields and expectations of a slower pace of Fed easing. The Canadian Dollar is the second strongest performer, with markets awaiting the Bank of Canada’s interest rate cut, updated economic projections, and any signals regarding future policy easing. Yen, by far the worst performer this week, faces steep losses. Australian and New Zealand Dollars are also under pressure, with their declines gaining momentum, while Euro and Sterling remain stuck in the middle of the pack.
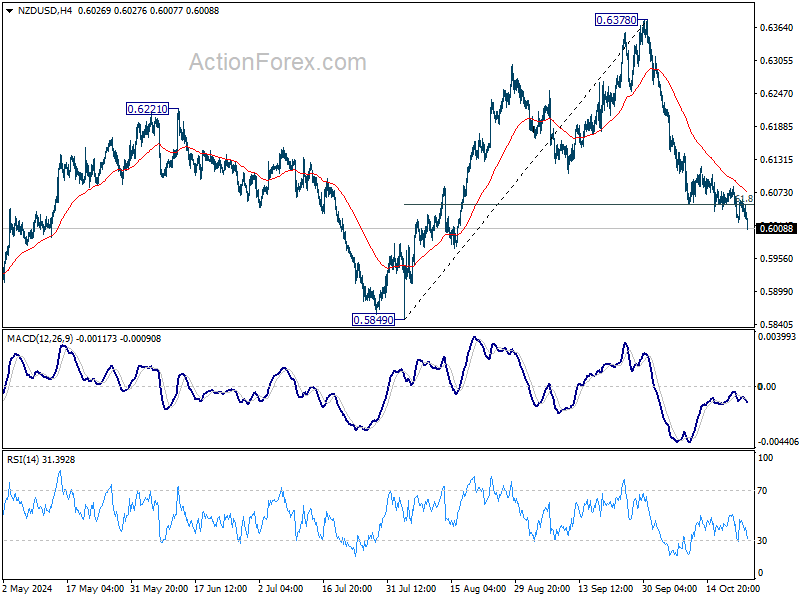
Technically, NZD/USD is picking up downside momentum as fall from 0.6378 extends. As long as 4H EMA (now at 0.6073) holds, there is risk of further downside acceleration towards 0.5849 low next.
 In Europe, at the time of writing, FTSE is down -0.54%. DAX is down -0.15%. CAC is down -0.58%. UK 10-year yield is up 0.040 at 4.210. Germany 10-year yield is down -0.005 at 2.317. Earlier in Asia, Nikkei fell -0.80%. Hong Kong HSI rose 1.27%. China Shanghai SSE rose 0.52%. Singapore Strait Times rose 0.37%. Japan 10-year JGB yield fell -0.001 to 0.979.
BoC to Slash Rates by 50bps
BoC is widely anticipated to lower its policy rate by 50bps to 3.75% today, marking the fourth consecutive rate cut. The central bank is stepping up its monetary easing, as policymakers are increasingly worried that the current high level of interest rates is causing additional economic pain.
Recent economic indicators support the case for the more aggressive adjustment. Unemployment rate surged to a seven-year high (excluding the pandemic period) of 6.6% in August before dipping slightly to 6.5% in September. Even at 6.5%, unemployment remains a full percentage point higher than a year earlier. Additionally, per capita GDP has contracted for five consecutive quarters. With inflation falling more rapidly to 1.6% in September, the BoC has room to act swiftly.
The key question now is the pace of future policy easing. There are firm expectations that the interest rate will fall to a neutral range between 2.25% and 3.25% by the end of next year. Among major financial institutions, Scotiabank is forecasting a more conservative year-end policy rate of 3.00%, while National Bank and RBC anticipate a more aggressive path to 2.00% by the end of 2025. These projections will likely be reassessed based on BoC's new economic forecasts released today.
USD/JPY Mid-Day Outlook
Daily Pivots: (S1) 150.66; (P) 150.93; (R1) 151.36; More...
USD/JPY accelerates to as high as 153.18 so far and intraday bias stays on the upside. Decisive break of 61.8% retracement of 161.94 to 139.57 at 153.39 will pave the way to retest 161.94 high. On the downside, below 151.18 minor support will turn intraday bias neutral first. But further rally will now remain in favor as long as 55 D EMA (now at 147.85) holds, in case of retreat.
In the bigger picture, price actions from 161.94 are seen as a corrective pattern to rise from 102.58 (2021 low). The range of medium term consolidation should be set between 38.2% retracement of 102.58 to 161.94 at 139.26 and 161.94. Nevertheless, sustained break of 139.26 would open up deeper medium term decline to 61.8% retracement at 125.25.
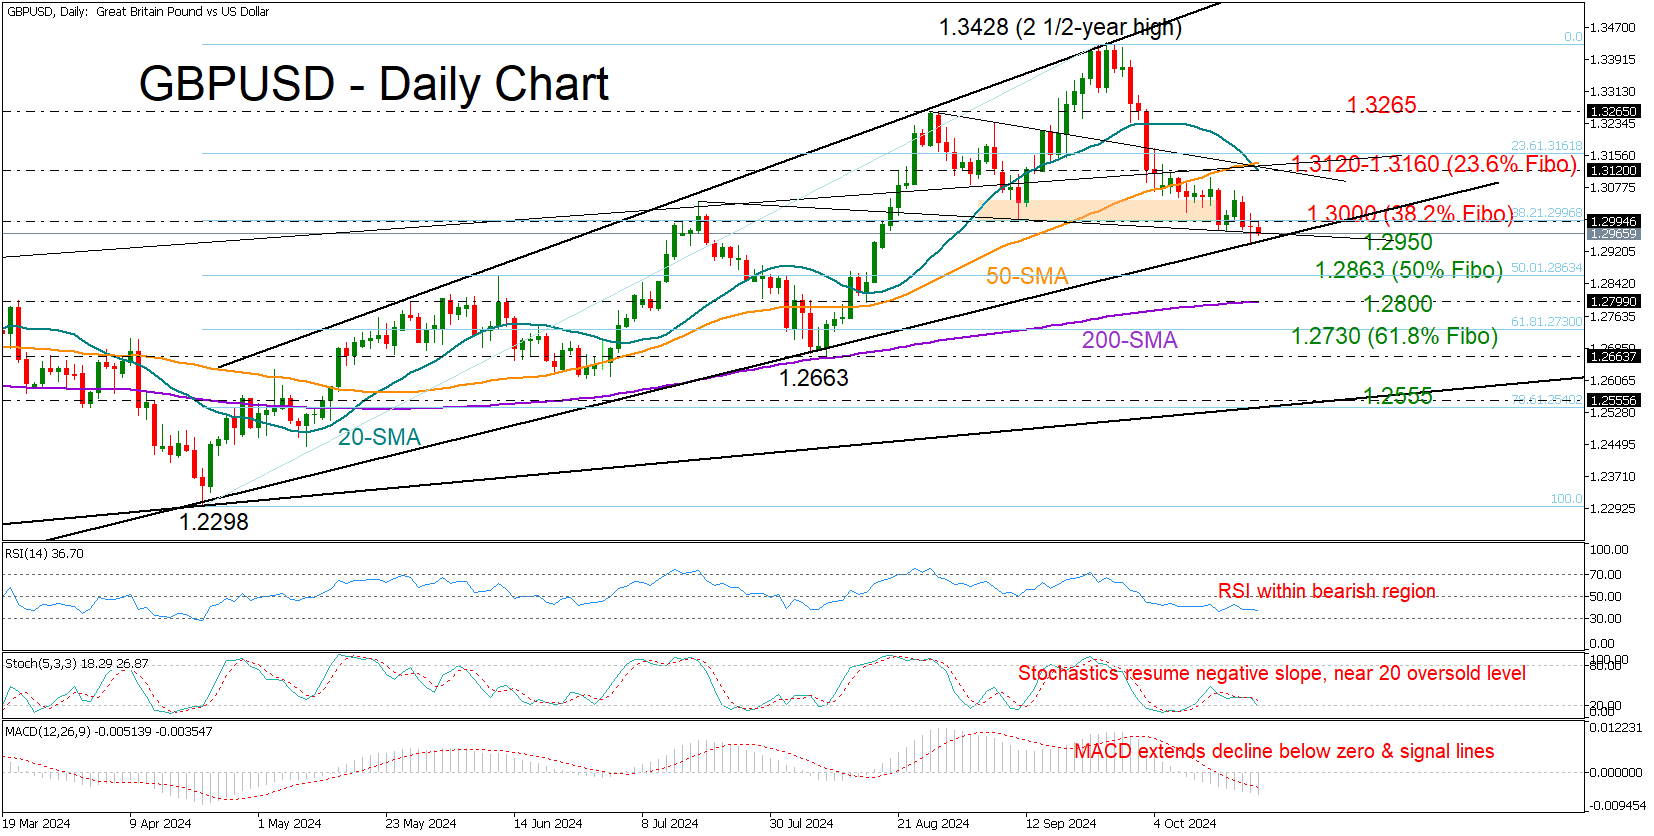
GBPUSD: One More Burst of Strength?
- GBPUSD prints new lower low, reaches long-term support trendline
- Technical signals remain discouraging; more sellers wait below 1.2950
GBPUSD is currently in its fourth consecutive week of losses, gradually slipping below the 1.3000 mark for the first time since August. The pair recently hit a new lower low of 1.2943, with technical indicators reflecting persisting selling appetite. However, the long-term support trendline drawn from the 2022 bottom, currently around 1.2950, is providing some protection for the broader uptrend.
A close below the 1.2950 threshold could dampen market sentiment, causing another decline toward the 200-day simple moving average (SMA) at 1.2800, especially if the 50% Fibonacci retracement level from the April-September uptrend at 1.2863 is breached. Additional losses may pause near the 61.8% Fibonacci level at 1.2730 or could even extend toward the August low of 1.2663. If this trend continues, the pair could approach the ascending line connecting the October 2023 lows around 1.2555.
Conversely, if GBPUSD manages to reclaim the 1.3000 level, it could next target the 20- and 50-day SMAs around 1.3120, as well as the 23.6% Fibonacci level at 1.3160. A successful break above these barriers could pick up pace toward August's high of 1.3265.
In summary, while GBPUSD currently exhibits a bearish bias, the long-term support at 1.2950 could allow for some recovery, keeping traders alert for potential shifts in momentum.
Gold (XAU/USD), Silver (XAG/USD) Print Fresh Highs as the DXY Eyes 105.00
- Gold and Silver prices reach new highs amidst a rising US Dollar, driven by global uncertainties and a potential Trump Presidency.
- Silver’s demand/supply dynamics bode well for further gains.
- The US Dollar Index (DXY) strengthens due to positive economic data and fading rate cut expectations, with a potential rise to 105.00.
Gold prices have smashed through the 2750 handle despite the US Dollar continuing its advance. The precious metal has attracted bids with some believing this could be down to markets preparing for a potential Trump Presidency in the US.
There does not appear to be a single factor driving Gold prices but rather a combination of rising uncertainties for global market participants to consider. Global conflicts, trade wars and a potential Trump Presidency are at the forefront and that is leaving out the uncertain economic situation in many countries.
Despite sky high stock prices in the US and what seems to be improving sentiment, Gold, a notorious safe haven bet reveals a different story. Gold prices have been on a tear this year and with many people still viewing the precious metal as a safe haven, are market participants telling us something?
Silver (XAG/USD) Demand/Supply Dynamics Bodes Well for Bulls
A commodity that has flown under the radar of late has been silver, as prices soared to new all time highs. Silver is trading in the mid 34’s at present with market analysts noting that more gains could be in store for silver prices.
Looking more closely at Silver, the appeal is quite evident. Silver is used in a host of electronic products manufactured today and the rise of tech is only going to increase the demand for silver.
Given the physical shortage already present in silver markets there is a huge possibility that the rally could continue. Looking at the chart below, you can see the huge discrepancy between demand (blue line) and supply (white line) which I expect will underpin prices moving forward.
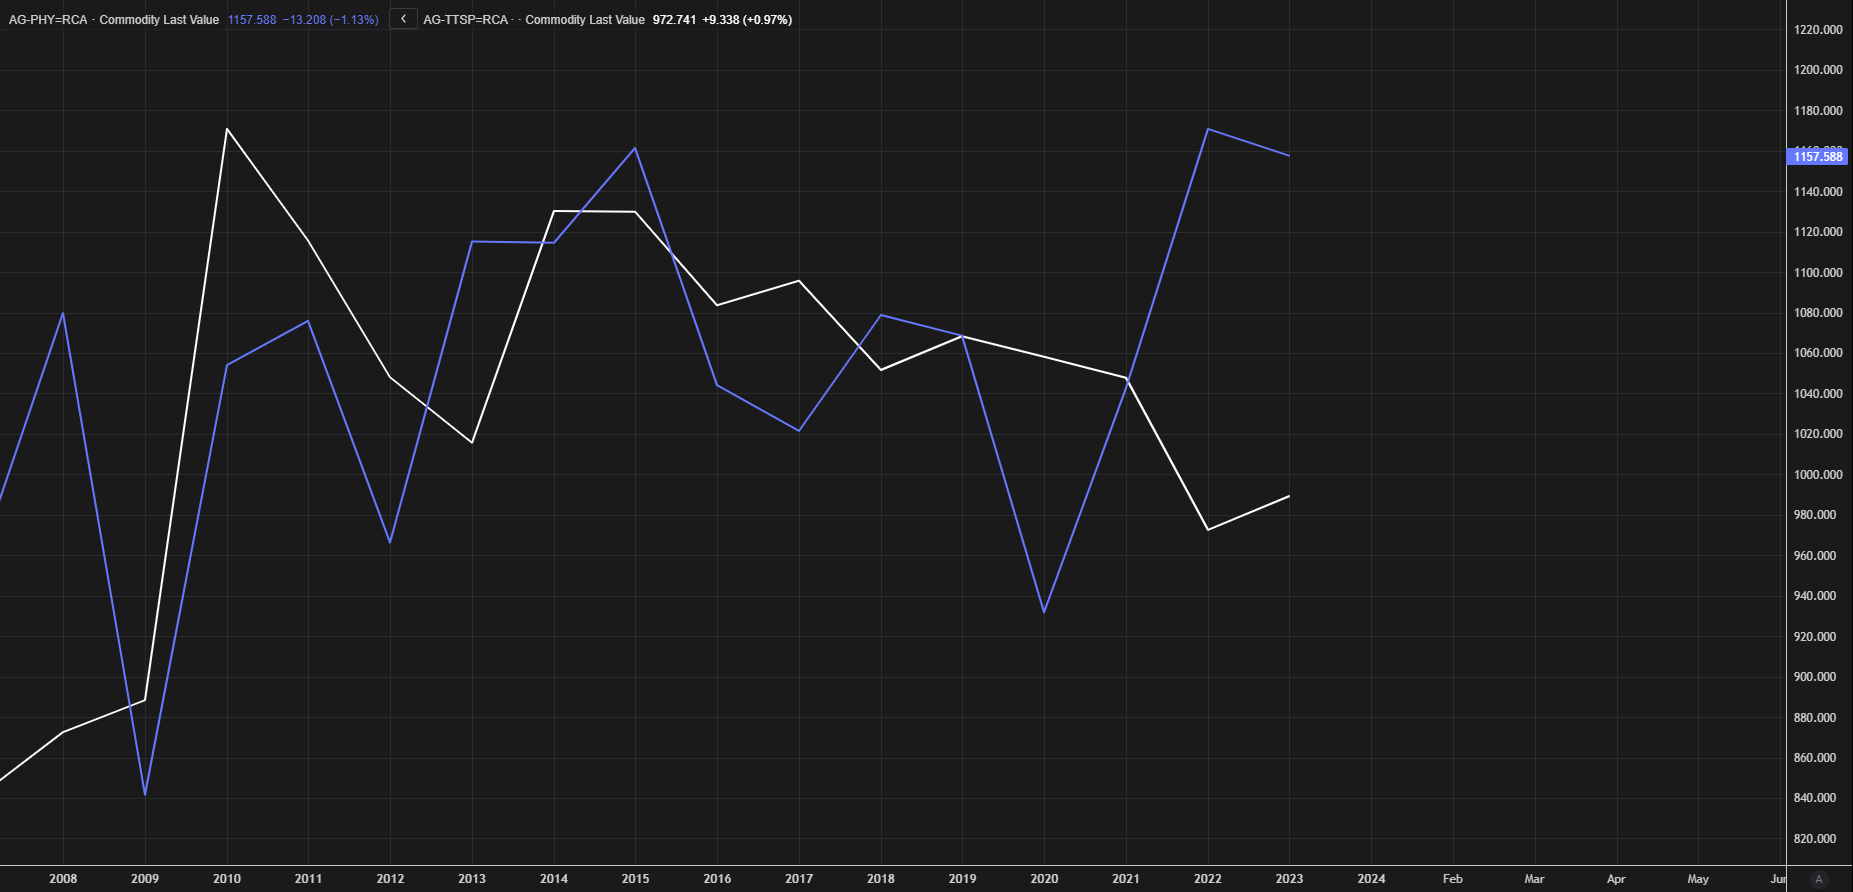
Source: LSEG Workspace
US Dollar Index (DXY) Eyes a Rise to 105.00 Key Level
The US Dollar continues its rise on positive data and fading rate cut expectations. Markets have been digesting comments from Fed Policymakers over the last week or so which has largely leaned on the hawkish side.
As markets adapt to fewer anticipated rate cuts in the US compared to more aggressive cuts by other central banks, the US Dollar may be set to keep rising. There is growing talk of a ‘Trump trade’ as US Treasury yields have experienced some interesting swings off late. This may be another area to focus on when looking at the greenback moving toward the US election.
US Dollar Index (DXY) Daily Chart, October 23, 2024
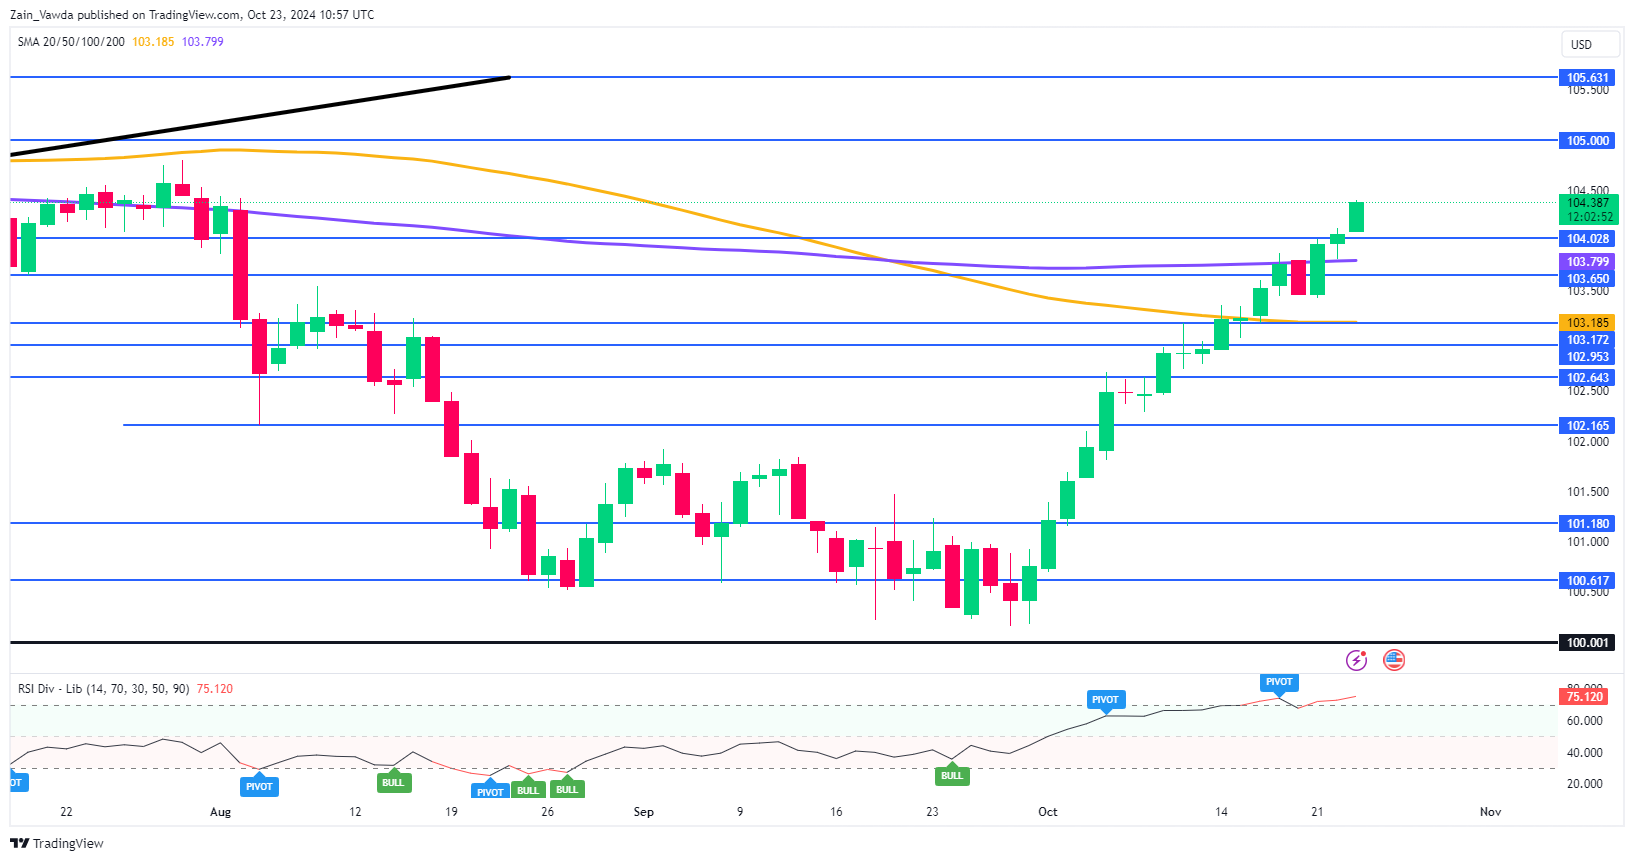
Source: TradingView
Technical Analysis Gold (XAU/USD)
From a technical analysis standpoint, Gold continues to print fresh highs and languish in overbought territory. As we know markets are able to languish in overbought territories for extended periods of time and thus the Gold rally could continue.
Gold is currently flirting with the key level at 2750 with a drop lower opening up a retest of the support area at 2739. Lower down we could look at areas of support around 2724 and 2714.
The upside provides us with less insight with today’s highs at 2758 an area to keep an eye on before the psychological level at 2775.
GOLD (XAU/USD) Four-Hour (H4) Chart, October 23, 2024
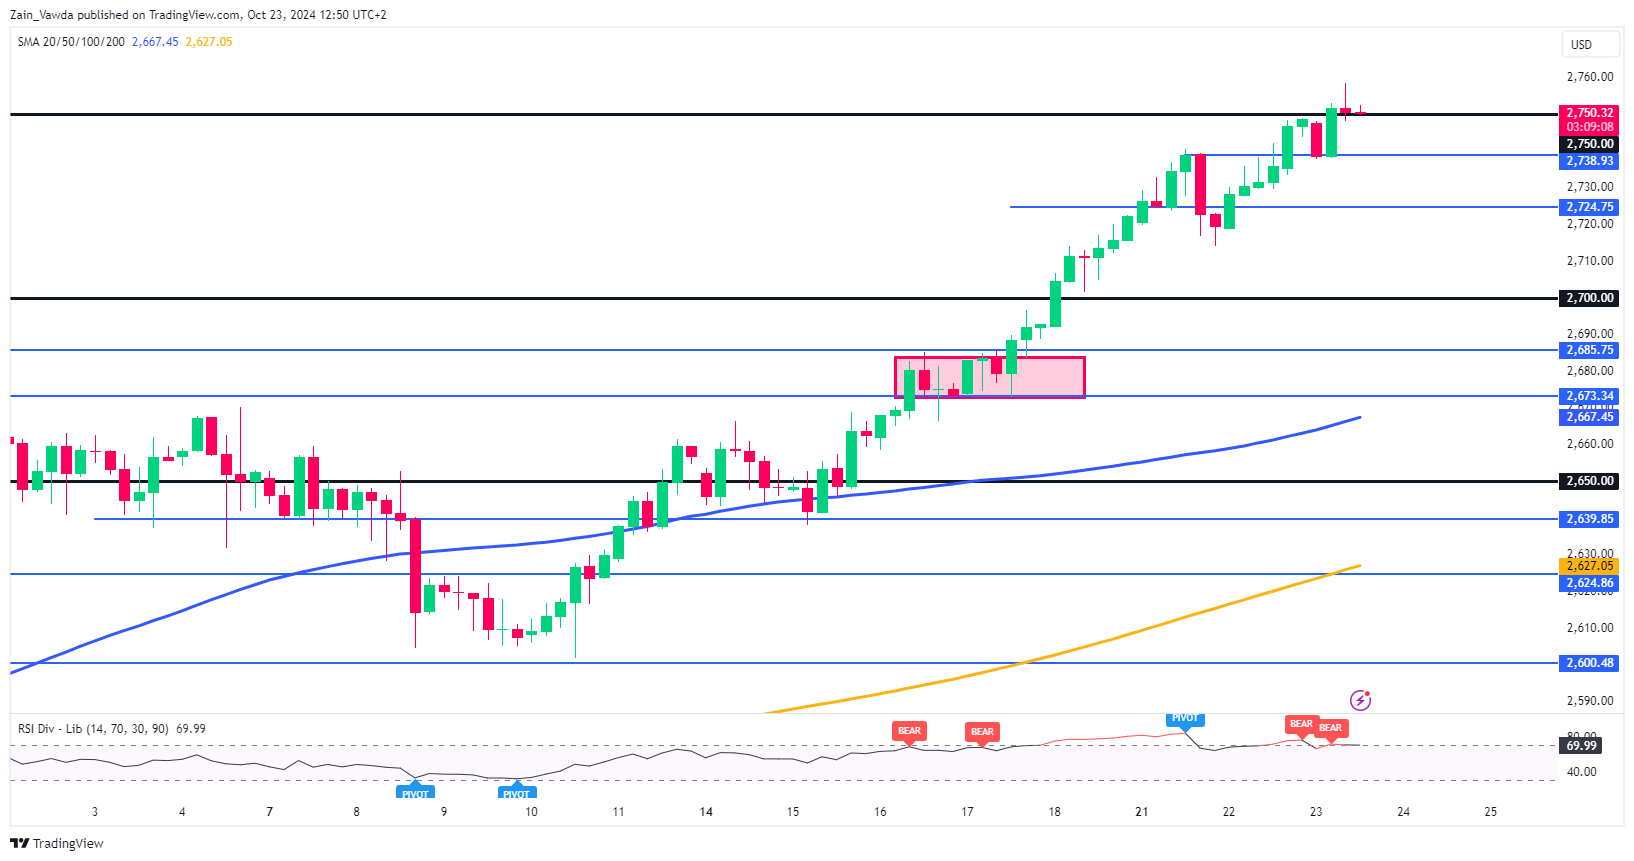
Source: TradingView (click to enlarge)
Support
- 2739
- 2724
- 2714
Resistance
- 2758
- 2775
- 2800
Yen Slides as IMF Cuts Japan’s Growth Estimate
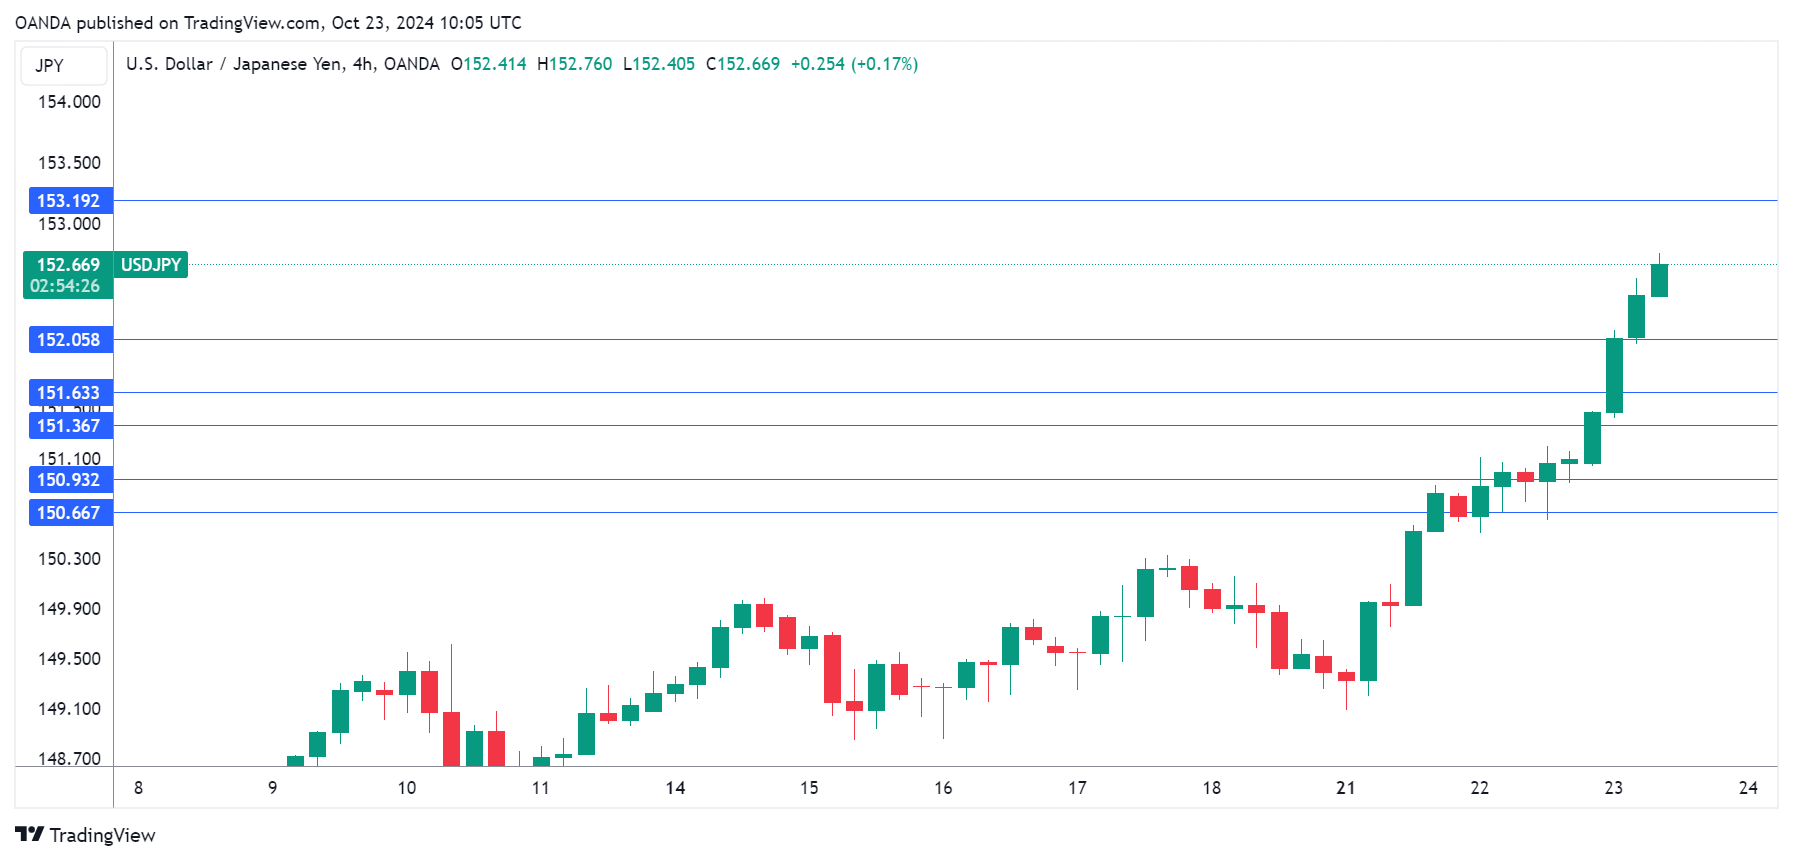
The Japanese yen has posted sharp losses on Wednesday. In the European session, USD/JPY is trading at 152.67, up 1.06% at the time of writing. The yen is down 2.1% this week and has plunged 6.3% in October.
IMF slashes Japan’s growth forecast
The International Monetary Fund slashed its 2024 growth forecast for Japan to just 0.3%, down sharply from the 0.7% forecast in June. This is the lowest estimate since 2020, during the Covid-19 pandemic which severely impacted the economy. The IMF highlighted the “fading of a one-off boost” in tourism and disruptions in auto supply chains. Japan’s economy grew 1.7% in 2023, aided by a strong increase in tourism.
The IMF said it expects the economy to rebound in 2025 and expand 1.1% as private consumption and wage growth improve, assuming that the Bank of Japan continues to raise rates “toward a neutral setting of about 1.5%.”
The BoJ raised interest rates out of negative territory in July to the current rate of 0.25%. The markets are expecting further hikes but the central bank has been very cautious and wants to see evidence of sustainable inflation at 2% before making additional hikes. This has made the BoJ an outlier among major central banks, most of which are in a rate-cutting cycle in response to falling inflation. Japan releases Tokyo Core CPI, a key inflation indicator, on Thursday. The indicator is expected to ease to 1.7% in September, down from 2% in August.
The BoJ meets on Oct. 30-31, right after a general election on Oct. 27. The Bank will likely maintain policy settings but the markets will be keeping a close eye on the quarterly projections for inflation and growth.
USD/JPY Technical
- USD/JPY has pushed above several resistance lines today and the next resistance line is 153.19
- 150.93 and 150.66 are providing support
USD/JPY Climbs to Three-Month Peak Amid US Dollar Strength
The USD/JPY currency pair surged to near three-month highs, hitting 151.79, driven by the strengthening US dollar and rising US government bond yields. The appreciation of the US dollar was supported by favourable macroeconomic data from the US and ongoing demand for safe-haven assets in anticipation of the upcoming US elections.
Japan's political landscape is uncertain as it approaches its general elections this weekend. Preliminary polls indicate that the ruling Liberal Democratic Party could potentially lose its majority, intensifying concerns over political stability and the future direction of the Bank of Japan's monetary policy. Such political uncertainties further diminish the prospects of the Japanese yen regaining strength against a robust US dollar.
The current environment suggests that the Bank of Japan is unlikely to intervene effectively under these conditions. Market expectations are that any attempts at intervention would be futile against the prevailing strong demand for the dollar. The yen's fate now heavily depends on the outcome of Japan's elections and the subsequent actions of the Bank of Japan, particularly regarding interest rate decisions.
Technical analysis of USD/JPY
The USD/JPY has established a narrow consolidation range around 150.85 and has broken upwards, continuing its ascent towards the 152.52 target. Once this level is reached, a potential corrective move back down to 150.85 may occur, testing this level from above before another likely ascent to 152.72. The MACD indicator supports this bullish pattern, with its signal line well above zero and sharply upwards, indicating strong upward momentum.
On the hourly chart, USD/JPY has developed a growth structure towards 152.85. Following the achievement of this level, a corrective phase towards 150.85 is anticipated, with an initial correction target set at 151.70. The Stochastic oscillator further underscores this potential pullback, with its signal line positioned above 80 but poised to descend towards 20, suggesting an imminent downward adjustment before further gains.
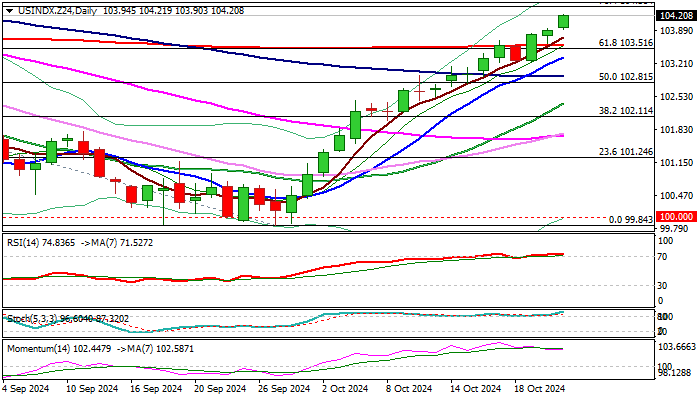
US Dollar Index Outlook: Dollar Rises Further on Less Aggressive Fed Rate Cut Outlook
The dollar remains in strong bullish acceleration for the third consecutive day, boosted by expectations that Trump’s victory in the US presidential election would boost the economy and ease pressure on Fed, while fading expectations for aggressive rate cuts in coming months, added support the US currency.
The dollar index, which tracks performance of US Dollar against the basket of major currencies, broke above 104.00 barrier and rose to eleven-week high on Wednesday.
Bulls eye targets at 104.38/54 (Fibo 76.4% of 105.78/99.84 / July 30 lower top, violation of which to open way towards 105.78 (June 28 peak).
Meanwhile, negative signals are developing on daily chart (bullish momentum is fading and RSI is overbought) and suggest that bulls may start losing traction in coming sessions and pause for consolidation.
Bullish structure of daily studies (multiple MA bull-crosses / strong positive momentum) suggest that larger bulls hold grip, and corrective action should be limited.
Broken 200DMA / Fibo 61.8% (103.57/51) should provide firm ground and prevent deeper pullback towards 103.00/102.80 zone.
Res: 104.38; 104.54; 105.00; 105.47.
Sup: 103.90; 103.57; 103.33; 103.00.
USD/JPY Outlook: Advances 1% on Wednesday Morning
Strong acceleration higher in Asian / early European trading on Wednesday (the pair was up 1%) pushed the USDJPY’s price to new multi-week highs, last traded in late July.
Recent break of psychological 150 barrier was followed by emerge from thick daily Ichimoku cloud and lift above next pivot at 150.76 (100DMA / 50% retracement of 161.95/139.57 descend) set the scope for acceleration through 200DMA (151.36) and round-figure resistance at 152.00.
The Dollar received fresh boost from revised view on Fed monetary policy towards gradual rate cuts, while markets keep an eye on US presidential elections, as growing expectations of Trump’s victory mark another supportive factor for the dollar.
Daily close above 200DMA to confirm fresh bullish signal for further advance, with Friday’s close above rising weekly cloud, to validate strong bullish structure.
Bulls pressure target at 153.40 (Fibo 61.8%) but may face headwinds as daily studies are overbought.
Shallow dips to mark positioning for further advance with 200DMA now acting as initial support (151.36), followed by broken Fibo / 100DMA / daily cloud top (150.70 zone) where dips should find a footstep and keep intact pivotal 150 support, reinforced by 10DMA.
Res: 150.00; 150.76; 151.00; 151.40.
Sup: 149.16; 149.00; 148.86; 148.12.